Exacerbations are crucial events during bronchiectasis progression.
ObjectivesTo explore the associations between bacterial, viral, and bacterial plus viral isolations and bronchiectasis exacerbations.
MethodsIn this prospective study, we enrolled 108 patients who were followed up every 3–6 months and at onset of exacerbations between March 2017 and November 2018. Spontaneous sputum was split for detection of bacteria (routine culture) and viruses (quantitative polymerase chain reaction). Symptoms and lung function were assessed during exacerbations.
ResultsThe median exacerbation rate was 2.0 (interquartile range: 1.0–2.5) per patient-year. At any visit, viral isolations (V+) occurred more frequently during onset of exacerbations [odds ratio (OR): 3.28, 95% confidence interval (95%CI): 1.76–6.12], as did isolation of new bacteria (NB+) (OR: 2.52, 95%CI: 1.35–4.71) and bacterial plus viral isolations (OR: 2.24, 95%CI: 1.11–4.55). Whilst coryza appeared more common in exacerbations with V+ than in exacerbations with no pathogen isolations and those with NB+, lower airway symptoms were more severe in exacerbations with NB+ (P<.05). Sputum interleukin-1β levels were higher in exacerbations with NB+ than in exacerbations with no pathogen isolations and those with V+ (both P<.05). Significantly more coryza symptoms correlated with bacterial plus viral isolations at exacerbations (P=.019). Compared with V+ alone, bacterial with and without viral isolations tended to yield more severe lower airway symptoms, but not sputum cytokine levels at exacerbations.
ConclusionsViral isolations, isolation of new bacteria and bacterial plus viral isolation are associated with bronchiectasis exacerbations. Symptoms at exacerbations might inform clinicians the possible culprit pathogens.
Las exacerbaciones son eventos cruciales durante la progresión de la bronquiectasia.
ObjetivosAnalizar las asociaciones entre el aislamiento de bacterias, virus y virus y bacterias juntas y las exacerbaciones de las bronquiectasias.
MétodosEn este estudio prospectivo se incluyó a 108 pacientes a los que se siguió cada 3-6 meses y al comienzo de las exacerbaciones entre marzo de 2017 y noviembre de 2018. La muestra de esputo espontáneo se dividió para la detección de bacterias (cultivo de rutina) y virus (reacción en cadena de la polimerasa cuantitativa). Se evaluaron los síntomas y la función pulmonar durante las exacerbaciones.
ResultadosLa mediana de la tasa de exacerbación fue de 2,0 (rango intercuartil: 1,0-2,5) por paciente/año. En cualquier visita, los aislamientos de virus (V+) tuvieron lugar con mayor frecuencia durante el inicio de las exacerbaciones (odds ratio [OR]: 3,28; intervalo de confianza del 95% [IC 95%]: 1,76-6,12), al igual que el aislamiento de nuevas bacterias (NB+) (OR: 2,52; IC 95%: 1,35-4,71) y los aislamientos de bacterias y virus juntos (OR: 2,24; IC 95%: 1,11-4,55). Mientras que la coriza parecía más común en las exacerbaciones con V+ que en las exacerbaciones sin aislamientos de patógenos y en aquellas con NB+, los síntomas de las vías respiratorias inferiores fueron más graves en las exacerbaciones con NB+ (p<0,05). Los niveles de interleucina-1β en el esputo fueron más altos en las exacerbaciones con NB+ que en las exacerbaciones sin aislamiento de patógenos, y aquellas con V+ (ambos p<0,05). De manera significativa, más síntomas de coriza se correlacionaron con aislamientos de bacterias y virus juntos durante las exacerbaciones (p=0,019). Comparados con los V+ en solitario, los aislamientos de bacterias con y sin virus tienden a producir síntomas más graves en las vías respiratorias inferiores, pero no alteran los niveles de citocinas en el esputo durante las exacerbaciones.
ConclusionesLos aislamientos de virus, el aislamiento de nuevas bacterias y el aislamiento de bacterias y virus juntos están asociados a las exacerbaciones de las bronquiectasias. Los síntomas de las exacerbaciones pueden proporcionar información a los médicos sobre los posibles patógenos responsables.
Bronchiectasis is a debilitating chronic airway inflammatory disease aggravated by bacterial and/or viral infections.1–4 Acute exacerbations (AEs) are critical events associated with a considerable morbidity and mortality,5 contributing to significantly impaired quality-of-life.6–8 Understanding the roles of pathogens may help diagnose and identify targets for interventions.
Infections are frequently associated with AEs. The dilated bronchi become the niche for bacteria, viruses and fungi.9–11 Viruses have frequently been isolated during AEs in bronchiectasis (detection rate: 30%–50%).11,12 No significant changes in total bacterial density and microbial compositions were observed during AEs.13 Nevertheless, antibiotics remain the principal effective management for AEs, suggesting that bacterial isolations might have aggravated the inflammatory responses.14,15
Accumulating evidence has demonstrated the interactions between pathogenic bacteria, viruses, and host-defense in chronic airway inflammatory diseases.16 Bacterial plus viruses (e.g. non-typeable Haemophilus influenzae with rhinovirus isolation) were more frequently detected during chronic obstructive pulmonary disease (COPD) exacerbations than stable state, and correlated with more severe COPD exacerbations.17–19 The roles of bacteria and viruses in bronchiectasis have been reported separately. No prospective study has investigated the impacts of bacterial plus viral isolations in adults with bronchiectasis. Moreover, symptoms that could differentiate bacterial from viral or bacterial plus viral isolation during exacerbations are not entirely clear.
We aimed to explore the associations between bacterial and viral isolations and AEs, and further investigate the clinical characteristics which could indicate the possible pathogen isolations during AEs.
MethodsStudy PopulationIn this observational single-center prospective study, we recruited bronchiectasis patients aged 18–75 years from out-patient clinics of The First Affiliated Hospital of Guangzhou Medical University between March 2017 and November 2018. Bronchiectasis was diagnosed according to chest high-resolution computed tomography (reviewed by an experienced radiologist) with compatible clinical symptoms (e.g. chronic cough, sputum production). Eligible patients remained clinically stable (respiratory symptoms not exceeding normal daily variations), and had no use of antibiotics (except for low-dose macrolides) for four weeks. Active tuberculosis, malignancy, acute respiratory tract infections within four weeks and asthma or COPD as the primary diagnosis were excluded. The study protocol was approved by The Ethics Committee of The First Affiliated Hospital of Guangzhou Medical University (Medical Ethics 2012, the 29th). All patients signed informed consent.
Study Design and Clinical AssessmentAt initial visits, clinical evaluations included demography, clinical history, spirometry and exacerbation rate within the preceding 12 months. Blood and sputum were collected. Spirometry was performed according to international guidelines.20 Radiologic severity was assessed with modified Reiff score.21 Disease severity was calculated with bronchiectasis severity index (BSI)8 and E-FACED score.22 Patients were followed up at 3–6-month intervals until November 2018 (multiple visits), and were requested to contact investigators upon significant worsening of symptoms for an additional visit, scheduled within 48h (antibiotic use, if any, did not exceed 24h). The upper limit of duration from symptom onset was 7 days (5 days after confirming symptom onset) for AE visits. Symptom questionnaire (see Online Supplement) which queried upper and lower airway symptoms [rating the severity with visual analog scale (VAS, range: 0–10)], spirometry, sputum and blood specimens were obtained during each follow-up, including stable visits and AE visits.
AEs were defined as significant deterioration (>48h) of ≥3 symptoms, including cough frequency, sputum volume and/or consistency, sputum purulence, breathlessness and/or exercise tolerance, fatigue and/or malaise, hemoptysis, which required immediate changes in treatment.23 Treatment decisions were made before all testing results became available.
Sputum Collection and ProcessingDetails are shown in Online Supplement. Briefly, patients thoroughly rinsed their mouth, followed by deep cough for collecting spontaneous sputum. Sputum plugs (the most purulent portion) were selected from eligible samples (leukocytes/epithelial cells >2.5:1).10,11 No uniform techniques of chest physiotherapy was employed. Sputum was immediately split for bacterial culture, viral detection with multiplex quantitative polymerase chain reaction (qPCR), and ultracentrifugation (20,000×g) for 2h at 4°C for sputum sol preparation and storage at −80°C for inflammatory biomarkers (interleukin-1β, CXC motif chemokine-8, tumor necrosis factor-α and interferon-γ) multiplex assays as described previously.10,11
Bacterial and Viral DetectionWe did bacterial culture by homogenizing fresh sputum with SPUTASOL (Oxoid SR089A, UK), followed by inoculation in blood and chocolate agar plates (Biomeurix Inc., France) for overnight incubation.11 Pathogenic bacteria included, but not limited to, Pseudomonas aeruginosa, Haemophilus influenzae, Haemophilus parainfluenzae, Klebsiella pneumoniae, Streptococcus pneumoniae, Streptococcus aureus and Escherichia coli.10 Isolation of new bacteria denoted sputum culture findings switching from negative to positive, or from any pathogenic bacterium to another pathogenic bacterium.
We extracted viral nucleic acids using extraction kit (TaKaRa MiniBEST Viral RNA/DNA Extraction Kit Ver. 5.0). We conducted qPCR based on TaqMan™ probes to identify sixteen common respiratory viruses: rhinovirus, influenza virus A/B, parainfluenza virus 1–4, human coronavirus (HCoV-229E, OC43, NL63 and HKU1), respiratory syncytial virus, adenovirus, enterovirus, bocavirus and human metapneumovirus. Validated viral detection kits were purchased from Guangzhou HuYanSuo Medical Technology Co., Ltd., Guangzhou, China.11,24 The cycle threshold (Ct) of <40 was considered positive. Lower Ct indicated higher viral loads.
Statistical AnalysisNo data exist regarding the proportion of patients with bacterial plus viral isolations in bronchiectasis. Assuming an equivalent proportion of patients with bacterial isolation during stable-states and AEs, and the difference of 20% in virus detection rate between AEs and stable-states,11 107 bronchiectasis patients would be needed based on the two-sided significance of 0.05 and power of 80%, taking into account a 25% drop-out rate.
Data were expressed as mean±standard deviation or median (interquartile range, IQR) for continuous variables, and count (percentage) for categorical variables. Generalized estimating equations with logit link were used to explore the association between pathogen isolation and the odds of AEs compared with stable visits, taking into account repeated observations in individual participants. Continuous variables were analyzed with t-test, analysis-of-variance, Mann–Whitney or Kruskal–Wallis test depending on the variable distribution. Categorical variables were compared with Chi-square or Fisher's exact test. Missing values were not imputed. Statistical analysis was performed using SPSS 18.0 (SPSS Inc., Chicago, USA) and Graphpad Prism version 5.0 (Graphpad Inc., USA).
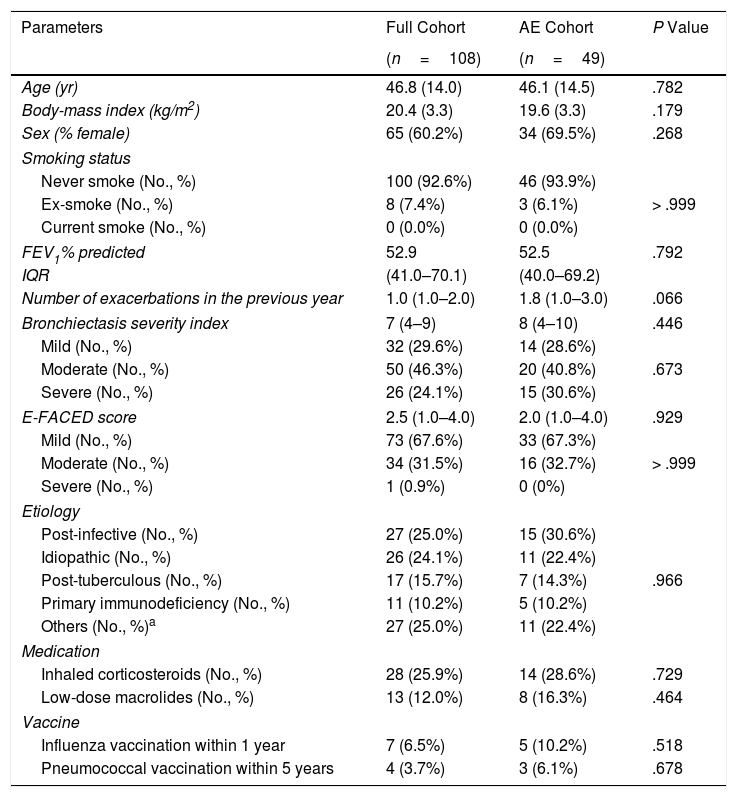
ResultsRecruitment and Clinical CharacteristicsOf 130 patients screened, 108 patients were enrolled and 98 were followed-up (Fig. 1). The median follow-up duration was 13.0 months. The 108 patients provided 375 sputum samples (299 for stable-visits; 76 for AEs), with a median (IQR) of 3.0 (2.0–4.0) sputum specimens per patient. Seventy-three patients (74.5%) experienced at least one AE, and reported 169 AEs during follow-up (76 AEs sampled because 63.2% contacted too late, 21.1% declined due to no availability, 10.5% administered antibiotics for >2 days, and 5.2% yielded no sputum). Sputum was mostly sampled before antibiotic administration during AEs except that 2 samples were sampled within 24h of antibiotic administration. The clinical characteristics did not differ between patients who did and did not provide sputum during AEs (Table E1).

Patient characteristics of the full and AE cohort are shown in Table 1. The mean age was 46.8 years. The median BSI was 7.0 (IQR: 4–9) and the E-FACED score was 2.5 (IQR: 1.0–4.0). The most common etiologies were post-infective and tuberculosis. Asthma was the primary etiology in eight (7.4%) patients.
Demographic and Clinical Characteristics of the Study Cohort.
| Parameters | Full Cohort | AE Cohort | P Value |
|---|---|---|---|
| (n=108) | (n=49) | ||
| Age (yr) | 46.8 (14.0) | 46.1 (14.5) | .782 |
| Body-mass index (kg/m2) | 20.4 (3.3) | 19.6 (3.3) | .179 |
| Sex (% female) | 65 (60.2%) | 34 (69.5%) | .268 |
| Smoking status | |||
| Never smoke (No., %) | 100 (92.6%) | 46 (93.9%) | > .999 |
| Ex-smoke (No., %) | 8 (7.4%) | 3 (6.1%) | |
| Current smoke (No., %) | 0 (0.0%) | 0 (0.0%) | |
| FEV1% predicted | 52.9 | 52.5 | .792 |
| IQR | (41.0–70.1) | (40.0–69.2) | |
| Number of exacerbations in the previous year | 1.0 (1.0–2.0) | 1.8 (1.0–3.0) | .066 |
| Bronchiectasis severity index | 7 (4–9) | 8 (4–10) | .446 |
| Mild (No., %) | 32 (29.6%) | 14 (28.6%) | .673 |
| Moderate (No., %) | 50 (46.3%) | 20 (40.8%) | |
| Severe (No., %) | 26 (24.1%) | 15 (30.6%) | |
| E-FACED score | 2.5 (1.0–4.0) | 2.0 (1.0–4.0) | .929 |
| Mild (No., %) | 73 (67.6%) | 33 (67.3%) | > .999 |
| Moderate (No., %) | 34 (31.5%) | 16 (32.7%) | |
| Severe (No., %) | 1 (0.9%) | 0 (0%) | |
| Etiology | |||
| Post-infective (No., %) | 27 (25.0%) | 15 (30.6%) | .966 |
| Idiopathic (No., %) | 26 (24.1%) | 11 (22.4%) | |
| Post-tuberculous (No., %) | 17 (15.7%) | 7 (14.3%) | |
| Primary immunodeficiency (No., %) | 11 (10.2%) | 5 (10.2%) | |
| Others (No., %)a | 27 (25.0%) | 11 (22.4%) | |
| Medication | |||
| Inhaled corticosteroids (No., %) | 28 (25.9%) | 14 (28.6%) | .729 |
| Low-dose macrolides (No., %) | 13 (12.0%) | 8 (16.3%) | .464 |
| Vaccine | |||
| Influenza vaccination within 1 year | 7 (6.5%) | 5 (10.2%) | .518 |
| Pneumococcal vaccination within 5 years | 4 (3.7%) | 3 (6.1%) | .678 |
Notes: yr=year; FEV1=forced expiratory volume in 1s.
Data are presented as mean (standard deviation) or median (interquartile range) or n (%).
Other aetiologies included: Kartagener's syndrome: 8 (7.4%), asthma-associated condition 8 (7.4%), gastro-oesophageal reflux disease: 3 (2.8%), diffuse panbronchiolitis: 3 (2.8%), connective tissue disease: 2 (1.9%), cystic fibrosis transmembrane conductance regulator-related disease: 1 (0.9%), congenital lung maldevelopment: 1 (0.9%).
None of the study participants was receiving inhaled antibiotics during the study. None of the study participants had physician-diagnosed cystic fibrosis.
The percentage of no pathogen detection, bacterial isolation, viral detection and bacterial plus viral detection was 35.8%, 52.8%, 4.4% and 7.0%, respectively during stable-visits, while the corresponding percentage was 23.7%, 47.3%, 14.5% and 14.5%, respectively during AEs (P=.001, Fig. 2A). 59.8% of stable-visits samples and 61.9% of AEs samples tested positive to bacteria (P=.753). The three prevalent species isolated in stable-visits and AEs samples were Pseudomonas aeruginosa (44.4% vs. 32.1%), Haemophilus influenzae (9.8% vs. 15.4%) and Escherichia coli (2.0% vs. 3.8%). However, we noted a higher detection rate of Haemophilus influenzae, Moraxella catarrhalis and Streptococcus pneumoniae during AEs. The overall bacterial compositions that took into account all bacterial species did not differ remarkably between stable-visits and AEs (P=.070, Fig. 2B).
, Acinetobacter baumannii (n=2), Moraxella catarrhalis (n=2), Pseudomonas ozanae (n=1), Staphylococcus aureus (n=1), Haemophilus haemolyticus (n=1), Haemophilus parahaemolyticus (n=1), Streptococcus pneumoniae (n=1), Shewanella algae (n=1), Actinomyces ureae (n=1), Pasteurella multocida (n=1), Enterobacter aerogen (n=1) and Serratia marcescens (n=1). There were more patients isolated with two bacteria when clinically stable. Hence, the overall percentage of patients isolated with pathogenic bacteria appeared higher when clinically stable compared with AE onset.")
Percentage and composition of pathogens in sputum samples at AEs and stable-visits. Percentage of pathogens in sputum samples at AEs and stable visits. Bacterial and viral composition in sputum samples at AEs and stable visits. AE: acute exacerbation of bronchiectasis. Other bacteria consisted of Proteus mirabilis (n=4), Acinetobacter baumannii (n=2), Moraxella catarrhalis (n=2), Pseudomonas ozanae (n=1), Staphylococcus aureus (n=1), Haemophilus haemolyticus (n=1), Haemophilus parahaemolyticus (n=1), Streptococcus pneumoniae (n=1), Shewanella algae (n=1), Actinomyces ureae (n=1), Pasteurella multocida (n=1), Enterobacter aerogen (n=1) and Serratia marcescens (n=1). There were more patients isolated with two bacteria when clinically stable. Hence, the overall percentage of patients isolated with pathogenic bacteria appeared higher when clinically stable compared with AE onset.
The proportion of patients tested positive to virus increased from 11.4% at stable-visits to 29.0% at AEs (P=.003). Prevalent viruses included coronavirus (3.4%), herpes simplex virus (2.4%) and influenza A (2.0%) at stable-visits, and influenza B (7.7%), coronavirus (7.7%) and rhinovirus (6.4%) at AEs. The viral spectrum alone did not differ between stable-visits and AEs (P=.396). Dual viral species were detected during 4 (5.3%) AE episodes (Table E2).
Of the 49 patients, 17 (34.7%) provided ≥2 AE sputum samples, for which no identical virus was detected whereas an identical (colonized) bacteria was isolated in 8 patients.
Isolation of New Bacteria and Viral Isolation Occurred More Frequently During AEsAmong 375 sputum samples, isolation of bacteria alone did not correlate with AEs (P>.05, Fig. 3). Nonetheless, isolation of new bacteria occurred more frequently during AEs than stable-visits (OR=2.52, 95%CI: 1.35–4.71), in which culture switching from negative to positive accounted for 66.7% (12/18) of episodes [from culture negative to Haemophilus influenzae (38.9%) and Moraxella catarrhalis (11.1%)], whereas bacterial class-switch accounted for 33.3% (6/18) of episodes [from Pseudomonas aeruginosa to Haemophilus influenzae (16.7%) and other bacteria (11.1%); Pseudomonas aeruginosa was not isolated at most AEs].

Association between the detection of different pathogens and the risks of AEs. Notes: OR= Odds Ratio, PA= Pseudomonas aeruginosa, HI= Haemophilus influenzae; AEs: acute exacerbations of bronchiectasis. Any bacteria denotes bacterial culture positive for any bacteria; Isolation of new bacteria denotes sputum culture switching from negative to positive, or sputum culture positive switching from one pathogenic bacterium to other pathogenic bacterium.
Viral isolations occurred more frequently during AEs than stable-visits (OR=3.28, 95%CI: 1.76–6.12). The odds was highest for rhinovirus (OR=8.14, 95%CI: 1.90–34.81), followed by influenza A/B (OR=4.81, 95%CI: 1.64–14.13). However, isolation of coronavirus did not correlate with AEs (OR=2.80, 95%CI: 0.96–8.21). Moreover, bacterial plus viral isolations occurred more frequently during AEs than stable-visits (OR=2.24, 95%CI: 1.11–4.55).
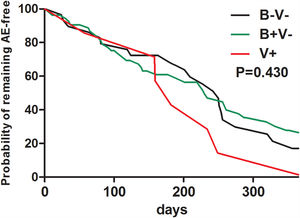
At baseline, pathogen (including Haemophilus influenzae) isolation status failed to predict future risks of AEs during follow-up (Table E3). Neither bacterial nor viral isolations alone at baseline predicted a shorter time to the next AEs during follow-up (Fig. E1).
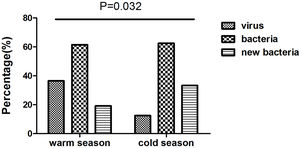
We collected 52 and 24 samples from warmer (May-October) and colder seasons (November-April), between which the detection rate of viruses differed significantly (36.5% vs. 12.5%, P=.032). However, we noted no significant difference in the rate of bacterial isolation (61.5% vs. 62.5%, P=.936), nor did the rate of isolating new bacteria (19.2% vs. 33.3%, P=.179) (Fig. E2).
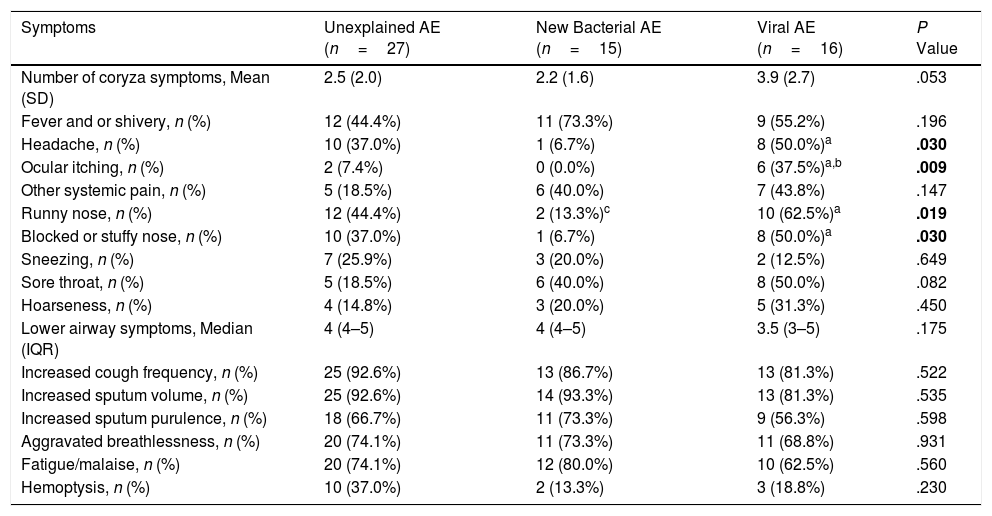
Clinical Characteristics Differentiating AEs With Different PathogensNext, we stratified patients at AEs as: (1) New bacterial AE (50.0%): isolation of new bacteria; (2) Viral AE (21.1%): detection of any virus; (3) Unexplained AE (26.3%): AE without isolation of new bacteria or detection of viruses. Two AEs were not analyzed because of simultaneous detection of virus and new bacteria. Demographic and clinical characteristics did not differ among these subgroups (Table E4).
Symptom questionnaires were obtained from 58 (78.4%) AEs. Viral AEs tended to yield more coryza symptoms than unexplained AEs and new bacterial AEs (P=.053, Table 2). Neither the number nor the VAS of lower airway symptoms differed among the three groups during stable-visits (Fig. 4A). However, increased sputum purulence (mean difference: 2–4 for VAS) and breathlessness (mean difference: 1.6 for VAS) deteriorated most notably during new bacterial AE (Fig. 4B and C).
Symptoms of AEs With Different Pathogen Detection.
| Symptoms | Unexplained AE (n=27) | New Bacterial AE (n=15) | Viral AE (n=16) | P Value |
|---|---|---|---|---|
| Number of coryza symptoms, Mean (SD) | 2.5 (2.0) | 2.2 (1.6) | 3.9 (2.7) | .053 |
| Fever and or shivery, n (%) | 12 (44.4%) | 11 (73.3%) | 9 (55.2%) | .196 |
| Headache, n (%) | 10 (37.0%) | 1 (6.7%) | 8 (50.0%)a | .030 |
| Ocular itching, n (%) | 2 (7.4%) | 0 (0.0%) | 6 (37.5%)a,b | .009 |
| Other systemic pain, n (%) | 5 (18.5%) | 6 (40.0%) | 7 (43.8%) | .147 |
| Runny nose, n (%) | 12 (44.4%) | 2 (13.3%)c | 10 (62.5%)a | .019 |
| Blocked or stuffy nose, n (%) | 10 (37.0%) | 1 (6.7%) | 8 (50.0%)a | .030 |
| Sneezing, n (%) | 7 (25.9%) | 3 (20.0%) | 2 (12.5%) | .649 |
| Sore throat, n (%) | 5 (18.5%) | 6 (40.0%) | 8 (50.0%) | .082 |
| Hoarseness, n (%) | 4 (14.8%) | 3 (20.0%) | 5 (31.3%) | .450 |
| Lower airway symptoms, Median (IQR) | 4 (4–5) | 4 (4–5) | 3.5 (3–5) | .175 |
| Increased cough frequency, n (%) | 25 (92.6%) | 13 (86.7%) | 13 (81.3%) | .522 |
| Increased sputum volume, n (%) | 25 (92.6%) | 14 (93.3%) | 13 (81.3%) | .535 |
| Increased sputum purulence, n (%) | 18 (66.7%) | 11 (73.3%) | 9 (56.3%) | .598 |
| Aggravated breathlessness, n (%) | 20 (74.1%) | 11 (73.3%) | 11 (68.8%) | .931 |
| Fatigue/malaise, n (%) | 20 (74.1%) | 12 (80.0%) | 10 (62.5%) | .560 |
| Hemoptysis, n (%) | 10 (37.0%) | 2 (13.3%) | 3 (18.8%) | .230 |
Notes: AE: acute exacerbations of bronchiectasis; New bacterial AE: AE with isolation of new bacteria, including situations of sputum culture switching from negative to positive, or sputum culture positive switching from one pathogenic bacterium to another pathogenic bacterium; Viral AE: AE with virus detection positive; Unexplained AE: AE without new occurrence of bacteria or virus detected.
Data are presented as mean (SD) or median (IQR) or n (%).
 The VAS during stable visits. (B) The VAS during AEs. (C) The difference in VAS between AEs and stable visits. Notes: AE: acute exacerbation of bronchiectasis; VAS: visual analog scale.")
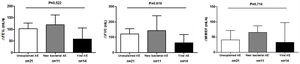
Spirometry was assessed in 46 (62.2%) AEs. Lung function decline did not differ among viral, new bacterial and unexplained AEs (Figure E3). Sputum cytokines and total leukocyte count were detected in 53 (71.6%) and 39 (51.3%) AEs, respectively. Median interleukin-1β levels increased significantly in new bacterial AEs than in unexplained AEs (P=.006) and viral AEs (P=.005), as did tumor necrosis factor-α levels except for the comparison with viral AEs (P=.138). New bacterial AEs trended toward higher blood neutrophil counts, while viral AEs yielded higher monocyte counts (Fig. 5).
 The level of sputum cytokines during AEs. (B) White blood cell count during AEs. (C) The level of C-reactive protein during AEs. (D) The difference in inflammatory cell count between AEs and stable visits. Notes: AE: acute exacerbation of bronchiectasis.")
The airway and systemic inflammations in different groups. (A) The level of sputum cytokines during AEs. (B) White blood cell count during AEs. (C) The level of C-reactive protein during AEs. (D) The difference in inflammatory cell count between AEs and stable visits. Notes: AE: acute exacerbation of bronchiectasis.
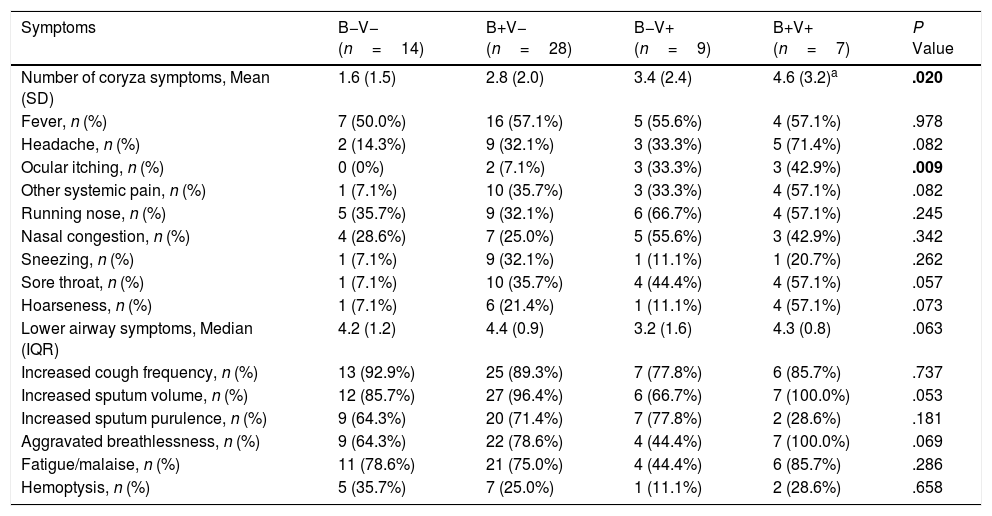
To further investigate the characteristics of bacterial plus viral isolations, AEs were divided into: no bacteria/viruses detected (B−V−, n=18); Bacteria detected alone (B+V−, n=36); Viruses detected alone (B−V+, n=11); both bacteria and viruses detected (B+V+, n=11).
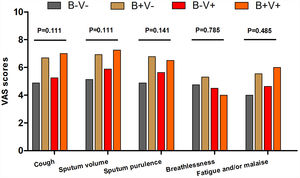
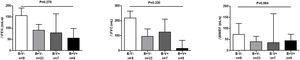
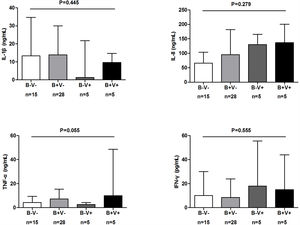
There were more coryza symptoms in B+V+ group than in B−V− group (median: 4.6 vs. 1.6, P=.019). Ocular itching appeared more frequent in B+V+ group (42.9%) than in B−V− (0%) and B+V− group (7.1%, Table 3). The VAS for cough, sputum and sputum purulence tended to be higher in B+V+ and B+V− groups (Ptrend<0.05, Fig. E4). The greatest lung function decline (Ptrend=0.043 for forced vital capacity) was noted in B−V− group (Fig. E5). However, there was no notable among-group difference in sputum inflammatory biomarker levels (all P>.05) (Fig. E6).
Symptoms of AEs With Bacterial and or Viral Infection.
| Symptoms | B−V− (n=14) | B+V− (n=28) | B−V+ (n=9) | B+V+ (n=7) | P Value |
|---|---|---|---|---|---|
| Number of coryza symptoms, Mean (SD) | 1.6 (1.5) | 2.8 (2.0) | 3.4 (2.4) | 4.6 (3.2)a | .020 |
| Fever, n (%) | 7 (50.0%) | 16 (57.1%) | 5 (55.6%) | 4 (57.1%) | .978 |
| Headache, n (%) | 2 (14.3%) | 9 (32.1%) | 3 (33.3%) | 5 (71.4%) | .082 |
| Ocular itching, n (%) | 0 (0%) | 2 (7.1%) | 3 (33.3%) | 3 (42.9%) | .009 |
| Other systemic pain, n (%) | 1 (7.1%) | 10 (35.7%) | 3 (33.3%) | 4 (57.1%) | .082 |
| Running nose, n (%) | 5 (35.7%) | 9 (32.1%) | 6 (66.7%) | 4 (57.1%) | .245 |
| Nasal congestion, n (%) | 4 (28.6%) | 7 (25.0%) | 5 (55.6%) | 3 (42.9%) | .342 |
| Sneezing, n (%) | 1 (7.1%) | 9 (32.1%) | 1 (11.1%) | 1 (20.7%) | .262 |
| Sore throat, n (%) | 1 (7.1%) | 10 (35.7%) | 4 (44.4%) | 4 (57.1%) | .057 |
| Hoarseness, n (%) | 1 (7.1%) | 6 (21.4%) | 1 (11.1%) | 4 (57.1%) | .073 |
| Lower airway symptoms, Median (IQR) | 4.2 (1.2) | 4.4 (0.9) | 3.2 (1.6) | 4.3 (0.8) | .063 |
| Increased cough frequency, n (%) | 13 (92.9%) | 25 (89.3%) | 7 (77.8%) | 6 (85.7%) | .737 |
| Increased sputum volume, n (%) | 12 (85.7%) | 27 (96.4%) | 6 (66.7%) | 7 (100.0%) | .053 |
| Increased sputum purulence, n (%) | 9 (64.3%) | 20 (71.4%) | 7 (77.8%) | 2 (28.6%) | .181 |
| Aggravated breathlessness, n (%) | 9 (64.3%) | 22 (78.6%) | 4 (44.4%) | 7 (100.0%) | .069 |
| Fatigue/malaise, n (%) | 11 (78.6%) | 21 (75.0%) | 4 (44.4%) | 6 (85.7%) | .286 |
| Hemoptysis, n (%) | 5 (35.7%) | 7 (25.0%) | 1 (11.1%) | 2 (28.6%) | .658 |
Notes: AE: acute exacerbations of bronchiectasis; B−V−: no bacteria and viruses detected; B+V−: any pathogenic bacteria detected but no viruses detected; B−V+: viruses detected but no pathogenic bacteria detected; B+V+: both bacteria and viruses detected.
Data are presented as mean (SD) or median (IQR) or n (%).
Kruskal–Wallis comparison with Bonferroni test was applied.
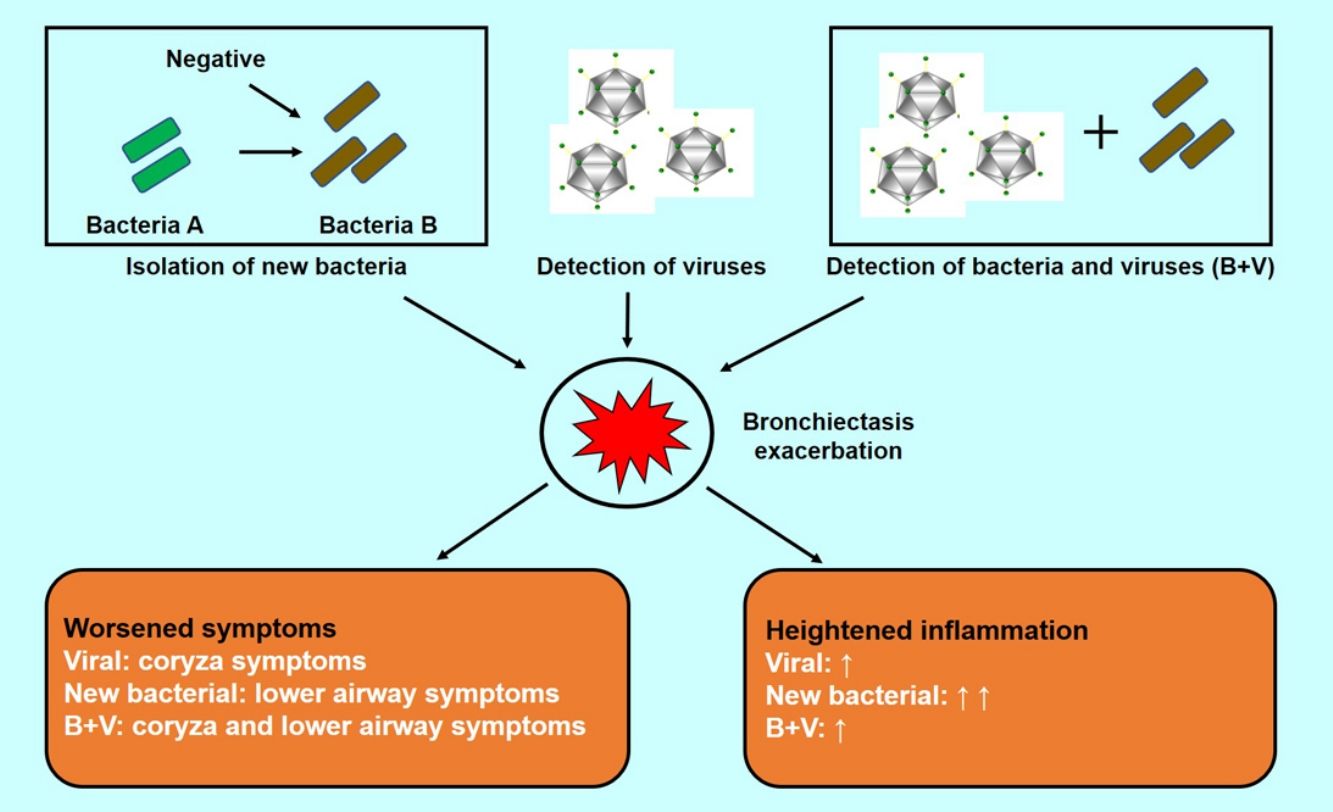
This is the first study that evaluates bacterial plus viral infections in adults with bronchiectasis. Isolation of new pathogenic bacteria and viral isolations were associated with AEs. Pathogen isolations when clinically stable did not predict future risks of AE. Bacterial plus viral isolations occurred more frequently during AE. Coryza symptoms were more frequent in viral AEs. Bacterial plus viral isolations did not correlate with greater respiratory symptom burden, airway inflammation or lung function impairment compared with bacterial or viral isolations alone.
Next-generation sequencing has been applied in bronchiectasis.13,25,26 Here, we applied routine culture for detection of bacteria and PCR assay for detecting virus because these methods are simple, accurate and reliable, and has been widely used in clinical practice. Furthermore, the bacteria detected with culture indicate the viability and/or virulence. Hence, these routine techniques could be applied as the point-of-care tests in real-world practice.
Consistent with previous findings in COPD exacerbation,27,28 isolation of new bacterial strain (class-switch) was associated with AEs (accounting for 20% of AEs), which warranted antibiotics treatment. However, the total bacterial load and microbiota taxa, analyzed by 16s rDNA sequencing, changed unremarkably before and after antibiotic treatment for AEs.13 Intriguingly, isolation of new bacterial strain (Haemophilus influenzae, Moraxella catarrhalis, or Streptococcus pneumoniae) was associated with increased risks of COPD exacerbations.28-30 Our study showed that isolation of new bacteria (mainly Haemophilus influenzae) was associated with AEs in bronchiectasis, implicating that Pseudomonas aeruginosa was not the culprit of AEs and that antibiotic therapy targeting at the emerging bacterial species would be warranted. Hence, rapid microbiological assessments are important to clinical practice because they may help avoid over-treatment or under-treatment.
Viral isolations occurred more frequently in AEs. The viral detection rate was lower (30%) than previously reported (∼48%).11,12 The sources of samples (sputum vs. nasopharyngeal aspirates vs. sputum plus nasopharyngeal swab) and the characteristics of bronchiectasis patients might have contributed to the differences. The most prevalent viruses were influenza A/B, coronavirus and rhinovirus in our population, congruent with the findings from COPD patients in Hong Kong.31 Influenza A/B and rhinovirus, but not coronavirus, played crucial roles in AEs. However, the mechanisms underlying these observations are unclear and warrant further investigations. Overall, our findings mirrored those reported in adults and children.11,12 Compared with the study by Mitchell et al.,32 the difference in viral spectrum could have resulted from the differences in: (1) detection methods and assay kits; (2) the positive threshold of CT values; (3) the geographic regions.
We have confirmed that bacterial plus viral isolations occurred more frequently during AEs than stable-visits. Interestingly, bacterial plus viral isolations were not associated with greater lung function impairment or airway inflammation than bacterial or viral isolations alone during AEs. By contrast, bacterial plus viral isolations yielded greater lung function impairment and heightened inflammatory responses during COPD exacerbations.17,18 This might be because bacterial plus viral isolations frequently comprised Pseudomonas aeruginosa and viral isolations in bronchiectasis as opposed to Haemophilusinfluenzae and viral isolations in COPD. Indeed, viral isolation may induce secondary bacterial isolation and further aggravated inflammation.33,34 However, the load of Pseudomonas aeruginosa did not increase significantly regardless of viral isolation status or disease status (exacerbation vs. steady-state) in cystic fibrosis.35,36 Moreover, respiratory syncytial virus isolation reportedly enhanced Pseudomonas aeruginosa biofilm growth, rendering Pseudomonas aeruginosa infection more sustainable.37 Collectively, Pseudomonas aeruginosa isolation was unlikely the trigger of AEs despite co-existing viral isolations in bronchiectasis.
This is the first study which analyzed the association between symptoms and AEs in bronchiectasis because this would help clinicians more rapidly identify the possible culprits. Coryza symptoms were indicators of viral isolations. Fever was ubiquitous in different types of AEs, hence viral AEs cannot be judged based on fever alone. AE associated with new occurrence of bacteria yielded more severe lower airway symptoms and heightened airway inflammatory responses, therefore clinicians should be vigilant for the identification and management with antibiotics if appropriate.
Some limitations should be considered. We did not recruit ‘dry’ bronchiectasis patients who still might have AEs attributable to pathogen infections. Our sample size was insufficient to power subgroup analyses. Some blood tests, spirometry were not available because some patients declined due to repeated assessments and poor overall well-being during AEs. We’ve only captured half AE episodes although the clinical characteristics of these patients did not differ from those whose AEs were not captured. Furthermore, we did not measure bacterial loads which reportedly changed insignificantly during AEs.11 The AEs were managed at out-patient clinics, hence our findings might not be extrapolated to severe AEs needing hospitalization. Some viruses detected during AEs might not be pathogenic; however, the GEE model did reveal the association between pathogen isolation and AEs. Finally, findings of the symptoms associated with viral or bacterial isolations were not specific to bronchiectasis. However, our study would still be informative because our findings help clinicians to infer from possible culprit pathogens before further assays became available.
In summary, building on our previous publication,11 the current study has further provided important clinical insights. Isolation of new bacteria, viral isolations, and bacterial plus viral isolations are associated with AEs in bronchiectasis. Further study determining the causes of unexplained AEs are needed.
FundingThis work was supported by National Natural Science Foundation No. 81870003, Pearl River S&T Nova Program of Guangzhou No. 201710010097 and Guangdong Province Universities and Colleges Pearl River Scholar Funded Scheme 2017 (to Prof. Guan), The Impact and Mechanisms of Physical, Chemical and Biological Interventions on the Development and Outcome of Acute Lung Injury No. 81490534, National Key Technology R&D Program No. 2018YFC1311902, Guangdong Science and Technology Foundation No. 2019B030316028 (to Prof. Zhong).
AuthorshipC. L. C., W. J. G. and N. S. Z. participated in study design; C. L. C. performed laboratory experiments and data analysis; C. L. C., H. M. L., J. J. Y., Y. H., W. J. G., X. R. H., R. C. C. and N. S. Z. recruited patients; C. L. C., H. M. L., J. J. Y., and Y. H. performed follow-up; C. L. C., W. J. G., D. R. C. and M. A. M. drafted the manuscript; W. J. G., N. S. Z., D. R. C. and M. A. M. were responsible for study conception and provided critical review of the manuscript. C. L. C., H. M. L., J. J. Y., Y. H., W. J. G., X. R. H., R. C. C., D. R. C., M. A. M. and N. S. Z. approved the final draft for publication. W. J. G. and N. S. Z. were the guarantors of the study.
We thank Dan-Hong Su (Department of microbiology, The First Affiliated Hospital of Guangzhou Medical University), for her assistance in sputum bacterial culture, Wen-Kuan Liu, Shi-Guan Wu and Shu-Yan Qiu (Department of virology, State Key Laboratory of Respiratory Diseases, Guangzhou Medical University) for their assistance in viral detection.