


Few studies have analyzed the prevalence and accessibility of home mechanical ventilation (HMV). The aim of this study was to characterize the prevalence of HMV and variability in prescriptions from administrative data.
MethodsPrescribing rates of HMV in the 37 healthcare sectors of the Catalan Health Service were compared from billing data from 2008 to 2011. Crude accumulated activity rates (per 100000 population) were calculated using systematic component of variation (SCV) and empirical Bayes (EB) methods. Standardized activity ratios (SAR) were described using a map of healthcare sectors.
ResultsA crude rate of 23 HMV prescriptions per 100000 population was observed. Rates increase with age and have increased by 39%. Statistics measuring variation not due to chance show a high variation in women (SCV=0.20 and EB=0.30) and in men (SCV=0.21 and EB=0.40), and were constant over time. In a multilevel Poisson model, hospitals with a respiratory medicine unit were associated with a greater number of cases (beta=0.68, P<.0001).
ConclusionsHigh variability in prescribing HMV can be explained, in part, by the attitude of professionals toward treatment and accessibility to specialist centers with a respiratory medicine unit. Analysis of administrative data and variability mapping help identify unexplained variations and, in the absence of systematic records, are a feasible way of tracking treatment.
Hay pocos estudios que hayan analizado la prevalencia y la accesibilidad a la ventilación mecánica a domicilio (VMD). El objetivo del presente estudio es describir la prevalencia de la VMD y estudiar la variabilidad a partir de datos administrativos.
MétodosSe compararon las tasas de VMD en las 37 áreas de salud a partir de los datos de facturación del Servicio Catalán de la Salud, durante el período 2008–2011. Se calcularon las tasas brutas de actividad acumulada (por 100.000 habitantes) utilizando el componente sistemático de variación (CSV) y empírico Bayes (EB). Las razones de actividad estandarizada (REA) se describieron mediante un mapa de sectores de salud.
ResultadosLa tasa bruta VMD fue de 23 usuarios/100.000 habitantes. Las tasas aumentan con la edad y han crecido un 39%. Los estadísticos que miden la variación no debida al azar muestran una variación elevada en mujeres (CSV=0,20 y EB=0,30) y en hombres (CSV=0,21 y EB=0,40), y constante a lo largo del tiempo. En un modelo de Poisson multinivel la existencia de un hospital con servicio de neumología se asoció con un mayor número de casos (beta=0,68; p<0,0001).
ConclusionesLa variabilidad elevada de la VMD puede explicarse, en parte, por la actitud de los profesionales hacia el tratamiento y la accesibilidad a centros que disponen de especialista de neumología. El análisis de los datos administrativos y la confección de mapas de variabilidad permiten identificar variaciones no explicadas y, en ausencia de registros sistemáticos, es una manera factible de realizar el seguimiento de un tratamiento.
Home mechanical ventilation (HMV) was introduced due to the need to treat survivors of the poliomyelitis epidemic who only required long-term ventilatory support after discharge from hospital.1 Until the 1980s, few mechanical ventilation systems were available for these patients,2 and most were ventilated via tracheotomy, with survival rates of over 20 years.3 Studies describing the successful delivery of ventilation via the nasal passage4,5 led to significant changes in HMV.
References to HMV in our setting go back to the mid-1980s,6,7 although isolated cases of patients ventilated at home for years using an “iron lung” have been reported. Home non-invasive ventilation (NIV) was developed simultaneously in Hospital Universitari de Bellvitge8 and Hospital San Pedro de Alcántara9 (Spain) at the end of the 1980s. Since then, the number of centers and patients using HMV has steadily increased, most notably after the introduction of (bi-level) pressure-cycled ventilators.10
Despite this growing interest, few studies have analyzed the prevalence of HMV. As well as being indicated in patients with neuromuscular and/or restrictive diseases (in whom ventilatory pump failure is a common occurrence), the practice of extending the indication for long-term NIV to include patients with chronic obstructive pulmonary disease (COPD) and obesity hypoventilation syndrome (OHS) is steadily gaining ground. There is, however, no evidence to support the validity of this criterion.11
Variability in clinical practice has been widely recognized and analyzed for more than 30 years.12 Decision-making is a complex issue, and clinical practice is established taking into account not only scientific evidence, but also local circumstances, professional skills and above all, patient values.13 The magnitude of variability must be studied in order to introduce specific actions for improvement, and to guarantee equal access to effective treatment. A systematic study of variability requires accurate registers to be maintained over time in order to observe trends. However, these are costly and require systematic updates if they are to remain useful. Another option is to use the information available in the national health system.
The aim of this study was to analyze the prevalence of HMV and make a preliminary study of its variability, taking into account both population figures and the information available in the Health Services.
MethodologyVariations in clinical practice are analyzed by comparing rates of hospitalization, intervention or care activity carried out in the healthcare sectors included in a particular geographical area. This study compared the HMV prescription rates in the different healthcare sectors of Catalonia (Spain). Patients were identified using the Catalan Health Service (CatSalut) billing database, selecting cases in which HMV was invoiced to CatSalut between 2008 and 2011 (inclusive). Cases were assigned to each geographical area according to each patient's healthcare area of residence. The denominators were calculated using population data from the CatSalut central registry of insured persons (CRI).
The analysis included all 37 healthcare sectors where health promotion, disease prevention, public health and social-healthcare activities are provided and coordinated at the primary care and specialist level. Assigning cases to each geographical area is a key element in analyzing variations in clinical practice. Each patient's healthcare sector of residence was determined on the basis of billing data.
The description of the results is based on variation rates and statistics calculated using the direct standardization method, while those based on expected values were obtained by indirect standardization. Crude cumulative activity rates (per 100000 inhabitants) for the study period were first calculated with respect to the population of each healthcare sector; these are described in terms of percentiles and a dot plot in which each sector is represented by a point. Following this, the usual variability statistics used in the analysis of small areas were calculated: the variance ratio (VR) for sectors in the 5th (P5) and 95th percentile (P95) (ratio between activity in the P95 and P5 sectors, VR5–95); the systematic component of variation (SCV), which uses the inter-sectorial variation (which is expected to be systematic), the intra-area variation (expected to be random), and the empirical Bayes (EB) method. Standardized activity ratios (SAR) were then constructed, and described using a map of healthcare sectors. The SAR was obtained to compare the real activity billed for the residents in an area (observed activity) with the activity they would have had (expected activity) if the use made by each of their 5-year age and sex groups had been equal to that of the reference standard: the whole population of Catalonia included in the integrated public health system of Catalonia (SISCAT). Finally, sectors were grouped in clusters, corresponding to the sectors allocated to the various service distribution companies. After totaling the number of cases by sex and 5-year age group, a multilevel Poisson model was constructed where the grouped patients were the analysis unit, the sectors the second level, and the clusters the third level. Using this model, we were able to study the possible effect on each sector of service distribution companies and the presence of a hospital with a Respiratory Medicine department. Data analysis and processing were performed using STATA, version 11.2 and R, version 3.00.0.
ResultsA total of 240760 patients who received some type of home respiratory therapy funded by the public system were identified between 2008 and 2011. Of these, 75.8% used continuous positive airway pressure (CPAP) equipment, 17.3% various forms of oxygen supply, 4.2% nebulized therapy, 2.5% HMV and 0.2% miscellaneous treatments.
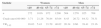
During the period studied, 6867 patients received HMV, giving a crude rate of 23 users per 100000 population between 2008 and 2011. Table 1 shows the number of men and women with HMV by age group, reference population, and crude rates. Between 2008 and 2011, there was an average of 1 patient on HMV per 4352 women and per 4361 men. By age groups, the crude rates increased with age to 1 user per 1194 women and 1297 men in the patient group aged over 74 years. The rates of HMV increased by 39% over the study period (Fig. 1). Table 1 also shows the distribution of the standardized HMV rates by health sector. In the over-40 years group, the HMV rate in the 95th percentile was 5 times higher than the rate in the 5th percentile in women, and 14 times higher in men. By age groups, this inter-sectorial variation increased by between 6 and 40 times in both sexes.
Patients with Home Mechanical Ventilation, Crude Rates per 100000 Population and Directly Standardized Statistics (2008–2011). SISCAT.
| Statistic | Women | Men | ||||||
|---|---|---|---|---|---|---|---|---|
| <40 | 40–64 | 65–74 | >74 | <40 | 40–64 | 65–74 | >74 | |
| n | 272 | 1016 | 972 | 1200 | 504 | 1270 | 925 | 708 |
| Crude rate×100000 | 3.71 | 21.26 | 76.84 | 85.04 | 6.43 | 26.72 | 84.32 | 78.31 |
| VR5–95 | 16.63 | 5.43 | 21.59 | 40.02 | 20.34 | 9.66 | 39.41 | 23.16 |
VR5–95: ratio between the 95th and the 5th percentile of the standardized rate.
Crude rate×100000: crude cumulative incidence between 2008 and 2011.

Fig. 2 shows the age-standardized HMV rates within each age group, for each of the sectors, and according to age group. They are shown on logarithmic scale and centered at zero to facilitate interpretation and comparison. The elongated representation of the rates for the sectors around 0 shows a pattern of high variation. Fig. 3 shows the standardized HMV rates on a map. The darker the color of the sector, the higher the standardized HMV rate.
.")
.")
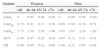
Table 2 shows the distribution of the standardized HMV rate ratios and indirectly standardized rates by age groups and sex. In sectors with a standardized ratio in the 95th percentile, a 76% higher standardized HMV rate can be observed in men with respect to the standardized rate of the sectors as a whole; in women it is 51% higher. Meanwhile, both the systematic coefficient of variation (SCV) and the empirical Bayes (EB) methods, which measure variation not due to chance, show high variation in women (SCV=0.20 and EB=0.30) and men (SCV=0.21 and EB=0.40) for HMV. The trend in statistics measuring variations not due to chance shows a consistently high year-on-year variation, taking values of between EB=0.25 and EB=0.39 in the same period.
Standardized Home Mechanical Ventilation Rate Ratios and Indirectly Standardized Rates (2008–2011). SISCAT.
| Statistic | Women | Men | ||||||
|---|---|---|---|---|---|---|---|---|
| <40 | 40–64 | 65–74 | >74 | <40 | 40–64 | 65–74 | >74 | |
| SAR5 | 0 | 0.00 | 0.00 | 0.00 | 0 | 0.00 | 0.00 | 0.00 |
| SAR50 | 0.72 | 0.91 | 0.71 | 0.59 | 0.69 | 0.99 | 0.70 | 0.51 |
| SAR95 | 3.15 | 1.50 | 2.05 | 1.86 | 3.07 | 1.67 | 2.43 | 1.89 |
| SCV | 0.44 | 0.07 | 0.28 | 0.29 | 0.65 | 0.12 | 0.47 | 0.41 |
| EB | 0.49 | 0.09 | 0.42 | 0.90 | 0.40 | 0.22 | 0.92 | 0.88 |
EB: empirical Bayes; SARx: value in the x percentile of the standardized rate ratio; SCV: systematic component of variation.
Fig. 4 shows a funnel chart where each point represents a sector; the blue line at 1 represents the average rate of all the sectors; and the dotted blue lines on either side of 1 represent the 99.9% confidence interval of this average. The orange dots are sectors with no statistically significant differences with respect to the average of all sectors, the green dots are sectors with lower standardized rates with respect to the average, and the red dots are those with higher standardized rates with respect to the average. Some sectors can be observed above and below the area defined by the confidence interval, corresponding to overuse or underuse of HMV with respect to the average of all the sectors, respectively.
.")
The high variation identified between sectors could be explained by different factors related with supply and demand for the service. In a multilevel Poisson model, both sectors (variance sectors 0.38) and clusters (variance clusters 0.15) explained some of the variability. These data suggest that, disregarding the effect of sex and age, intra-sectorial and intra-cluster variability was less than inter-sectorial and inter-cluster variability, respectively. Moreover, in this same model, the presence of a hospital with a Respiratory Medicine department was associated with a higher number of cases (beta=0.68; P<.0001).
DiscussionThe aim of this study was to analyze variability in the prescription of HMV based on administrative data available in public service financial records. Variability in clinical practice, in terms of both diagnosis and treatment, occurs in all care settings. Newhouse and Garber14 drew attention to the variability in post-hospital discharge healthcare services (long-term care hospitals, skilled nursing facilities or home health services). Studies showing variability in the prescription of HMV in Europe have been published for over 20 years.15 The Eurovent Survey found that HMV variability occurred both in the number of prescriptions and the profile of patients for whom this treatment was prescribed, neither of which was related with the characteristics of the healthcare system or the economic situation in each country.16 The national Swedish HMV register also highlighted variability in prescription within the country itself, despite a similar level of healthcare coverage.17
The number and profile of patients could be related to the number of prescribing centers and their characteristics (presence of a respiratory medicine specialist). Although HMV is not technically complex, decision-making and resolving complications require the types of skills that justify concentrating prescription in only a few centers. In Denmark, there are only 2 centers that prescribe HMV; in this country prevalence is low, and the therapy is usually indicated in younger patients with neuromuscular diseases.18
Another factor that may explain the variability is the absence of objective evidence-based criteria for starting HMV, especially in obese or COPD patients. The findings of a recent study on the variability of HMV in Australia and New Zealand suggest that, in addition to variability in prevalence, HMV is more likely to be started in obese patients in New Zealand than in Australia.19 On the other hand, the wide variety of diagnoses or patients potentially in need of HMV could also explain the variations observed. In the final analysis, therefore, the attitude of physicians to ventilation might well be one of the most important factors behind variability, although this is hard to demonstrate.20
In England,21 evidence of variability and difficulty of access to treatment led to calls for the creation of a register, and for indications to be standardized by means of, for example, clinical practice guidelines. However, although registers can be very useful for analyzing long-term trends, they are often of little use in promptly identifying specific problems if they are not regularly updated and the patient's overall stability is not accurately reported. In addition, in some neuromuscular diseases such as amyotrophic lateral sclerosis, lung function data have prognostic value but very little predictive value.
The greatest limitation of this study is the lack of access to diagnoses. The use of administrative data, for reasons of data confidentiality, only allows access to the type of treatment subsidized by the public health system, the patient's age and town of residence. Register-based analysis would improve data mining, but a register is not easy to construct, and is expensive and difficult to maintain. Moreover, obtaining information from the prescribing center (which would give more detailed information on diagnosis and the technical characteristics of the treatment) might not necessarily give an idea of the population impact (a center may prescribe ventilation to patients from various geographical sectors). In Catalonia, the population insured by CatSalut (with different levels of coverage) represents practically the entire population. Patients with double medical coverage (public and private) seen in private centers are currently not included in public information systems. Therefore, in terms of rates, the numerator (number of cases) may be higher, but the denominator (population at risk) would remain the same, which could suggest a slight underestimation.
Nevertheless, simple but easily accessible information, such as that discussed here, allows treatment to be followed-up practically online, without the need for a specific register.
Thus, despite the aforementioned limitations, the data analyzed reveal some key points. First, there is large variability in the prescription of HMV that cannot be explained by administrative or economic difficulties in accessing services. Despite the existence of few prescribing centers, and the fact that these are in contact with each other and often exchange experiences, large variability persists. There are no data to suggest that this variability is due to recent changes in criteria for prescribing ventilation, such as indication in COPD or OHS patients. In the study by Farré et al.,22 which reported findings from the 4 hospitals that attended most patients with HMV in the Barcelona metropolitan area, large variations between prescribing centers had already been observed almost 10 years ago.
The number of specialists available in a particular area could cause variability in prescription, and this has been observed in other respiratory therapies, such as home oxygen therapy.23 However, this phenomenon does not explain the variations within the Barcelona metropolitan area, where access is easy and a large number of specialists available. Besides, context should always be taken into account when performing data analysis. Hospitals did not begin to prescribe HMV simultaneously. Prior to 1990, only 1 center in Catalonia systematically prescribed HMV,24 and until 1995, it was prescribed routinely in only 5–6 hospitals.
The large variability in criteria for prescribing HMV in older patients is notable. This contrasts with studies that show the benefits of HMV in patients aged over 75 years. Farrero et al.25 showed that ventilation in patients aged over 75 years improved gas exchange and that, after the initial adaptation phase, median survival was 6 years.
Finally, supply companies can influence the variability of HMV prescription. Given the characteristics of the funding system, with very stringent limits on increases in prescriptions, it is unlikely that these companies have a direct effect on such prescriptions. However, the range of services or type of apparatus offered could have a bearing on prescription numbers. Either way, technical service should always be included as a variable in the analysis of variability in HMV prescription.
Sunwoo et al.26 highlighted the complexity of evaluating HMV-related technology, both due to the increase in the number of users and the difficulties involved in standardizing the services they receive. The type of analysis proposed, based on available data (essentially billing-related) may be a good complement to clinical experience and cross-sectional studies that give an overall view of the problem, and reveal variations in a relatively simple, inexpensive way.
Conflict of InterestsThe authors declare that they have no conflict of interests.
- -
Escarrabill J. Hospital Clínic. Barcelona.
- -
Hernández C. Unidad de Atención Integrada. División Médica y de Enfermería. Hospital Clínic. Barcelona
- -
Llauger M.A. EAP Encants. Institut Català de la Salut. Barcelona.
- -
Roger N. Consorci Hospitalari de Vic. Vic (Barcelona).
- -
Rosas A. Departamento de Salud (Generalitat de Catalunya).
- -
Saltó E. Agència de Salut Pública. Departamento de Salud (Generalitat de Catalunya).
- -
Jiménez J. Servei Català de la Salut (CatSalut).
- -
Torrente E. Agència de Qualitat i Avaluació Sanitàries de Catalunya (AQuAS).
- -
Tresserras R. Departamento de Salud (Generalitat de Catalunya).
- -
Escarrabill J. Hospital Clínic. Barcelona.
- -
Fusté J. Departamento de Salud (Generalitat de Catalunya).
- -
Garía-Altés A. Agència de Qualitat i Avaluació Sanitàries de Catalunya (AQuAS). Departamento de Salud (Generalitat de Catalunya).
- -
Jiménez J. Servei Català de la Salut (CatSalut).
- -
Roger N. Consorci Hospitalari de Vic. Vic (Barcelona).
- -
Sabater RT. Servei Català de la Salut (CatSalut).
- -
Sabaté M. Fundació d’Osona per a la Recerca i Educació Sanitària (FORES).
- -
Tresserras R. Departamento de Salud (Generalitat de Catalunya).
Team members are listed in Appendices A and B.
Please cite this article as: Escarrabill J, Tebé C, Espallargues M, Torrente E, Tresserras R, Argimón J, et al. Variabilidad en la prescripción de la ventilación mecánica a domicilio. Arch Bronconeumol. 2015;51:490–495.


www.publicationethics.org.


Archivos de Bronconeumología follows the Recommendations for the Conduct, Reporting, Editing and Publication of Scholarly Work in Medical Journals