
Obstructive sleep apnea syndrome (OSAS) may promote hyperglycemia and insulin resistance. Our aim is to investigate the effect of OSAS on the fasting plasma glucose, glycosylated hemoglobin (HbA1c), and C reactive protein (CRP) in nondiabetic patients.
Materials and methodsBlood parameters of consecutive 90 non diabetic patients whom polysomnografic evaluations were done in our sleep laboratory was evaluated. Among these 61 patients with normal fasting blood glucose were classified due to their apne-hipopnea index (AHI) as mild (n=16, 26.2%), moderate (n=18, 29.5%) and severe (n=27, 44.2%) OSAS. The fasting plasma glucose, HbA1c and CRP were measured.
ResultsMean age of the patients was 47.7±11.2 years, 72% male. HbA1c, fasting glucose levels show positive correlation with BMI (r=.503, P=.00; r=.258, P=.045). No relation of HbA1c to apnea index nor AHI was detected while positive correlation of fasting glucose and CRP was detected (r=.262, P=.042; r=.258, P=.045). HbA1c, fasting glucose and CRP levels show negative correlation with minimum SpO2 levels (by order of r=–.302, P=.018; r=–.368, P=.004; r=–.365, P=.004). HbA1c, fasting glucose levels and CRP levels show positive correlation with mean desaturation index (time duration in which SpO2<90% by pulse oxymeter) (r=.263, P=.041; r=.311, P=.015; r=.283, P=.027).
ConclusionsAlthough no relation in between increased HbA1c or glucose levels and severity of OSAS was detected in nondiabetic OSAS patients, the correlation with the night hypoxia was detected. This could also show the effect of night time hypoxia on glucose metabolism in OSAS patients.
El síndrome de apnea obstructiva del sueño (SAOS) puede fomentar la hiperglucemia y la resistencia a la insulina. Nuestro objetivo es investigar el efecto del SAOS sobre la glucosa plasmática en ayunas, la hemoglobina glucosilada (HbA1c) y la proteína C reactiva (PCR) en pacientes no diabéticos.
Material y métodosSe determinaron los parámetros de analítica hemática de 90 pacientes no diabéticos consecutivos en los que se realizaron evaluaciones polisomnográficas en nuestro laboratorio del sueño. Un total de 61 de estos pacientes con una glucemia en ayunas normal fueron clasificados según el índice de apnea-hipopnea (IAH) como casos leves (n=16, 26,2%), moderados (n=18, 29,5%) o graves (n=27, 44,2%) de SAOS. Se efectuaron determinaciones de la glucosa plasmática en ayunas, la HbA1c y la PCR.
ResultadosLa media de edad de los pacientes fue de 47,7±11,2 años, y el 72% eran varones. Los niveles de HbA1c y de glucosa en ayunas presentan una correlación positiva con el IMC (r=0,503, p=0,00; r=0,258, p=0,045). No se detectó relación alguna de la HbA1c con el índice de apnea ni con el IAH, mientras que sí se observó una correlación positiva de la glucosa en ayunas con la PCR (r=0,262, p=0,042; r=0,258, p=0,045). Los niveles de HbA1c, glucosa en ayunas y PCR muestran una correlación negativa con los valores de SpO2 mínima (con valores de r=–0,302, p=0,018; r=–0,368, p=0,004; r=–0,365, p=0,004, respectivamente). Los niveles de HbA1c, glucosa en ayunas y PCR muestran una correlación positiva con el índice de desaturación medio (tiempo durante el que la SpO2 es<90% según la pulsioximetría) (r=0,263, p=0,041; r=0,311, p=0,015; r=0,283, p=0,027).
ConclusionesAunque no se detectó relación alguna entre el aumento de los niveles de HbA1c o de glucosa y la gravedad del SAOS en los pacientes con SAOS no diabéticos, sí se detectó una correlación con la hipoxia nocturna. Esto podría poner de manifiesto el efecto de la hipoxia nocturna sobre el metabolismo de la glucosa en los pacientes con SAOS.
Obstructive sleep apnea syndrome (OSAS) and diabetes are common disorders worldwide. It is estimated that 8% of United States adults have diabetes, 90% of whom have type 2 diabetes mellitus (DM).1 For its part, sleep-disordered breathing is observed in 4% of women and 9% of men in the general population.2 Obesity is a major risk factor for developing type 2 DM, and also for developing OSAS.3 As a result of this common risk factor, both conditions often coexist. In recent studies, the prevalence of sleep-disordered breathing (apnea-hypopnea index (AHI)>20) was 36% in patients with DM, compared to 15% in normoglycemic individuals, while the prevalence of type 2 DM was approximately 30% in patients with OSAS.4,5
In the first of these studies, an association was observed between OSAS and insulin resistance, while in others there was no clear relationship between them.6–10 Potential mechanisms of the relationship between OSAS and insulin resistance were intermittent hypoxia, arousals from sleep with concomitant sympathetic activation and sleep fragmentation.11 In any case, in OSAS, it could not be determined whether the glucose intolerance was due to nocturnal oxygen desaturation or a sleep disorder or its duration.
Although the relationship between OSAS and diabetes mellitus has been investigated, the association between blood glucose control and the severity of OSAS in non-diabetic patients has not been as well evaluated.12 The aim of this study was to examine the association between glycosylated hemoglobin (HbA1c), fasting glucose, C-reactive protein (CRP) and sleep characteristics in non-diabetic patients with OSAS.
Materials and MethodsPatientsThe medical records of 90 consecutive non-diabetic patients who had been recently diagnosed with OSAS (AHI>5/h) by polysomnography (PSG) between July and October 2011 were examined. The medical examination was normal in all cases. Patients with known diabetes mellitus or high fasting blood glucose (fasting glucose ≥126mg/dl), patients with other chronic diseases (such as chronic renal, liver, cardiovascular or cerebrovascular diseases), those receiving systemic medication or who had a previous diagnosis/treatment for OSAS were excluded. After applying the above inclusion and exclusion criteria, 61 patients were included in the study. It was approved by the hospital ethics committee and informed consent was obtained from all patients.
ProcedureAll existing patient records were evaluated regarding their background, physical examination and detailed medical history. Daytime sleepiness was also evaluated using the Epworth Sleepiness Scale (ESS).13 A standard polysomnography was performed in all patients (overnight) using the Embla A-10 data acquisition and analysis system (Embla; Medcare Flaga; Reykjavik, Iceland) in a sleep laboratory, in baseline conditions. The following physiological recordings were monitored: EEG (C4-A1, C3-A2, O2-A1, O1-A2); submental EMG; ribcage and abdominal effort with respiratory inductive plethysmography (RIP) (XactTrace Medcare Flaga; Reykjavik, Iceland); body position measured with a calibrated sensor; nasal flow measured with a nasal pressure cannula (Medcare Flaga; Reykjavik, Iceland), SpO2 (8000J, Nonin Medical, Plymouth, MN, USA) with the mean time set at 3s; ECG (lead II) with sample recording at 512Hz. The sleep and waking stages were assessed in each individual by two experienced evaluators, using Somnologica Studio software (Medcare Flaga; Reykjavik, Iceland) and applying standard criteria (American Academy of Sleep Medicine (AASM) 2007 criteria). Respiratory events were assessed as follows: apnea was defined as cessation of airflow for a period of ≥10s, and was classified as obstructive when there was continuous movement in the RIP and as central in the absence of movement in the RIP. Hypopneas were defined as a ≥50% reduction in the amplitude of the oronasal flow ≥10s, accompanied by desaturation ≥3% and/or an awakening. The hypopneas were classified as obstructive of there was any evidence indicative of upper airway resistance, such as snoring, paradoxical motion of the respiratory bands and a restriction in the inspiratory flow in the nasal pressure recording.
Blood TestsFasting blood samples were obtained the day after the PSG, between 7 and 9 in the morning, after fasting all night. Biochemical analyses were performed (including CRP and glucose) on an ABX Pentra 120 (Biochem, Tokyo, Japan) and HbA1c was determined by high performance liquid chromatography (Siemens Advia 1800; Arkray, Kyoto, Japan).
Statistical AnalysisAnalyses were performed using SPSS for Windows, version 16.0 (SPSS, Chicago, IL, USA). Normal distribution of all the variables was evaluated using the Kolmogorov–Smirnov test. Continuous variables with a normal distribution are expressed as mean±standard deviation (SD). Continuous variables with a non-normal distribution are summarized as median (interquartile range [IQR]).
Discrete variables are expressed as a number (percentage). Parameters with a normal distribution and comparisons of independent groups were based on the Mann–Whitney U test. Correlations between non-continuous variables were studied using the Spearman correlation, while correlations between continuous variables were studied using the Pearson correlation. Comparisons of the groups were performed with one-way ANOVA, applying the Bonferroni method. A P value <.05 was considered statistically significant.
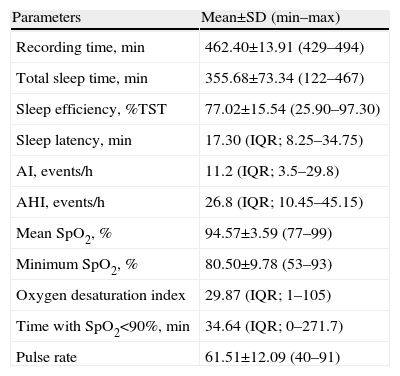
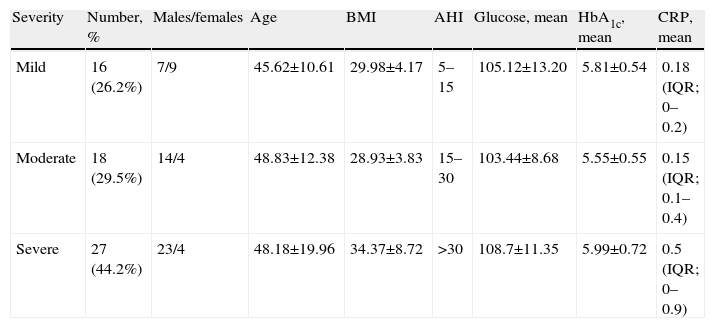
ResultsA total of 90 patients were evaluated, of whom 61 were included in the study. The mean age of the study group was 47.7±11.2 years (18–75 years); 44 patients (72%) were males. The mean body mass index (BMI) was 31.6±6.9kg/m2 (21.6 and 68.4kg/m2). The patients’ sleeping characteristics are summarized in Table 1, and the mean glucose, HbA1c and CRP in relation to the OSAS classifications are shown in Table 2.
Patient Sleep Characteristics.
| Parameters | Mean±SD (min–max) |
| Recording time, min | 462.40±13.91 (429–494) |
| Total sleep time, min | 355.68±73.34 (122–467) |
| Sleep efficiency, %TST | 77.02±15.54 (25.90–97.30) |
| Sleep latency, min | 17.30 (IQR; 8.25–34.75) |
| AI, events/h | 11.2 (IQR; 3.5–29.8) |
| AHI, events/h | 26.8 (IQR; 10.45–45.15) |
| Mean SpO2, % | 94.57±3.59 (77–99) |
| Minimum SpO2, % | 80.50±9.78 (53–93) |
| Oxygen desaturation index | 29.87 (IQR; 1–105) |
| Time with SpO2<90%, min | 34.64 (IQR; 0–271.7) |
| Pulse rate | 61.51±12.09 (40–91) |
TST, total sleep time; AI, apnea index; AHI, apnea-hypopnea index; SpO2, hemoglobin oxygen saturation measured with pulse oximetry.
OSAS Classifications and Blood Glucose Parameters in Study Patients.
| Severity | Number, % | Males/females | Age | BMI | AHI | Glucose, mean | HbA1c, mean | CRP, mean |
| Mild | 16 (26.2%) | 7/9 | 45.62±10.61 | 29.98±4.17 | 5–15 | 105.12±13.20 | 5.81±0.54 | 0.18 (IQR; 0–0.2) |
| Moderate | 18 (29.5%) | 14/4 | 48.83±12.38 | 28.93±3.83 | 15–30 | 103.44±8.68 | 5.55±0.55 | 0.15 (IQR; 0.1–0.4) |
| Severe | 27 (44.2%) | 23/4 | 48.18±19.96 | 34.37±8.72 | >30 | 108.7±11.35 | 5.99±0.72 | 0.5 (IQR; 0–0.9) |
BMI, body mass index; AHI, apnea-hypopnea index; HbA1c, glycosylated hemoglobin; CRP, C-reactive protein.
The BMI showed a positive correlation with the apnea index, apnea-hypopnea index and oxygen desaturation index (ODI) (P=.012, r=0.321; P=.001, r=0.400; P=.001, r=0.411, respectively), while there was a negative correlation with the minimum SpO2 (P=.00, r=−0.481). The BMI also showed a positive correlation with the HbA1c and fasting glucose levels (P=.00, r=−0.503; P=.045, r=−0.258), but no correlation was detected with the CRP.
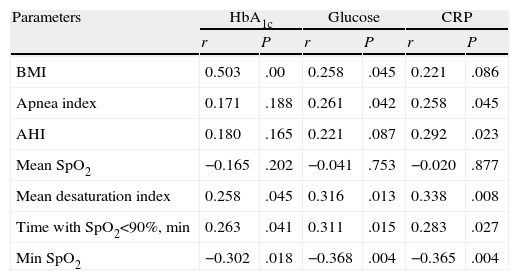
There were no significant differences between the mild and moderate groups, or between the mild and severe groups with respect to the HbA1c, glucose or CRP values, but the HbA1c showed a significant difference between the moderate and severe groups (P=.038). No significant differences were observed either between the three groups in these parameters (P=.187, P=.646, P=.237, respectively). A correlation was observed between the HbA1c, fasting glucose and CRP levels and the parameters related with apnea and oxygen desaturation during sleep, as shown in Table 3. All these correlations disappeared when the effect was corrected as a factor of the BMI, by partial correlation analysis (P>.05).
Correlations Between Parameters Related With Apnea and HbA1c, Glucose and CRP Levels.
| Parameters | HbA1c | Glucose | CRP | |||
| r | P | r | P | r | P | |
| BMI | 0.503 | .00 | 0.258 | .045 | 0.221 | .086 |
| Apnea index | 0.171 | .188 | 0.261 | .042 | 0.258 | .045 |
| AHI | 0.180 | .165 | 0.221 | .087 | 0.292 | .023 |
| Mean SpO2 | −0.165 | .202 | −0.041 | .753 | −0.020 | .877 |
| Mean desaturation index | 0.258 | .045 | 0.316 | .013 | 0.338 | .008 |
| Time with SpO2<90%, min | 0.263 | .041 | 0.311 | .015 | 0.283 | .027 |
| Min SpO2 | −0.302 | .018 | −0.368 | .004 | −0.365 | .004 |
AHI: apnea-hypopnea index; mean SpO2: meanhemoglobin oxygen saturation measured with pulse oximetry; min SpO2: minimum hemoglobin oxygen saturation measured with pulse oximetry.
The BMI, ODI and minimum SpO2 were statistically significant in comparisons between two groups, due to fasting plasma glucose levels less than 100mg/dl (19 cases) or between 100mg/dl and 125mg/dl (42 cases) (P=.045, P=.002, P=.006).
DiscussionThis study evaluated the possible correlation of sleep-disordered breathing with glucose metabolism in non-diabetic patients with OSAS and no co-morbidities. Our results suggest that, in non-diabetic patients, hypoxia during the night is associated with an increase in fasting glucose levels and HbA1c, but this relationship disappears when a BMI correction is introduced. It could be proposed that, apart from the disease severity and the AHI, intermittent hypoxia may play a role in, and influence glucose metabolism in patients with OSAS, but it could also cause obesity.
Glucose intolerance and an increase in DM rates have often been observed in patients with OSAS, and could be related to obesity, as has also been documented in the study by Tasali et al. in their patient group.14 However, some studies suggest that OSAS could be a risk factor for DM, regardless of the concomitant presence of obesity.15,16 The hypothesis is that nocturnal respiratory disorders include glucose metabolism either due to repeated oxygen desaturation or due to a sleep disturbance. As in previous studies, the relationship between the mean desaturation index and the length of time during which the patient remains below 90% SpO2, and the HbA1c and glucose levels disappeared after we introduced a correction for obesity. This may be related to the fact that we included all consecutive non-diabetic patients with a diagnosis of OSAS in our sleep laboratory, and because most of our patients were obese (median BMI of 31.2). This could be explained because OSAS was also a component of metabolic syndrome.
In recent studies, it was observed that the relationship of HbA1c and hypoxia in euglycemic patients with OSAS was significant. In one study, the hypoxemia severity in non-diabetic patients with sleep apnea showed a relationship with HbA1c levels, and CPAP therapy for 3–5 months reduced HbA1c levels in patients with severe sleep apnea.17 As in another study conducted in 56 euglycemic patients newly diagnosed with OSAS, it was observed that nocturnal hypoxia may affect fasting insulin levels. Good adherence to more than 6 months of CPAP therapy can significantly reduce HbA1c levels, but has no effect on insulin resistance markers.18 In a recent meta-analysis, it was observed that OSAS was associated with potentiation of sympathetic activation and a decrease in glucose tolerance, and that both conditions remitted after CPAP treatment.19 However, these studies were of short duration, and the issue has still not been addressed in long-term randomized, controlled trials.
Our study supported this hypothesis, and showed that nocturnal hypoxia is related with glucose and HbA1c levels in non-diabetic euglycemic patients with OSAS. The intermittent hypoxia parameters were also correlated with the CRP. Intermittent hypoxia affects glucose metabolism by inducing systemic activation, increasing systemic inflammation, increasing counter-regulatory hormones and fatty acids, and causing pancreatic beta cell dysfunction.20 However, in the present study, we did not observe a significant relationship between the CRP values and the HbA1c and glucose levels, which could be because we did not use high sensitivity CRP, which is a more sensitive measure of inflammation.
A harmful effect of severe OSAS on blood glucose levels has been observed in elderly hypertensive patients, and a significant increase in fasting glucose and HbA1c levels has been found in these patients.21 We did not observe any relationship between fasting glucose and the apnea-hypopnea index, or with OSAS severity. However, we did observe that the oxygen desaturation index and minimum desaturation index were significantly higher in patients with fasting glucose values between 100mg/dl and 125mg/dl (which is a marker of impaired fasting blood glucose) compared with those who had fasting glucose values less than 100mg/dl.22,23 Patients with fasting glucose values between 100mg/dl and 125mg/dl were referred for further assessment of possible diabetes. The reason for the abnormal fasting glucose values could be an effect of the intermittent hypoxia. The effect of hypoxia and re-oxygenation cycles cause impaired glucose metabolism, as it causes endothelial dysfunction, which would trigger the formation of inflammatory cytokines, an increase in the release of vasoactive hormones and development of oxidative stress.24–26 Another factor that causes impaired fasting glucose could be an effect of activation of the sympathetic system on glucose homeostasis, by increasing the degradation of muscle glycogen stores, glucose production and release of fatty acids via stimulation of lipolysis, as shown in the study by Iiyori et al.27
Studies have not only been conducted that show an inverse relationship between OSAS severity and HbA1c levels in patients with type 2 diabetes, but there are also studies that show the same relationship in non-diabetic patients with OSAS.12,28 A significant correlation was observed between HbA1c and the apnea-hypopnea index, arousal index and severity of nocturnal hypoxemia in the study carried out by Papanas et al., but these authors did not observe any relationship between the BMI and HbA1c and fasting glucose levels.12 In our study, the BMI showed a correlation with the hypoxia severity and the AHI. A positive relationship was also identified between the BMI and HbA1c and fasting glucose levels, unlike that observed in the study by Papanas et al. It is likely that OSAS severity increases as the BMI increases. In a study carried out on morbidly obese patients, it was observed that as the severity of the AHI increased, there was progressive worsening of the metabolic parameters.29 This suggests a metabolic syndrome, which is known to accelerate atherosclerosis, diabetes and dyslipidemia, as does OSAS.30
In the medical literature, it has been indicated that patients with OSAS have a higher probability of having glucose intolerance compared to healthy controls.14 Compared to controls, the mean HbA1c increased in patients with OSAS, and the percentage of values above the reference range for both HbA1c and fasting plasma glucose indicated an increased risk of diabetes in patients with OSAS (20-fold), respectively.10 There was no control group in this study, but we observed a significant difference between the moderate and severe OSAS groups with respect to the mean HbA1c values. However, since our sample size was small, it is difficult to draw definitive conclusions about our results.
OSAS and metabolic syndrome have common etiological risk factors, such as central obesity and age. The increased beta cell function caused by the hypoxia will exert an effect on endothelial dysfunction in both conditions. As has been defined in previous studies, nocturnal hypoxia may influence fasting glucose levels, but CPAP treatment reduces HbA1c only.17 As in our study, these authors did not observe a relationship between the AHI and HbA1c and, similarly, this effect can be explained by the correction of the hypoxia brought about by the CPAP.
Few studies have evaluated the relationship between sleep apnea and HbA1c, an issue which is becoming increasingly important. In contrast to the study by Steiropoulos et al., we observed a relationship between HbA1c and sleep characteristics.18 Unlike that observed in the Sleep Heart Health Study, in which patients with moderate or severe sleep-disordered breathing had higher HOMA index values, regardless of age, BMI, gender, or smoking, we used HbA1c to evaluate the insulin metabolism, which is easier and cheaper to measure in clinical practice.8
In conclusion, this study examined the possible correlation of sleep-disordered breathing with glucose metabolism in non-diabetic patients with OSAS. Our results suggest that, in non-diabetic patients with OSAS and no comorbidities, nocturnal hypoxia is associated with an increase in fasting glucose, HbA1c and CRP levels, although there is no relationship with the apnea-hypopnea index. It could be proposed that, apart from the severity of the disease, intermittent hypoxia plays a role in sympathetic hyperactivity, impaired endothelial function and the influence of glucose metabolism in patients with OSAS. However, since many of our patients were obese, and taking into account that the relationship disappeared after introducing a correction for the BMI, it is not clear whether hypoxia is the primary and principal cause of glucose intolerance in patients with OSAS. Our data suggest that a more detailed study assessing diabetes in obese patients with intermittent hypoxia during the night may be recommended.
Conflict of InterestsThe authors have not declared any conflict of interests.
Please cite this article as: Sökücü SN, et al. Efecto de la hipoxia sobre el metabolismo de la glucosa en pacientes no diabéticos con síndrome de apnea obstructiva del sueño. Actas Dermosifiliogr. 2013;49:321–5.


