

The nocebo effect is a phenomenon involving symptom induction, disease worsening or treatment-emergent adverse effects that arise out of a subjects’ negative expectations rather than being an actual complication of symptoms [1]. Continuous positive airway pressure (CPAP) treatment is the gold standard treatment for obstructive sleep apnea (OSA). Nevertheless, adherence has been described to be in the 42–72% range [2,3] or even lower [4] and approximately 40% of patients report at least one side effect during the first months of treatment [5–7]. Some adverse effects of CPAP treatment are clearly objective; however, most of them have a high subjective component in which patients’ expectations could influence the interpretation of its presence or intensity. Therefore, CPAP is a therapy in which the nocebo effect can play an important role, but it has never been explored. The aim of our study was to evaluate whether the information provided during the adaptation session to CPAP treatment could impact the presence of side effects and short-term compliance.
This was an unicentric randomized controlled trial including adult subjects diagnosed of OSA and with indication of CPAP treatment based on current guidelines [8]. Participants were consecutively recruited (March 2022–July 2023) and randomly assigned to the usual information or the detailed information groups during the adaptation session to CPAP therapy which was performed on an outpatient basis by trained personnel. Information and procedures during the session were exactly the same between groups except for the information related to side effects. Subjects allocated to the usual information group receive information on OSA symptoms and consequences and also on CPAP treatment and expected benefits of the therapy. They received general information regarding side effects but without giving details on frequency or listing all existing undesirable effects. After that, subjects put on the CPAP to be familiar with the equipment. The adaptation session was performed with an AutoCPAP AirSense 10 (ResMed) set between 4 and 6cmH2O and a nasal mask. The patient was in a sitting position and no humidification was used. The session lasts about 60min; 30min of explanation and other 30min testing the CPAP device. Subjects allocated to the detailed information group received exactly the same information than those allocated in the usual information group and they also put on the CPAP therapy as described above. Subjects in these group received more information related to adverse side effects of CPAP treatment. Indeed, the health care professional, in addition to general information on side effects, enumerated all the possible side effects, explained them in detail, indicated the most frequently observed and a brochure including this information was given to patients, who were followed-up at 1 and 3 months. Participants were blinded to the information group allocation and the evaluation of side effects and compliance was performed by blinded investigators. The Ethics Committee approved the protocol (HCB/2021/1330) and all participants provided informed consent. The study was registered in clinicaltrials.gov (NCT05284045). The primary outcome was a composite of side effects at 1 month evaluation. The secondary outcomes were: (i) the composite of side effects at 3-month evaluation, (ii) specific side effects at 1 and 3-month evaluation, (iii) compliance with CPAP at 1 and 3-month evaluation and (iv) other CPAP parameters and daytime sleepiness at 1 and 3-months evaluation.
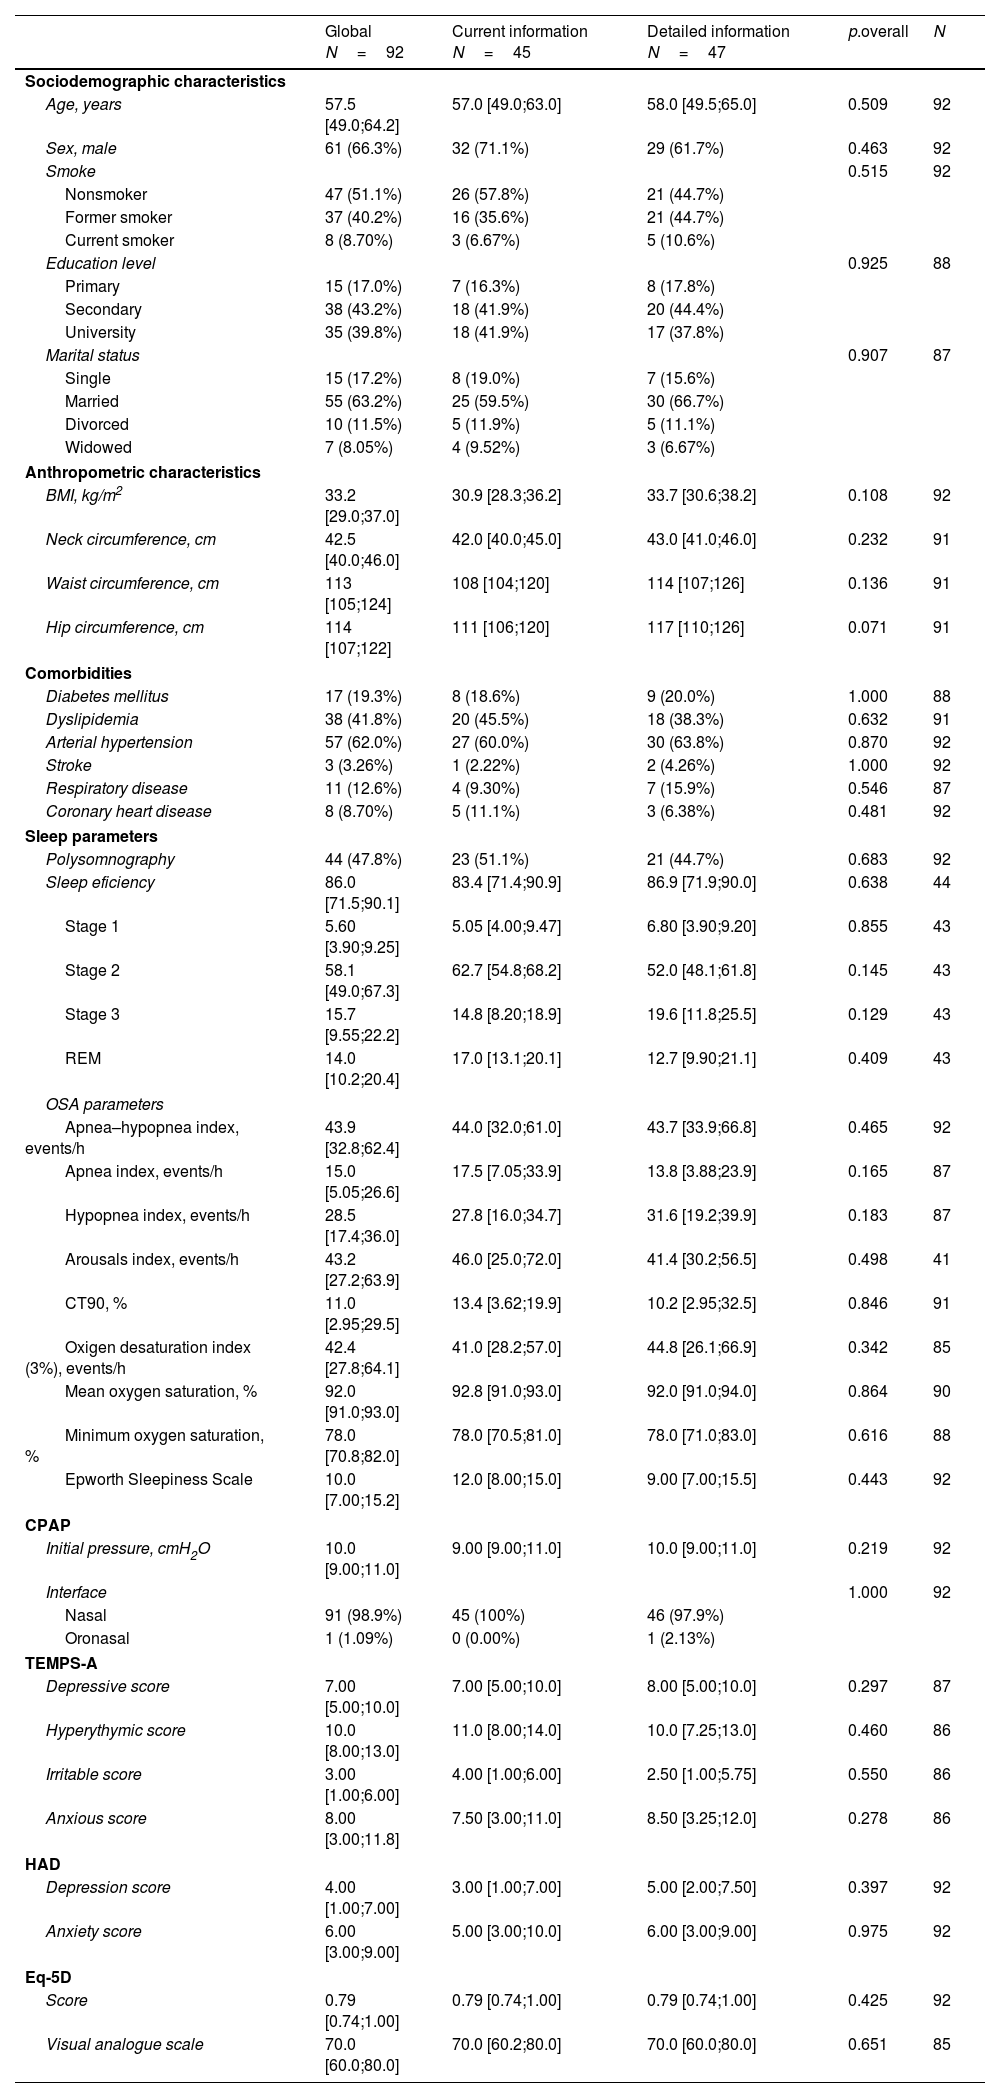
In total, 97 subjects with OSA were included and 92 ended the study. Participants included had a median (Q1; Q3) age of 57.5 (49.0–64.2) years, were predominantly male (66.3%), and the median body mass index (BMI) was 33.2 (29.0;37.0)kg/m2. The most prevalent comorbidities were hypertension (62.0%) and dyslipidemia (41.8%). Regarding OSA parameters, median (IQR) AHI was 43.9 (32.8–62.4)events/h, 3%-ODI was 42.4 (27.8–64.1)events/h, CT90 was 11.0% (2.95–29.5) and ESS was 10 (7–15.2). Treatment CPAP pressure used was 10 (9.0–11.0)cmH2O and most the patients used a nasal interface (98.9%). There were no differences in the baseline characteristics between arms (Table 1).
Baseline characteristics of all subjects included.
| Global N=92 | Current information N=45 | Detailed information N=47 | p.overall | N | |
|---|---|---|---|---|---|
| Sociodemographic characteristics | |||||
| Age, years | 57.5 [49.0;64.2] | 57.0 [49.0;63.0] | 58.0 [49.5;65.0] | 0.509 | 92 |
| Sex, male | 61 (66.3%) | 32 (71.1%) | 29 (61.7%) | 0.463 | 92 |
| Smoke | 0.515 | 92 | |||
| Nonsmoker | 47 (51.1%) | 26 (57.8%) | 21 (44.7%) | ||
| Former smoker | 37 (40.2%) | 16 (35.6%) | 21 (44.7%) | ||
| Current smoker | 8 (8.70%) | 3 (6.67%) | 5 (10.6%) | ||
| Education level | 0.925 | 88 | |||
| Primary | 15 (17.0%) | 7 (16.3%) | 8 (17.8%) | ||
| Secondary | 38 (43.2%) | 18 (41.9%) | 20 (44.4%) | ||
| University | 35 (39.8%) | 18 (41.9%) | 17 (37.8%) | ||
| Marital status | 0.907 | 87 | |||
| Single | 15 (17.2%) | 8 (19.0%) | 7 (15.6%) | ||
| Married | 55 (63.2%) | 25 (59.5%) | 30 (66.7%) | ||
| Divorced | 10 (11.5%) | 5 (11.9%) | 5 (11.1%) | ||
| Widowed | 7 (8.05%) | 4 (9.52%) | 3 (6.67%) | ||
| Anthropometric characteristics | |||||
| BMI, kg/m2 | 33.2 [29.0;37.0] | 30.9 [28.3;36.2] | 33.7 [30.6;38.2] | 0.108 | 92 |
| Neck circumference, cm | 42.5 [40.0;46.0] | 42.0 [40.0;45.0] | 43.0 [41.0;46.0] | 0.232 | 91 |
| Waist circumference, cm | 113 [105;124] | 108 [104;120] | 114 [107;126] | 0.136 | 91 |
| Hip circumference, cm | 114 [107;122] | 111 [106;120] | 117 [110;126] | 0.071 | 91 |
| Comorbidities | |||||
| Diabetes mellitus | 17 (19.3%) | 8 (18.6%) | 9 (20.0%) | 1.000 | 88 |
| Dyslipidemia | 38 (41.8%) | 20 (45.5%) | 18 (38.3%) | 0.632 | 91 |
| Arterial hypertension | 57 (62.0%) | 27 (60.0%) | 30 (63.8%) | 0.870 | 92 |
| Stroke | 3 (3.26%) | 1 (2.22%) | 2 (4.26%) | 1.000 | 92 |
| Respiratory disease | 11 (12.6%) | 4 (9.30%) | 7 (15.9%) | 0.546 | 87 |
| Coronary heart disease | 8 (8.70%) | 5 (11.1%) | 3 (6.38%) | 0.481 | 92 |
| Sleep parameters | |||||
| Polysomnography | 44 (47.8%) | 23 (51.1%) | 21 (44.7%) | 0.683 | 92 |
| Sleep eficiency | 86.0 [71.5;90.1] | 83.4 [71.4;90.9] | 86.9 [71.9;90.0] | 0.638 | 44 |
| Stage 1 | 5.60 [3.90;9.25] | 5.05 [4.00;9.47] | 6.80 [3.90;9.20] | 0.855 | 43 |
| Stage 2 | 58.1 [49.0;67.3] | 62.7 [54.8;68.2] | 52.0 [48.1;61.8] | 0.145 | 43 |
| Stage 3 | 15.7 [9.55;22.2] | 14.8 [8.20;18.9] | 19.6 [11.8;25.5] | 0.129 | 43 |
| REM | 14.0 [10.2;20.4] | 17.0 [13.1;20.1] | 12.7 [9.90;21.1] | 0.409 | 43 |
| OSA parameters | |||||
| Apnea–hypopnea index, events/h | 43.9 [32.8;62.4] | 44.0 [32.0;61.0] | 43.7 [33.9;66.8] | 0.465 | 92 |
| Apnea index, events/h | 15.0 [5.05;26.6] | 17.5 [7.05;33.9] | 13.8 [3.88;23.9] | 0.165 | 87 |
| Hypopnea index, events/h | 28.5 [17.4;36.0] | 27.8 [16.0;34.7] | 31.6 [19.2;39.9] | 0.183 | 87 |
| Arousals index, events/h | 43.2 [27.2;63.9] | 46.0 [25.0;72.0] | 41.4 [30.2;56.5] | 0.498 | 41 |
| CT90, % | 11.0 [2.95;29.5] | 13.4 [3.62;19.9] | 10.2 [2.95;32.5] | 0.846 | 91 |
| Oxigen desaturation index (3%), events/h | 42.4 [27.8;64.1] | 41.0 [28.2;57.0] | 44.8 [26.1;66.9] | 0.342 | 85 |
| Mean oxygen saturation, % | 92.0 [91.0;93.0] | 92.8 [91.0;93.0] | 92.0 [91.0;94.0] | 0.864 | 90 |
| Minimum oxygen saturation, % | 78.0 [70.8;82.0] | 78.0 [70.5;81.0] | 78.0 [71.0;83.0] | 0.616 | 88 |
| Epworth Sleepiness Scale | 10.0 [7.00;15.2] | 12.0 [8.00;15.0] | 9.00 [7.00;15.5] | 0.443 | 92 |
| CPAP | |||||
| Initial pressure, cmH2O | 10.0 [9.00;11.0] | 9.00 [9.00;11.0] | 10.0 [9.00;11.0] | 0.219 | 92 |
| Interface | 1.000 | 92 | |||
| Nasal | 91 (98.9%) | 45 (100%) | 46 (97.9%) | ||
| Oronasal | 1 (1.09%) | 0 (0.00%) | 1 (2.13%) | ||
| TEMPS-A | |||||
| Depressive score | 7.00 [5.00;10.0] | 7.00 [5.00;10.0] | 8.00 [5.00;10.0] | 0.297 | 87 |
| Hyperythymic score | 10.0 [8.00;13.0] | 11.0 [8.00;14.0] | 10.0 [7.25;13.0] | 0.460 | 86 |
| Irritable score | 3.00 [1.00;6.00] | 4.00 [1.00;6.00] | 2.50 [1.00;5.75] | 0.550 | 86 |
| Anxious score | 8.00 [3.00;11.8] | 7.50 [3.00;11.0] | 8.50 [3.25;12.0] | 0.278 | 86 |
| HAD | |||||
| Depression score | 4.00 [1.00;7.00] | 3.00 [1.00;7.00] | 5.00 [2.00;7.50] | 0.397 | 92 |
| Anxiety score | 6.00 [3.00;9.00] | 5.00 [3.00;10.0] | 6.00 [3.00;9.00] | 0.975 | 92 |
| Eq-5D | |||||
| Score | 0.79 [0.74;1.00] | 0.79 [0.74;1.00] | 0.79 [0.74;1.00] | 0.425 | 92 |
| Visual analogue scale | 70.0 [60.0;80.0] | 70.0 [60.2;80.0] | 70.0 [60.0;80.0] | 0.651 | 85 |
Abbreviations: BMI=body mass index, CT90=percentage of time with oxygen saturation<90%.
Notes: Quantitative variables are described by median [25th percentile; 75th percentile], and qualitative variables are described by absolute and relative frequencies.
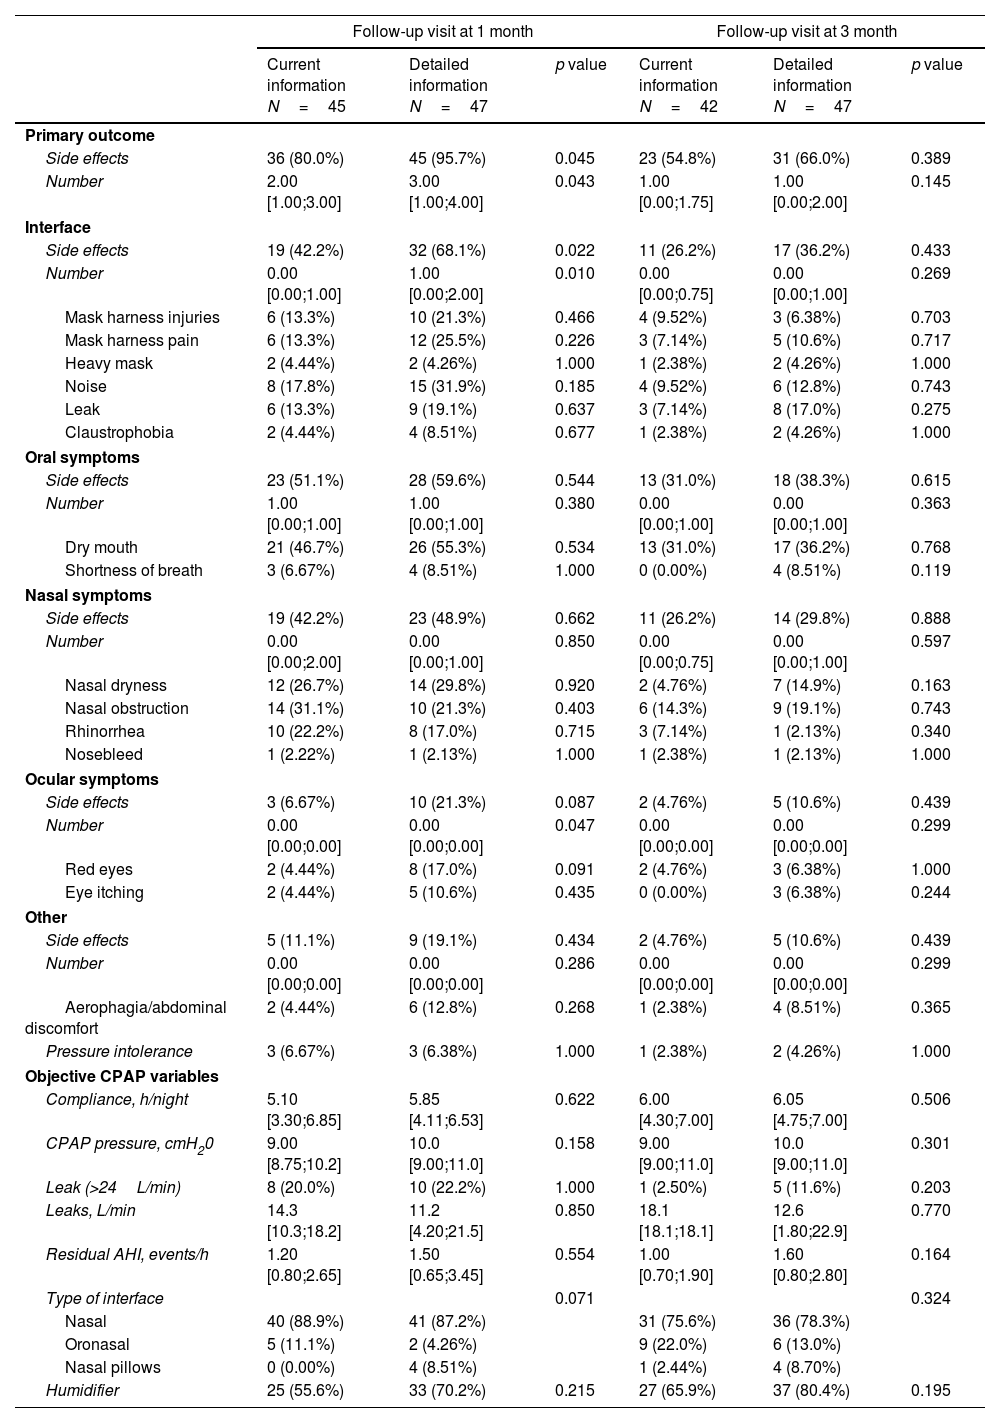
The presence of side effects was compared between the usual information and detailed information groups. At 1-month evaluation, we observed higher incidence of side effects in the detailed information than in the usual information arm (95.7% versus 80%, p=0.045) with a relative risk ((95%CI) of 1.20 (1.02–1.40)). Furthermore, patients provided with detailed information showed a higher number of adverse effects. Side effects were mostly related to interface and were more frequently reported in the group of detailed information than in the usual information group (68.1% versus 42.2%, p=0.022). No differences were observed in oral and nasal symptoms between the groups. Higher frequency of ocular symptoms was found in the detailed information compared to the usual information arms, but results did not reach statistical significance. In general, there were fewer side effects at 3-month evaluation in both information groups, especially due to a reduction in the side effects related to interface. No significant differences in the incidence of side effects between the groups were observed at the 3-month evaluation (Table 2). Despite higher incidence of side effects in the detailed information group, no significant differences between the arms were observed in CPAP variables objectively assessed from the device such as leaks, CPAP pressure or residual AHI at 1 and 3-month follow-up. Moreover, there were not significant differences in the compliance with CPAP treatment between the detailed information and usual information groups at 1-month and 3-month evaluation (Table 2).
Side effects and objective CPAP according to the information group at 1 and 3-month visits.
| Follow-up visit at 1 month | Follow-up visit at 3 month | |||||
|---|---|---|---|---|---|---|
| Current information N=45 | Detailed information N=47 | p value | Current information N=42 | Detailed information N=47 | p value | |
| Primary outcome | ||||||
| Side effects | 36 (80.0%) | 45 (95.7%) | 0.045 | 23 (54.8%) | 31 (66.0%) | 0.389 |
| Number | 2.00 [1.00;3.00] | 3.00 [1.00;4.00] | 0.043 | 1.00 [0.00;1.75] | 1.00 [0.00;2.00] | 0.145 |
| Interface | ||||||
| Side effects | 19 (42.2%) | 32 (68.1%) | 0.022 | 11 (26.2%) | 17 (36.2%) | 0.433 |
| Number | 0.00 [0.00;1.00] | 1.00 [0.00;2.00] | 0.010 | 0.00 [0.00;0.75] | 0.00 [0.00;1.00] | 0.269 |
| Mask harness injuries | 6 (13.3%) | 10 (21.3%) | 0.466 | 4 (9.52%) | 3 (6.38%) | 0.703 |
| Mask harness pain | 6 (13.3%) | 12 (25.5%) | 0.226 | 3 (7.14%) | 5 (10.6%) | 0.717 |
| Heavy mask | 2 (4.44%) | 2 (4.26%) | 1.000 | 1 (2.38%) | 2 (4.26%) | 1.000 |
| Noise | 8 (17.8%) | 15 (31.9%) | 0.185 | 4 (9.52%) | 6 (12.8%) | 0.743 |
| Leak | 6 (13.3%) | 9 (19.1%) | 0.637 | 3 (7.14%) | 8 (17.0%) | 0.275 |
| Claustrophobia | 2 (4.44%) | 4 (8.51%) | 0.677 | 1 (2.38%) | 2 (4.26%) | 1.000 |
| Oral symptoms | ||||||
| Side effects | 23 (51.1%) | 28 (59.6%) | 0.544 | 13 (31.0%) | 18 (38.3%) | 0.615 |
| Number | 1.00 [0.00;1.00] | 1.00 [0.00;1.00] | 0.380 | 0.00 [0.00;1.00] | 0.00 [0.00;1.00] | 0.363 |
| Dry mouth | 21 (46.7%) | 26 (55.3%) | 0.534 | 13 (31.0%) | 17 (36.2%) | 0.768 |
| Shortness of breath | 3 (6.67%) | 4 (8.51%) | 1.000 | 0 (0.00%) | 4 (8.51%) | 0.119 |
| Nasal symptoms | ||||||
| Side effects | 19 (42.2%) | 23 (48.9%) | 0.662 | 11 (26.2%) | 14 (29.8%) | 0.888 |
| Number | 0.00 [0.00;2.00] | 0.00 [0.00;1.00] | 0.850 | 0.00 [0.00;0.75] | 0.00 [0.00;1.00] | 0.597 |
| Nasal dryness | 12 (26.7%) | 14 (29.8%) | 0.920 | 2 (4.76%) | 7 (14.9%) | 0.163 |
| Nasal obstruction | 14 (31.1%) | 10 (21.3%) | 0.403 | 6 (14.3%) | 9 (19.1%) | 0.743 |
| Rhinorrhea | 10 (22.2%) | 8 (17.0%) | 0.715 | 3 (7.14%) | 1 (2.13%) | 0.340 |
| Nosebleed | 1 (2.22%) | 1 (2.13%) | 1.000 | 1 (2.38%) | 1 (2.13%) | 1.000 |
| Ocular symptoms | ||||||
| Side effects | 3 (6.67%) | 10 (21.3%) | 0.087 | 2 (4.76%) | 5 (10.6%) | 0.439 |
| Number | 0.00 [0.00;0.00] | 0.00 [0.00;0.00] | 0.047 | 0.00 [0.00;0.00] | 0.00 [0.00;0.00] | 0.299 |
| Red eyes | 2 (4.44%) | 8 (17.0%) | 0.091 | 2 (4.76%) | 3 (6.38%) | 1.000 |
| Eye itching | 2 (4.44%) | 5 (10.6%) | 0.435 | 0 (0.00%) | 3 (6.38%) | 0.244 |
| Other | ||||||
| Side effects | 5 (11.1%) | 9 (19.1%) | 0.434 | 2 (4.76%) | 5 (10.6%) | 0.439 |
| Number | 0.00 [0.00;0.00] | 0.00 [0.00;0.00] | 0.286 | 0.00 [0.00;0.00] | 0.00 [0.00;0.00] | 0.299 |
| Aerophagia/abdominal discomfort | 2 (4.44%) | 6 (12.8%) | 0.268 | 1 (2.38%) | 4 (8.51%) | 0.365 |
| Pressure intolerance | 3 (6.67%) | 3 (6.38%) | 1.000 | 1 (2.38%) | 2 (4.26%) | 1.000 |
| Objective CPAP variables | ||||||
| Compliance, h/night | 5.10 [3.30;6.85] | 5.85 [4.11;6.53] | 0.622 | 6.00 [4.30;7.00] | 6.05 [4.75;7.00] | 0.506 |
| CPAP pressure, cmH20 | 9.00 [8.75;10.2] | 10.0 [9.00;11.0] | 0.158 | 9.00 [9.00;11.0] | 10.0 [9.00;11.0] | 0.301 |
| Leak (>24L/min) | 8 (20.0%) | 10 (22.2%) | 1.000 | 1 (2.50%) | 5 (11.6%) | 0.203 |
| Leaks, L/min | 14.3 [10.3;18.2] | 11.2 [4.20;21.5] | 0.850 | 18.1 [18.1;18.1] | 12.6 [1.80;22.9] | 0.770 |
| Residual AHI, events/h | 1.20 [0.80;2.65] | 1.50 [0.65;3.45] | 0.554 | 1.00 [0.70;1.90] | 1.60 [0.80;2.80] | 0.164 |
| Type of interface | 0.071 | 0.324 | ||||
| Nasal | 40 (88.9%) | 41 (87.2%) | 31 (75.6%) | 36 (78.3%) | ||
| Oronasal | 5 (11.1%) | 2 (4.26%) | 9 (22.0%) | 6 (13.0%) | ||
| Nasal pillows | 0 (0.00%) | 4 (8.51%) | 1 (2.44%) | 4 (8.70%) | ||
| Humidifier | 25 (55.6%) | 33 (70.2%) | 0.215 | 27 (65.9%) | 37 (80.4%) | 0.195 |
Abbreviations: AHI=apnea–hypopnea index.
Notes: Quantitative variables are described by median [25th percentile; 75th percentile], and qualitative variables are described by absolute and relative frequencies.
Therefore, this study showed that OSA patients who received detailed information on adverse effects during the adaptation session to CPAP therapy presented higher incidence of side effects at 1-month visit than subjects in the usual information group, but without differences in compliance. These side effects were mostly related to the interface. Our study also showed that there were not significant differences in the incidence of side effects at 3 months evaluation, indicating that the initial nocebo effect was attenuated or disappeared over time.
These results are in line with studies describing that verbal or written information given to patients could impact on the presence of side effects as has been reported with different oral treatments [9] but not previously reported with a medical device such as CPAP. Disclosing potential adverse effects of CPAP treatment and the induced negative expectations could probably focus attention on these symptoms resulting in greater report in the detailed information group.
The most frequent side effects reported were those related to the interface [3,10] and among them, noise and leaks were those most commonly observed as previously reported [7,11–13]. It is important to note that the incidence of reported leaks in this study was clearly lower than previously described (19.1% vs 75.4%) [11], which could be related to the type of interface (almost 100% nasal mask in our trial vs 54% in the other study) or CPAP modes used (100% with fixed pressure in our study vs 12.9% in other studies). As previously described [11,14], we observed differences in the incidence of side effects related to interface without differences in objectively assessed variables such as device-reported leaks. This is probably due to the fact that the perception of leak is a complex phenomenon involving the strength of the leak but also the perceptions and expectations of the patient, that could have been influenced by the information given before treatment.
Despite a higher incidence of side effects in the detailed information group, no differences in compliance were observed. Our results are contradictory with studies describing that side effects are associated to lower compliance [7,11], nevertheless, this association has not been consistently found [15,5,16]. Differences in compliance could be related to the severity of side effects, the type of mask used (oronasal masks have been related to lower compliance than nasal masks [17]) or to patients’ profile because subjects recruited from cardiology and neurology departments are expected to be less symptomatic and less worried about sleep, facts that could have affected the compliance rates.
It is important to highlight that an accurate and well-conducted initial therapeutic education session, even in case of giving detailed information on side effects, is essential to achieving long term compliance. Poor experiences or difficulties at the beginning of the therapy have been associated to lower compliance [7] showing the importance of information given to patients but also of choosing the correct mask and pressure level from the very beginning. Compliance in the first months is a predictor of long-term use and therefore all the interventions at the beginning of the therapy and tools such as telemonitoring or mobile applications could strengthen education and compliance.
Our study shows higher incidence of side effects at the 1-month visit but not at the 3-month evaluation. This observation indicates that the initial nocebo effect is progressively attenuated along follow-up visits. Our results are in agreement with studies indicating that the placebo and nocebo effects would be expected to decrease and disappear over time, but are contrary to studies suggesting that expectations can work via self-reinforcing feedback loops preventing the nocebo effect from extinction [18,19], even though the latter evaluated the persistence of the effects at very short term, usually days or 1–2 weeks, and it has never been described in a follow-up of months as evaluated in our study. The nocebo effect has been described to usually decrease or disappear in shorter time points than in our study. It is possible that giving a brochure with information on side effects to the patient, who may reread it at home, could have contributed to maintain the effect until the 1-month visit but eventually fade over time and not being observed in the 3-month visit.
The main strength of our study is that it is the first study evaluating the nocebo effect in subjects with OSA and CPAP treatment. Second, the study design, in a randomized clinical trial, allows inferring causality. Third, we also evaluated the extinction effect over time in a longer follow-up than previously described. Fourth, there were very few losses to follow-up. This study has also limitations. First, the adaptation session has a standardized protocol but it cannot ensure how the patient interprets the information provided; nevertheless, the randomized design minimizes this limitation. Second, the limited sample size may underrepresent the target population and does not allow adjusting for multiple comparisons in secondary outcomes, increasing the risk of Type I error.
In conclusion, our study demonstrates that the nocebo effect exists in OSA patients on CPAP treatment although it does not influence compliance and disappears over time. Further studies could evaluate whether there is a clinical profile more susceptible to the nocebo effect and in which this effect could have an impact on compliance.
Authors’ contributionsM.D. and R.F. had full access to all the data in the study, and M.D. takes responsibility for (is the guarantor) the content of the manuscript, including the data and analysis. M.D. and R.F. contributed to the study concept and design, data analysis and interpretation, drafting of the manuscript, and critical revision of the manuscript. M.D. contributed to the study concept, coordination of the data acquisition, data analysis, interpretation and writing of the manuscript. I.D.B. performed the statistical analysis and participated in manuscript preparation. L.L.E., C.R., M.P. and J.G. participated in the study design and data acquisition. All the authors participated in data interpretation, reviewed the article, and approved its submission to Archivos de Bronoconeumología.
Role of sponsorsThe sponsor had no role in the design of the study, the collection and analysis of the data, or the preparation of the manuscript.
Artificial intelligence involvementNone.
Funding informationThis work was supported by Sociedad Española del Sueño (SES).
Conflict of interestsThe authors state that they have no conflict of interests.


