


Mortality risk prediction for Intermediate Respiratory Care Unit's (IRCU) patients can facilitate optimal treatment in high-risk patients. While Intensive Care Units (ICUs) have a long term experience in using algorithms for this purpose, due to the special features of the IRCUs, the same strategics are not applicable. The aim of this study is to develop an IRCU specific mortality predictor tool using machine learning methods.
MethodsVital signs of patients were recorded from 1966 patients admitted from 2007 to 2017 in the Jiménez Díaz Foundation University Hospital's IRCU. A neural network was used to select the variables that better predict mortality status. Multivariate logistic regression provided us cut-off points that best discriminated the mortality status for each of the parameters. A new guideline for risk assessment was applied and mortality was recorded during one year.
ResultsOur algorithm shows that thrombocytopenia, metabolic acidosis, anemia, tachypnea, age, sodium levels, hypoxemia, leukocytopenia and hyperkalemia are the most relevant parameters associated with mortality. First year with this decision scene showed a decrease in failure rate of a 50%.
ConclusionsWe have generated a neural network model capable of identifying and classifying mortality predictors in the IRCU of a general hospital. Combined with multivariate regression analysis, it has provided us with an useful tool for the real-time monitoring of patients to detect specific mortality risks. The overall algorithm can be scaled to any type of unit offering personalized results and will increase accuracy over time when more patients are included to the cohorts.
La predicción del riesgo de mortalidad de los pacientes en la unidad de cuidados respiratorios intermedios (UCRI) puede facilitar un tratamiento óptimo en pacientes de alto riesgo. Si bien las unidades de cuidados intensivos (UCI) tienen una experiencia a largo plazo en el uso de algoritmos para este propósito, debido a las características especiales de las UCRI, no se pueden aplicar las mismas estrategias. El objetivo de este estudio es desarrollar una herramienta de predicción de mortalidad específica para la UCRI utilizando métodos de aprendizaje automático.
MétodosSe registraron los signos vitales de 1.966 pacientes ingresados entre 2007 y 2017 en la UCRI del Hospital Universitario de la Fundación Jiménez Díaz. Se utilizó una red neuronal para seleccionar las variables que mejor predijeran el estado de mortalidad. La regresión logística multivariante nos proporcionó los puntos de corte que discriminaban mejor el estado de la mortalidad para cada uno de los parámetros. Se aplicó una nueva guía para la evaluación de riesgos, y se registró la mortalidad durante un año.
ResultadosNuestro algoritmo muestra que la trombocitopenia, la acidosis metabólica, la anemia, la taquipnea, la edad, los niveles de sodio, la hipoxemia, la leucocitopenia y la hipercalemia son los parámetros más relevantes asociados con la mortalidad. En el primer año con este escenario de decisión se mostró una disminución en la tasa de fracaso de un 50%.
ConclusionesHemos generado un modelo de red neuronal capaz de identificar y clasificar predictores de mortalidad en la UCRI de un hospital general. Combinado con el análisis de regresión multivariante, nos ha proporcionado una herramienta útil para la monitorización en tiempo real de pacientes para detectar riesgos de mortalidad específicos. El algoritmo general se puede modificar a escala para cualquier tipo de unidad, lo que ofrecerá resultados personalizados, y su precisión aumentará con el tiempo, según se incluyan más pacientes en las cohortes.
Respiratory diseases are the leading cause of mortality in general hospitals.1 Severely ill patients with acute respiratory failure (ARF), acute exacerbation of chronic obstructive pulmonary disease (AECOPD), weaning procedures or community-acquired pneumonia (CAP) have been historically admitted to Intensive Care Units (ICUs). However, due to the limited availability and high cost of ICU beds, these patients are often admitted primarily to other units, chiefly in Intermediate Respiratory Care Units (IRCUs).
One of the most relevant outcomes of IRCUs is patient mortality. Indeed, several studies focus on independent factors related to mortality in patients receiving noninvasive ventilation in various diseases, such as COPD,2–4 pneumonia,5,6 cardiac failure,7 Acute Respiratory Distress Syndrome,8 asthma,9 immunocompromised patients,10,11 elderly patients,12 and interstitial lung diseases.13
IRCUs have traditionally used various scoring systems for predicting mortality inherited from ICUs, such as the APACHE system,14 the Acute Physiology Score (APS) III,15 Simplified Acute Physiology Score (SAPS),16 SAPS II,17 the Sequential Organ Failure Assessment (SOFA) score,18 the Logistic Organ Dysfunction Score (LODS),19 and the Oxford Acute Severity of Illness Score (OASIS).20 It has been generally accepted that these models tend to lack sufficient calibration to be used on an individual level,21 and research goals shifted to quantify ICU and hospital performance in aggregate.
Predictive tools can be developed using a variety of techniques from clinical judgment to statistical modeling,22,23 including some based on machine-learning algorithms such as Neural Networks (NN).24,25 The ability to predict the risk of mortality for ICU and IRCU patients could facilitate optimal allocation of staff and resources to high-risk patients and ensure timely interventions.
We aimed to build a statistical framework able to adapt to specific features of a hospital in order to identify and classify mortality predictors of an IRCU.
Material and MethodsStudy PopulationThe IRCU of University Hospital fundacion Jimenez Diaz is a high complexity unit with 15% of patients requiring complicated postoperative weaning procedures, while vasoactive treatment prevalence is approximately 26%. The unit has 5 beds (1:5 patient nurse ratio), being able to reach 8 in the periods of greatest need for care (1:4 patient nurse ratio in this scenario). Our unit is an open room to guarantee the global supervision of the patients that are completely telemonitorized. Supplementary Figures 1–3 describe the material and human resources, as well as its complexity according to the average GRD value of the unit. The study was aproved by our Ethic Committee. De-identified medical records were confidentially collected from a total of 1966 patients admitted to the FJD-Hospital IRCU (Madrid, Spain) from January 2007 to December 2017. A second cohort of 230 new patients with confidential records recruited from October 2018 to September 2019 in the same IRCU, were used to measure the performance of the new IRCU protocol based on the conclusions of this work. This is an observational and retrospective study. All the patients admitted to our IRCU were selected for the study and no exclusión criteria was imposed.
Data Collection and Variables Included in the StudyVital signs of patients were recorded upon arrival at the hospital, before being admitted to the IRCU: respiratory rate (RR), temperature (T), systolic blood pressure (SBP), and diastolic blood pressure (DBP). Laboratory findings including hemoglobin (Hb), platelets (PL), leucocytes (Leucos), the International Normalized Ratio (INR), blood glucose (GLU), blood potassium (K), sodium (NA) and creatinine (CREAT) were also registered. Blood gases at the time of hospital admission were recorded (Fi02 21%), including partial oxygen pressure (P02), partial carbon dioxide pressure (PC02), PH, bicarbonates (SBC) and base excess (BE). Age and individual mortality or survival upon discharge from the IRCU was extracted from medical histories. The data was collected following standard protocols by the same personnel over the whole time period and in the two cohorts included in the study.
Missing Data ImputationA criteria for variable exclusion was defined in order to avoid introduction of statistical noise that may introduce bias in final results. Parameters with a high percentage (>25%) of missing values were excluded from the analysis. For the rest of the parameters we perform the K-nearest neighbors (KNN) imputation method implemented in the DMwR R package.
Principal Component AnalysisPrincipal component analysis (PCA) was performed on the matrix with missing data imputation, using the pca3d R library.
Sample Classification Based on Variables, Cut-off Values and Logistic Regression ModelUsing ROC curves and Youden's J statistic we obtained the cut-off point that best discriminates the mortality status for each of the parameters. Based on these cut-off points we defined a binary classification for each parameter (P-value <.2) to feed a multivariate logistic regression model. Area Under the Curve (AUC), sensitivity and specificity were calculated using a ROC curve. An internal validation of the model was performed by bootstrap method to correct for optimistic prediction. A total of 1000 bootstrap samples with replacement were generated, and the differences in AUC on the bootstrap samples and the original sample were calculated. The goodness of fit of the model was evaluated by the Hosmer and Lemeshow test.
Neural Network Implementation and Data Re-samplingA NN model was applied using the caret R package. Data matrix was normalized using the min-max scale method. Ten re-sampled matrices were calculated having samples with mortality=1 and a random selection of the same number of samples with mortality=0. Every re-sampled matrix is then subject to a 10-fold cross validation process (90% training and 10% testing). Thus, a total of 100 neural network models are performed using “nnet” method with automatic selection of: (i) the optimal number of units per hidden layer between 1 and 5, and (ii) the optimal value for the regularization parameter (between 0.1 and 0.5 with increments of 0.1). The “twoClassSummary” method was used to compute sensitivity, specificity and the AUC. A ROC curve is calculated for the set of predictions and real values within the loop, using the 10-fold cross validation process. The final AUC, accuracy, sensitivity and specificity were calculated as the mean of the 100 neural network models performed in total. Our R script is available at https://github.com/pminguez/MachineLearning4UnbalancedData.
Using the KNN data matrix, we calculate the Spearman correlation between every pair of variables. In order to build the network, we select the pairs that have a correlation coefficient >±0.3 and a P-value <.01. The selected pairs of variables represent the edges of the correlation network.
Comparison of FailureIn order to compare the failure before and after the new criteria to detect high risk patients was implemented, we fit Poisson regression models to calculate the annual trend of failure risk in the two periods. The relatives risks (RR) were compared using the Wald test, taking the coefficients of the models (logarithm of RR) and its standard errors.
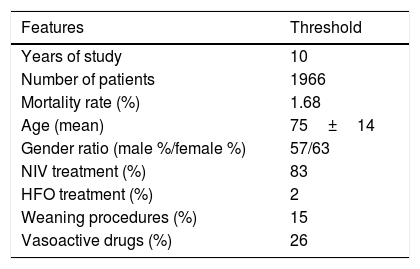
ResultsCohort and Dataset DescriptionA total of 1966 patients were included in the analysis having a global local IRCU mortality rate of 1.68% (33 patients) and a global failure (IRCU mortality+ICU transfer+outside IRCU delayed mortality) of about 5.39% (106 patients). Table 1 describes the study population with epidemiologic data and treatment used and Table 2 shows mean and standard deviation values for each of the variable used (INR was excluded). A PCA of the patients’ features did not show observable differences between patient's classifications according to mortality status (Fig. 1).
Global Profile of the Cohort Included in the Study. NIV Means Non Invasive Ventilation; HFO Means High Flow Oxygen Treatment.
| Features | Threshold |
|---|---|
| Years of study | 10 |
| Number of patients | 1966 |
| Mortality rate (%) | 1.68 |
| Age (mean) | 75±14 |
| Gender ratio (male %/female %) | 57/63 |
| NIV treatment (%) | 83 |
| HFO treatment (%) | 2 |
| Weaning procedures (%) | 15 |
| Vasoactive drugs (%) | 26 |
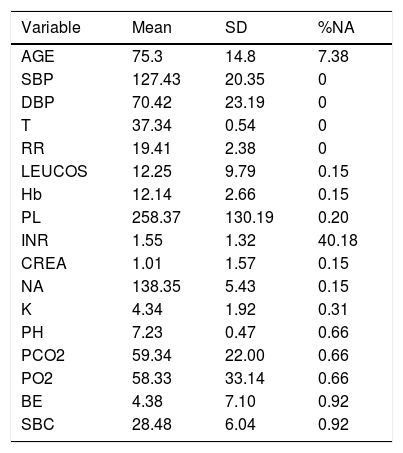
Description of the Variables and Their Values Introduced in the Analysis. Percentage of NAs (Not Available Value) Indicates the Missing Values of Every Variable.
| Variable | Mean | SD | %NA |
|---|---|---|---|
| AGE | 75.3 | 14.8 | 7.38 |
| SBP | 127.43 | 20.35 | 0 |
| DBP | 70.42 | 23.19 | 0 |
| T | 37.34 | 0.54 | 0 |
| RR | 19.41 | 2.38 | 0 |
| LEUCOS | 12.25 | 9.79 | 0.15 |
| Hb | 12.14 | 2.66 | 0.15 |
| PL | 258.37 | 130.19 | 0.20 |
| INR | 1.55 | 1.32 | 40.18 |
| CREA | 1.01 | 1.57 | 0.15 |
| NA | 138.35 | 5.43 | 0.15 |
| K | 4.34 | 1.92 | 0.31 |
| PH | 7.23 | 0.47 | 0.66 |
| PCO2 | 59.34 | 22.00 | 0.66 |
| PO2 | 58.33 | 33.14 | 0.66 |
| BE | 4.38 | 7.10 | 0.92 |
| SBC | 28.48 | 6.04 | 0.92 |

To understand how the selected variables are physiologically linked, we calculated their paired correlations between all pairs of variables. Fig. 2 shows the pairs of variables with a significant correlation score (rho <0.3 and P-value <.01). Interestingly, we found that potassium levels (K) and acidosis (PH) were closely associated, but not with other parameters related to renal failure. The correlation network shows consistency between acid base variables (PC02, SBC and BE). It also presents independent relationships in hemodynamics and blood cell series.
Low Mortality Rate Masks the Real Performance of the Prediction
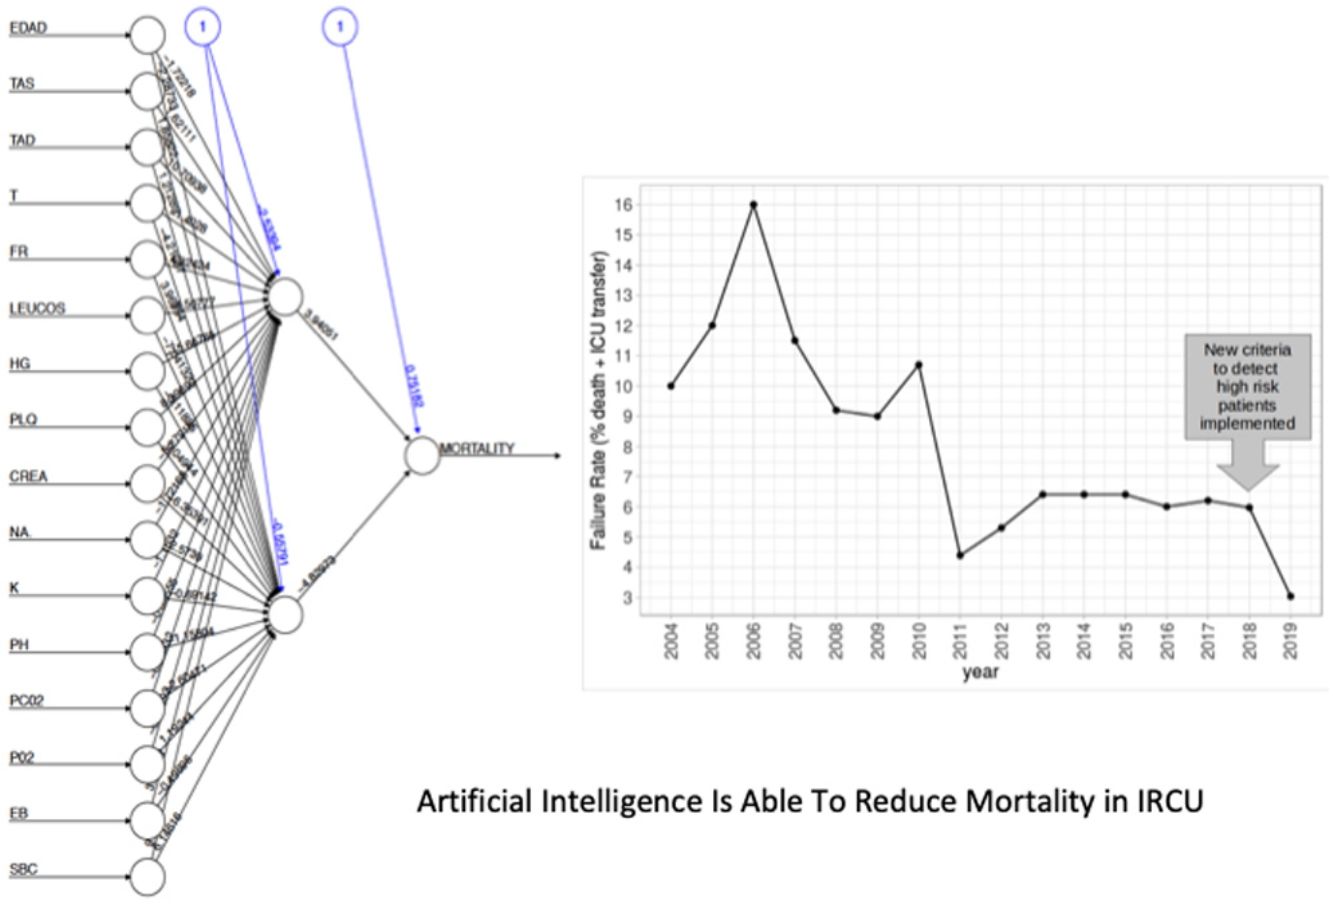
Our dataset has a mortality ratio below 2%. In Fig. 3 we show the performance of our NN algorithm over the dataset. Despite an acceptable area under the curve (AUC) and the extremely high accuracy value (0.98), it displays a very low specificity (0.5) which reflects that working with the whole dataset introduces a strong bias toward the learning of features that favor alive over death. In order to avoid the imbalanced class distribution bias, we introduced a re-sampling step (see Methods) where the dataset is down-sampled to have the same number of dead and alive events. Fig. 4A shows the NN performance over a set of re-sampled matrices that have a balanced class distribution. Although the behavior of the model in terms of accuracy does not improve the performance using the unbalanced dataset, we observe and increase in AUC (0.71), sensitivity (0.59) and specificity (0.59) values. This model was employed for further analysis.


The NN classification using the balanced data strategy shows that thrombocytopenia (PL), metabolic acidosis (SBC and PH), anemia (Hb), tachypnea (RR), age (AGE), sodium levels (NA), hypoxemia (PO2), leukocytopenia (LEUCOS), and hyperkalemia (K) are the most relevant parameters associated with mortality (Fig. 4B). The combination of these parameters reflects potential respiratory sepsis associated with hypoxemia and secondary pancytopenia or a primary oncohaemathologic disorder with associated septic respiratory distress. These results agree with our own experience when we have reviewed our IRCU's behavior in previous years.
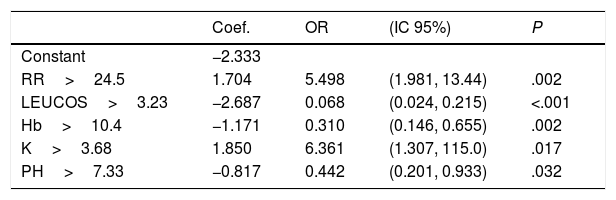
Rapid Decisions Based on Parameters’ Cut-off ValuesIn order to provide a complementary decision tool for risk prediction, we calculated the cut-off value (Youden J index) that best discriminated between dead and alive cases for every variable considered in the NN model (Supplementary Table 1) and a univariate logistic regression models was performed (Supplementary Table 2). We observed that from the top 10 variables most weighted in the NN model, six were a P-value <.05 and eight <0.1. In a multivariate logistic regression analysis, we found RR, LEUCOS, Hb, K and PH as the best combination of variables that best discriminate between classes (Table 3). This whole set of predictors is also found amongst the top 10 variables when sorted by importance in the NN model, again suggesting an overlapping signal coming from independent methods. The AUC for the logistic model was 0.75 (Fig. 5), and the bootstrap internal validation indicated an optimism of 0.016, which reflects the robustness of the model.
Multivariate Logistic Regression Model. Hosmer and Lemeshow Test: Chi-square=4.008, df=8, P=.856.
| Coef. | OR | (IC 95%) | P | |
|---|---|---|---|---|
| Constant | −2.333 | |||
| RR>24.5 | 1.704 | 5.498 | (1.981, 13.44) | .002 |
| LEUCOS>3.23 | −2.687 | 0.068 | (0.024, 0.215) | <.001 |
| Hb>10.4 | −1.171 | 0.310 | (0.146, 0.655) | .002 |
| K>3.68 | 1.850 | 6.361 | (1.307, 115.0) | .017 |
| PH>7.33 | −0.817 | 0.442 | (0.201, 0.933) | .032 |

By combining both analyses, we built a decision algorithm based on the variable classification provided. In order of importance the algorithm ranks the variables as: (1) PL<266, (2) SBC<26.4, (3) PH<7.33, (4) Hb<10.4, (5) RR>24.5, (6) age>63, (7) NA>140, (8) P02<68mm, (9) LEUCOS<3.230, and (10) K>3.68.
The new criteria for identification of high risk patients consider the following decisions: (1) Patients with more than 63 years, more than two cytopenias, metabolic acidosis, hypoxemia and hypernatremia with a background of infectious disease received a vigorous antibiotic treatment, and early and aggressive resuscitation of hemodynamic, respiratory and internal environment at the time of arrival regardless of the location of the patient before entering the unit. Management then would be the same but with precocity, on arrival (2) Patients with hypoxemia and metabolic acidosis received enhanced high-flow oxygen therapy either tan NIV immediately after admission in the emergency department to improve their P02/FI02>150mmHg after one hour. Metabolic acidosis was urgently counterbalanced with bicarbonates and/or haemodinamic early ressucitation procedures. If they failed to achieve this oxygenation in one hour they should be referred to the intensive care unit. (3) Oncohematological patients who met 80% or more of the criteria and for which we were consulted, were advised to enter directly into the intensive care unit for invasive management.
The New Patient Stratification Criteria Reduces Mortality in Our IRCUThe algorithm was implemented in our IRCU from October 2018 to September 2019 (230 patients, features shown in Supplementary Tables 3 and 4). In September 2019 we retrospectively analyzed this cohort. A total of 23 patients received vigorous treatment (decision 1), one of them not recovering and transferred to the ICU surviving. Decision 2 was applied to 33 patients, no patient required transfer to the ICU and there was no deceased. Five patients were subject of decision 3 and 1 was referred to the ICU in such conditions and survived. In total, 61 patients of the cohort were handled differently from how we previously did (26.52%).
In this second cohort we had 3 deceased and a mortality rate of 1.30%. The previous historical average being 1.68% (33patients), which shows more than a 20% of decrease (50% considering only last 7 years). In a wider perspective, the rate of failures (deaths and transfers to ICU) after the algorithm implementation was 3.0% (4 transfers, 3 of them for reasons related to the NN variables selected and the fourth due to refractory hypercapnic ventilatory failure). In order to compare this ratio with the whole series and avoiding the time bias we used Poisson regression models to calculate the annual trend of failure risk in the two periods. The relative risks (RR) were 0.94 and 0.41 from 2004–2017 and 2018–2019 respectively. Both RR being statistically different (Wald test, P-value=.065), see Fig. 6 to see global trend over the years.
Discussion
Big Data is producing a revolution in the management of patients in hospitals and machine-learning methods have been applied to different diseases and conditions.26–30 In this sense, ICUs have a long term experience in the analysis of mortality-related factors31–34 that have been historically applied also to IRCUs. However, IRCUs have their own specific features, being by definition very inclusive and have criteria, qualities and peculiarities that differ even between centers. Thus, it is difficult to generalize a criteria, as mortality prediction parameters are unit-specific, illustrating the need to personalize the model. Still, a common challenge faced by IRCUs is that mortality is usually much lower than survival as compared to ICUs.35–37 However, merging cohorts in order to rise up the number of failure events is not a solution as the results will not be suitable to any of the hospitals if essential differences exist between them. In any case, the variables and their range of values introduced in the machine learning algorithm must be carefully analyzed in order to avoid confounding factors. Other statistical limitations are applied here, for example Youden index might be calculating cut off points below detection threshold. Also, machine learning methods usually need complete data matrices, so imputation methods must be carefully applied in order to reduce statistical noise.
With these aspects in mind, here we present a machine learning model prepared to deal with misbalanced outcomes, that can be applied to any IRCU giving custom predictions of mortality important factors. For our unit we scored an AUC of 0.71 and 0.75 (NN and multivariate logistic regression models respectively) that are comparable or higher to those described previously.35 The NN results were confirmed by the multivariate regression analysis that also added the cutoffs values for decision making that we included in the final protocol for our IRCU patient management.
In general terms, our study indicates that the factors most related to survival are those associated with hypoxemic respiratory sepsis and secondary pancytopenia or a primary oncohaemathologic disorder with septic respiratory distress, followed by other factors related to respiratory status (hypercapnia), another organ failure (renal failure) or hemodynamic impairment. These results indeed differ from similar studies made in other ICUs38–40 where the seven most important features identified were a cumulative sum of urine output, mean, last, minimum and maximum values of BUN, mean value of HCO3 and age. This discrepancy illustrates the differences between IRCUs and ICUs.
Our final criteria (Table 3) is closely associated with sepsis. Tachypnea (RR>24.5) is universally related with ARF and/or metabolic acidosis, whilst acidosis or potassium levels >3.68 are frequently related to renal failure in these patients (no toxic intake of potassium or medications able to increase these levels were detected). A network correlation analysis (Fig. 2) gave us the variables dependencies, being hyperkaliemia correlated with acidosis and hemoglobin related to the patient's respiratory status. Leucocytes and platelets are independently and mutually related confirming our observation in patients with severe sepsis associated with bone marrow depression, in primary haematologic malignancies or in onco-haematologic patients receiving cytostatic treatments. High sodium levels may reflect a septic instead of a cardiogenic status.
Our results lead to an interesting interpretation: patients with respiratory sepsis, hypoxemia and secondary haematologic disorders or primary onco-haematologic patients suffering from respiratory failure, must be promptly redirected to the Intensive Care Unit for rigorous management in case of poor initial progress. In any case, priority surveillance must be implemented first for this subgroup of patients followed by those patients presenting factors related to hypercapnic respiratory status, renal failure or hemodynamic impairment.
We show here that the development of a reliable risk-stratification tool in the IRCU is feasible. We have generated a neural network capable of identifying and classifying mortality predictors in the IRCU of a general hospital. When combined with multivariate regression analysis, it has provided us with an extremely useful tool for the real-time monitoring of patients in order to detect specific mortality risks. Our model is supported by a drastic decrease in IRCU failure during the first year of implementation. In addition, our approach has the advantage of being able to improve its performance in the future with the addition of more patients to the cohort. The overall algorithm can be scaled to any type of unit in the world offering personalized results adapted to the particular environment of the unit analyzed.
Ethics Approval and Consent to ParticipateThe survey is a retrospective study with de-identified medical record data. No patients management protocols have been altered due to the study. The study was evaluated by our Ethics Committee (act n° 10/19) and approved with n° EO104-19_FJD.
FundingThe study has no specific funding. ASO has a Marie Sklodowska-Curie grant (#796721). PM has a Miguel Servet contract funded by the ISCIII (CP16/00116).
Author ContributionsSHF contributed to the conception and design of the work, did the acquisition, analysis, interpretation of data and wrote the manuscript; PM designed the NN algorithm, performed the analysis and wrote the manuscript; IMF performed the statistical analysis; LJH did a critical revision of intellectual content and language editing; ASO, DH, MPCM and IFO contributed with a critical revision of intellectual content; LAS, ANP, NGM and GPBR critically revised and drafted final manuscript. All authors approved the final version of the manuscript.
Conflict of InterestsThe authors declare no conflict of interest.
The authors thank the subjects who participated in the study, and the Jiménez Díaz Foundation University Hospital CEO and hospital board directors, the FJD-IIS and the Quality & Innovation Department.
Availability of data and material. The datasets analysed during the current study are available from the corresponding author on reasonable request.
The following are the supplementary data to this article:


