


Pleural effusion occurs as a response of the pleura to aggressions. The pleura reacts differently according to the type of injury. However, pleural reactions have not yet been characterized. The objective of this study was to identify homogeneous clusters of patients based on the analytical characteristics of their pleural fluid and identify pleural response patterns.
MethodsA prospective study was conducted of consecutive patients seen in our unit for pleural effusion. Principal component and cluster analyses were carried out to identify pleural response patterns based on a combination of pleural fluid biomarkers.
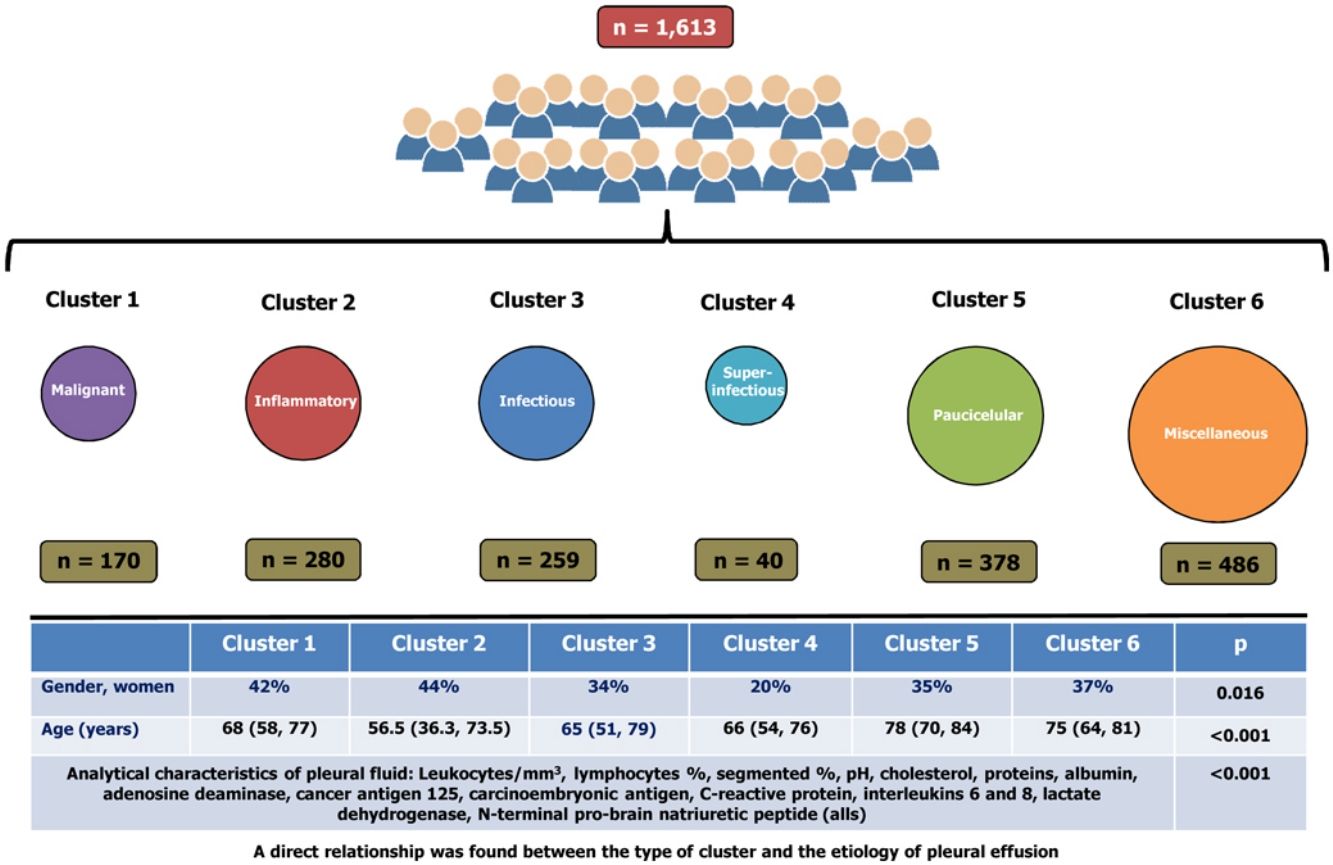
ResultsA total of 1613 patients were grouped into six clusters, namely: cluster 1 (10.5% of the cohort, primarily composed of patients with malignant pleural effusions); cluster 2 (17.4%, pleural effusions with inflammatory biomarkers); cluster 3 (16.1%, primarily composed of patients with infectious pleural effusions); cluster 4 (2.5%, a subcluster of cluster 3, superinfectious effusions); cluster 5 (23.4%, paucicellular pleural effusions); and cluster 6 (30.1%, miscellaneous). Significant differences were observed across clusters in terms of the analytical characteristics of PF (p<0.001 for all), age (p<0.001), and gender (p=0.016). A direct relationship was found between the type of cluster and the etiology of pleural effusion.
ConclusionPleural response is heterogeneous. The pleura may respond differently to the same etiology or similarly to different etiologies, which hinders diagnosis of pleural effusion.
El derrame pleural ocurre como una respuesta de la pleura a las agresiones. La pleura reacciona de manera diferente según el tipo de lesión. Sin embargo, las reacciones pleurales aún no se han clasificado. El objetivo de este estudio fue identificar grupos homogéneos de pacientes basados en las características analíticas de su líquido pleural e identificar patrones de respuesta pleural.
MétodosSe realizó un estudio prospectivo de pacientes consecutivos ingresados en nuestra unidad por presentar derrame pleural. Se llevaron a cabo análisis de componentes principales y análisis de conglomerados para identificar los patrones de respuesta pleural basados en las combinaciones de biomarcadores del líquido pleural.
ResultadosUn total de 1.613 pacientes se agruparon en 6 grupos: conglomerado 1 (10,5% de la cohorte, compuesto principalmente por pacientes con derrames pleurales malignos); conglomerado 2 (17,4%, derrames pleurales con biomarcadores inflamatorios); conglomerado 3 (16,1%, compuesto principalmente por pacientes con derrames pleurales infecciosos); conglomerado 4 (2,5%, un subgrupo del conglomerado 3, derrames superinfecciosos); conglomerado 5 (23,4%, derrames pleurales paucicelulares), y el conglomerado 6 (30,1%, miscelánea). Se observaron diferencias significativas entre los grupos en las características analíticas del líquido pleural (p < 0,001 para todos), la edad (p < 0,001) y el género (p = 0,016). Se encontró una relación directa entre el tipo de conglomerado y la etiología del derrame pleural.
ConclusionesLa respuesta pleural es heterogénea. La pleura puede responder de manera diferente a una misma etiología o de manera similar en diferentes etiologías, lo que dificulta el diagnóstico de derrame pleural.
Pleural effusion (PE) is a common condition, with an incidence of 400 cases/100,000 population/years in Spain1 and 1.5 million of patients each year in United States,2 with about 60 possible etiologies.1,3–5 PE is a response of the pleura to specific insults (local, pulmonary or systemic). The characteristics of the PE vary with the underlying physiopathological mechanism, the etiology (local or systemic) of the disease, and a variety of factors including, but not limited to, the type of PE (acute or chronic), and previous use of medicines (diuretics, antibiotics, among other). However, pleural response patterns have not yet been associated with the cause of PE.
The analysis of pleural fluid (PF) may have diagnostic potential and be useful to determine the etiology of pleural effusion.6 Diagnosis of PE is generally based on biochemical parameters in PF as measured individually.7–18 However, this approach does not account for the fact the pleura may respond differently to the same insult, and PEs of the same etiology may show a different biochemistry. Combined models of analytical parameters have been documented to have a high discrimination power for PEs.19–22 This model may help identify pleural response patterns associated with the etiology of the disease. Cluster analysis has been used to identify subtypes or phenotypes of patients diagnosed with a specific respiratory disease such as asthma, chronic obstructive pulmonary disease, or obstructive sleep apnea hypopnea syndrome.23–25 Therefore, clustering can also be useful in PE.
The objective of this study was to create homogeneous groups of patients according to the analytic characteristics of their PF by the use of principal component and cluster analysis. This study will enable us to identify pleural response patterns and/or the underlying etiopathogenic mechanism of the disease.
Materials and methodsWe prospectively studied all consecutive patients with PE seen in our center between January 1, 2011 and December 31, 2017. The protocol is an extension of the study evaluated and approved by the Clinical Research Ethics Committee of Galicia (Registry 2010/378).
Pleural fluid samples were taken by thoracentesis prior to any treatment. All patients signed an informed consent before any procedure was performed (chest CT-scan with contrast, thoracentesis, pleural biopsy or thoracoscopy).
PEs were studied according to our local standard protocol. PF samples were sent to microbiology (for Ziehl-Neelsen staining and cultures in aerobic, anaerobic and Löwenstein media), cytology and biochemistry. Aliquots of PF were centrifuged immediately for 15min at 1500×g, and the supernatants were stored at −80°C. All biochemistry determinations were performed using standard commercially available methods. A predefined algorithm (Fig. 1) was followed in all cases to establish the diagnosis. Video-assisted thoracic surgery was performed using a standard technique.26 All thoracenteses and biopsies were performed by experienced pulmonologists. In patients who underwent more than a thoracentesis, only the first PF chemistry panel was used for statistical analysis.

Definitions for malignant, paramalignant, tuberculous and infectious (including non-complicated, complicated and empyemas) PEs, as well as PE associated with heart failure and other diseases are provided in the Online data supplement.1,27–29 The clinical, radiological, and analytical parameters measured in PF and in blood are also described in the Online data supplement.
Statistical analysisFirst, principal component analysis (PCA) was performed to reduce the dimensions of the data set30 based on selected features [restricted to PF parameters: leukocytes, lymphocytes, neutrophils, pH, cholesterol, proteins, albumin, lactate dehydrogenase (LDH), adenosine desaminase (ADA), interleukin-6 (IL-6), IL-8, C-reactive protein (CRP), carcinoembryonic antigen (CEA), cancer antigen 125 (CA 125), N-terminal pro-brain natriuretic peptide (NT-proBNP), and gradient albumin serum-PF (Alb S-PF)]. PCA was performed on standardized or log-transformed values, depending on normality of distribution. Then the first four dimensions were used for clustering to identify PE patterns that would define subsets of patients. Homogeneous clusters of patients were created based on PEs with similar analytical characteristics. Hierarchical clustering was performed based on Euclidean distance as the similarity measure and the K-means approach.
The optimal number of clusters was determined by using a combination of the 30 tests run in the R function NbClust,31 where the peak number of clusters across tests was used. Finally, the clinical and biological characteristics of clusters were compared to characterize their clinical significance.
Descriptive results are presented as percentages for categorical data and as median values (interquartile range) for continuous variables. Comparisons between groups for continuous data were conducted using one-way analysis of variance or Kruskal–Wallis tests. Categorical data were compared using the chi-square test.
R statistical software (3.5.1) was used for principal component and cluster-based analyses and visualizations (FactoMineR, NbClust, cluster, and ggplot2 packages).
ResultsThe flowchart of patients is shown in Fig. 2. The initial data set corresponded to 2515 subjects whose ages ranged from 15 to 93 years. After subjects with missing data were excluded, the final sample was composed of 1613 patients. The etiologies and origin of metastatic PEs of patients included in the final sample are displayed in Table 1. Demographic data for the cohort are shown in Table 2.

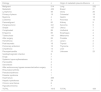
Etiology of pleural effusions and origin of metastatic pleural effusions.
| Etiology | n | Origin of metastatic pleural effusions | n |
|---|---|---|---|
| Malignant | 514 | Lung | 232 |
| Metastatic | 439 | Breast | 61 |
| Lymphoma | 49 | Ovary | 26 |
| Primary of pleura | 19 | Colorectal | 18 |
| Myeloma | 4 | Gastric | 18 |
| Leukemia | 3 | Pancreas | 10 |
| Paramalignant | 60 | Kidney | 9 |
| Parapneumonic | 341 | Sarcoma | 9 |
| Simple | 167 | Uterus | 7 |
| Complicated | 89 | Urothelial | 6 |
| Empyema | 85 | Esophagus | 4 |
| Tuberculosis | 141 | Melanoma | 4 |
| After surgery | 26 | Prostate | 4 |
| Hemothorax | 21 | Larynx | 3 |
| Post-traumatic | 18 | Thyroid | 2 |
| Pulmonary embolism | 16 | Thymoma | 2 |
| Chylothorax | 14 | Liver | 1 |
| Pleuropericarditis | 10 | Unknown | 23 |
| Subdiaphragmatic infection | 8 | ||
| Drugs | 7 | ||
| Systemic lupus erythematosus | 5 | ||
| Pancreatitis | 4 | ||
| Sarcoidosis | 3 | ||
| After aortocoronary bypass revascularization surgery | 3 | ||
| Rheumatoid arthritis | 2 | ||
| Pseudochylothorax | 1 | ||
| Dressler syndrome | 1 | ||
| Heart failure | 369 | ||
| Hepatic hydrothorax | 34 | ||
| Chronic renal failure | 8 | ||
| Hypoalbuminemia | 7 | ||
| TOTAL | 1613 | TOTAL | 439 |
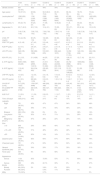
Demographic and clinical characteristics of patients.
| Total (n=1613) | Cluster 1 (n=170) | Cluster 2 (n=280) | Cluster 3 (n=259) | Cluster 4 (n=40) | Cluster 5 (n=378) | Cluster 6 (n=486) | |
|---|---|---|---|---|---|---|---|
| Gender, women | 601 (37.3%) | 42% | 44% | 34% | 20% | 35% | 37% |
| Age (years) | 72 (57, 81) | 68 (58, 77) | 56.5 (36.3, 73.5) | 65 (51, 79) | 66 (54, 76) | 78 (70, 84) | 75 (64, 81) |
| Leukocytes/mm3 | 1580 (650, 3510) | 1740 (1005, 3220) | 2395 (1290, 4465) | 3680 (1450, 9900) | 87,900 (23,655, 146,250) | 570 (278, 1200) | 1450 (650, 2778) |
| Lymphocytes, % | 45 (22, 70) | 40 (24, 57) | 71 (48, 85) | 12 (6,22) | 11 (8, 20) | 40 (23, 63) | 60 (42, 75) |
| Segmented, % | 20 (7, 40.5) | 20 (7, 30) | 10 (4, 21) | 70 (55, 83) | 79.5 (71, 87.5) | 20 (9, 34) | 12 (5, 23) |
| pH | 7.40 (7.36, 7.45) | 7.39 (7.32, 7.42) | 7.39 (7.36, 7.42) | 7.34 (7.14, 7.40) | 7.00 (6.32, 7.18) | 7.42 (7.39, 7.50) | 7.42 (7.38, 7.47) |
| CHOL PF (mg/dL) | 70 (44, 95) | 96 (78, 116) | 104 (89, 119) | 80 (60, 97) | 64.5 (34, 88.5) | 31 (22, 41) | 69 (56, 83) |
| PROT PF (g/dL) | 4 (3, 4.8) | 4.7 (4.2, 5.1) | 5.2 (4.8, 5.5) | 4.4 (3.7, 4.8) | 4.2 (3.1, 4.9) | 2.2 (1.8, 2.6) | 3.9 (3.5, 4.4) |
| ALB PF (g/dL) | 2.2 (1.6, 2.8) | 2.8 (2.4, 3.1) | 2.9 (2.7, 3.2) | 2.3 (1.9, 2.6) | 2.1 (1.4, 2.4) | 1.2 (0.8, 1.5) | 2.2 (1.9, 2.6) |
| LDH PF (UI/L) | 348 (185, 744) | 596 (362, 1029) | 518 (331, 878) | 896 (440, 1873) | 12,050 (7158, 17,701) | 146 (103, 208) | 284 (188, 446) |
| ADA PF (U/L) | 21 (13.3, 31.5) | 21 (1426) | 44 (25, 91) | 27 (20, 39) | 128 (31, 189) | 12 (7, 16) | 20 (15.1, 26) |
| IL-6 PF (pg/mL) | 6350 (1800, 29,228) | 6505 (2950, 13,010) | 21,613 (6404, 51,230) | 70,393 (24,530, 200,100) | 33,702 (5586, 138,075) | 1658 (652, 3810) | 4202 (1448, 9929) |
| IL-8 PF (pg/mL) | 119 (43, 433) | 204 (104, 450) | 235 (83, 639) | 537 (118, 3914) | 73,707 (13,589, 198,825) | 51 (28, 98) | 77 (35, 218) |
| CRP PF (mg/dL) | 1.8 (0.6, 4.7) | 1.2 (0.6, 2.2) | 3.4 (1.8, 6.2) | 7.3 (4.5, 10.6) | 6.8 (3.3, 11.5) | 0.6 (0.2, 1.6) | 1.2 (0.6, 2.9) |
| CEA PF (ng/mL) | 1.2 (0.5, 3.6) | 265 (60, 1123) | 0.9 (0.5, 1.8) | 1 (0.5, 1.9) | 1.8 (0.7, 4.4) | 0.7 (0.5, 1.4) | 1.6 (0.6, 4.7) |
| CA125 PF (U/mL) | 517 (278, 1025) | 1709 (767, 3948) | 446 (202, 789) | 393 (208, 750) | 153 (43, 524) | 501 (313, 832) | 543 (320, 1071) |
| NT-proBNP PF (pg/mL) | 780 (281, 2168) | 282 (109, 673) | 394 (127, 780) | 680 (320, 1100) | 466 (17, 880) | 4134 (1524, 9757) | 806 (343, 1675) |
| ALB S-LP | 1.3 (0.9, 1.9) | 1.1 (0.8, 1.4) | 0.8 (0.5, 1.1) | 1.1 (0.7, 1.4) | 1 (0.5, 1.9) | 2.3 (1.8, 2.7) | 1.4 (1.1, 1.7) |
| Time >30 days* | 338 (21%) | 39% | 21% | 6% | 15% | 14% | 29% |
| Laterality | |||||||
| Right | 731 (45.3%) | 45% | 47% | 47% | 54% | 39% | 48% |
| Left | 592 (36.7%) | 39% | 47% | 44% | 46% | 23% | 36% |
| Bilateral | 290 (18%) | 16% | 6% | 9% | 38% | 16% | |
| Lung lesion (yes) | 733 (45.4%) | 50% | 41% | 71% | 75% | 29% | 43% |
| Malignancy (Rx/CT) | 585 (36.3%) | 87% | 26% | 22% | 25% | 14% | 50% |
| Size | |||||||
| <1/3 | 636 (39.4%) | 29% | 38% | 40% | 15% | 48% | 39% |
| >1/3–<2/3 | 738 (45.8%) | 51% | 48% | 46% | 48% | 41% | 46% |
| >2/3 | 238 (14.8%) | 20% | 14% | 14% | 37% | 11% | 15% |
| Dyspnea (yes) | 1230 (76.3%) | 82% | 60% | 67% | 80% | 88% | 79% |
| Chest pain (yes) | 751 (46.6%) | 47% | 63% | 65% | 63% | 24% | 43% |
| General syndrome (yes) | 442 (27.4%) | 54% | 29% | 17% | 30% | 16% | 31% |
| Fever (yes) | 494 (30.6%) | 6% | 45% | 58% | 65% | 20% | 22% |
| Appearance | |||||||
| Serous | 1104 (68.4%) | 50% | 72.9% | 53% | 7% | 90% | 68% |
| Serous-bloody | 390 (24.2%) | 48% | 22.1% | 30% | 8% | 9% | 27% |
| Bloody | 46 (2.9%) | 2% | 3.6% | 6% | 20% | 2% | |
| Purulent | 58 (3.6%) | 0.4% | 11% | 65% | 1% | ||
| Milky | 15 (0.9%) | 0.7% | 3% | ||||
ADA, adenosine deaminase; ALB, albumin; CA125, cancer antigen 125; CEA, carcinoembryonic antigen; CHOL, cholesterol; CRP, C-reactive protein; CT, computed tomography; IL, interleukin; LDH, lactate dehydrogenase; NT-proBNP, N-terminal pro-brain natriuretic peptide; PF, pleural fluid; PROT, proteins; Rx, radiography; S, serum.
The percentages of variability explained by each dimension were 24.4% for the first axis, 17.7% for the second, 9.3% for the third, and 7.5% for the fourth one. The contribution of analytical parameters in PF to the first four dimensions is shown in Fig. 3.

The optimal number of clusters identified was six. Fig. 4(A–F) shows a biplot that displays the relationships between the variables (arrows) used for building clusters and patients (dots) based on their individual analytical PF characteristics. Results are projected onto the first four dimensions yielded by PCA. Colors correspond to the six groups obtained from clustering, showing the classification of patients based on their analytical PF characteristics.
 used for clustering. Distribution of patients (dots) based on the individual analytical characteristics of their pleural fluid. Results are projected onto the first four dimensions yielded by principal component analysis. Colors for observations correspond to the six clusters obtained from cluster analysis. Figures A–F. Combinations of the four dimensions taken two by two. 1, cluster 1; 2, cluster 2; 3, cluster 3; 4, cluster 4; 5, cluster 5; 6, cluster 6. Dim, dimension. ADAPF, adenosine deaminase pleural fluid; AlbPF, albumin pleural fluid; AlbS-PF, albumin serum-pleural fluid gradient; CA125PF, cancer antigen 125 pleural fluid; CEAPF, carcinoembryonic antigen pleural fluid; CholPF, cholesterol pleural fluid; CRPPF, C-reactive protein pleural fluid; IL-6PF, interleukin 6 pleural fluid; IL-8PF, interleukin 8 pleural fluid; LDHPF, lactate dehydrogenase pleural fluid; Lym, lymphocytes; PBNPPF, N-terminal pro-brain natriuretic peptide; ProtPF, proteins pleural fluid; Seg, segmented.")
Biplot representation displaying relationships between the variables (arrows) used for clustering. Distribution of patients (dots) based on the individual analytical characteristics of their pleural fluid. Results are projected onto the first four dimensions yielded by principal component analysis. Colors for observations correspond to the six clusters obtained from cluster analysis. Figures A–F. Combinations of the four dimensions taken two by two.
1, cluster 1; 2, cluster 2; 3, cluster 3; 4, cluster 4; 5, cluster 5; 6, cluster 6. Dim, dimension.
ADAPF, adenosine deaminase pleural fluid; AlbPF, albumin pleural fluid; AlbS-PF, albumin serum-pleural fluid gradient; CA125PF, cancer antigen 125 pleural fluid; CEAPF, carcinoembryonic antigen pleural fluid; CholPF, cholesterol pleural fluid; CRPPF, C-reactive protein pleural fluid; IL-6PF, interleukin 6 pleural fluid; IL-8PF, interleukin 8 pleural fluid; LDHPF, lactate dehydrogenase pleural fluid; Lym, lymphocytes; PBNPPF, N-terminal pro-brain natriuretic peptide; ProtPF, proteins pleural fluid; Seg, segmented.
Significant differences were observed across the six clusters in terms of sex, age and analytical, radiological and clinical characteristics. Table 2 reports the values obtained for all parameters by cluster, with significant differences in all parameters (p=0.016 for gender and p<0.001 for the remainder of variables). Table 3 displays PEs in accordance with their etiology and the cluster in which the patient was included.
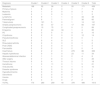
Classification of pleural effusions according to their etiology and the cluster they belong to.
| Diagnosis | Cluster 1 | Cluster 2 | Cluster 3 | Cluster 4 | Cluster 5 | Cluster 6 | Total |
|---|---|---|---|---|---|---|---|
| Metastatic | 168 | 52 | 26 | 2 | 20 | 171 | 439 |
| Primary of pleura | 1 | 8 | 2 | 0 | 1 | 7 | 19 |
| Myeloma | 0 | 1 | 0 | 0 | 0 | 3 | 4 |
| Leukemia | 0 | 1 | 0 | 0 | 1 | 1 | 3 |
| Lymphoma | 0 | 9 | 1 | 1 | 4 | 34 | 49 |
| Paramalignant | 0 | 9 | 7 | 1 | 7 | 36 | 60 |
| Tuberculosis | 0 | 121 | 5 | 0 | 1 | 14 | 141 |
| Simple parapneumonic | 0 | 33 | 57 | 0 | 17 | 60 | 167 |
| Complicated parapneumonic | 0 | 10 | 75 | 2 | 0 | 2 | 89 |
| Empyema | 0 | 2 | 44 | 34 | 1 | 4 | 85 |
| PE | 0 | 3 | 5 | 0 | 0 | 8 | 16 |
| Chylothorax | 0 | 2 | 0 | 0 | 0 | 12 | 14 |
| Pseudochylothorax | 0 | 1 | 0 | 0 | 0 | 0 | 1 |
| SLE | 0 | 0 | 4 | 0 | 0 | 1 | 5 |
| Rheumatoid arthritis | 0 | 2 | 0 | 0 | 0 | 0 | 2 |
| Post-CABG | 0 | 2 | 0 | 0 | 0 | 1 | 3 |
| Pancreatitis | 0 | 0 | 2 | 0 | 2 | 0 | 4 |
| Heart failure | 0 | 2 | 2 | 0 | 279 | 86 | 369 |
| Hepatic hydrothorax | 0 | 0 | 0 | 0 | 23 | 11 | 34 |
| Abscess/abdominal infection | 0 | 1 | 1 | 0 | 2 | 4 | 8 |
| After surgery | 0 | 7 | 9 | 0 | 1 | 9 | 26 |
| Thoracic trauma | 0 | 5 | 4 | 0 | 2 | 7 | 18 |
| Hemothorax | 1 | 3 | 11 | 0 | 1 | 5 | 21 |
| Viral pleuritis | 0 | 1 | 4 | 0 | 1 | 4 | 10 |
| Dressler syndrome | 0 | 0 | 0 | 0 | 0 | 1 | 1 |
| Hypoalbuminemia | 0 | 0 | 0 | 0 | 6 | 1 | 7 |
| Sarcoidosis | 0 | 2 | 0 | 0 | 0 | 0 | 2 |
| Uremia | 0 | 0 | 0 | 0 | 7 | 1 | 8 |
| Drugs | 0 | 3 | 0 | 0 | 2 | 2 | 7 |
| TOTAL | 170 | 280 | 259 | 40 | 378 | 486 | 1613 |
PE, Pulmonary embolism; SLE, systemic lupus erythematosus; Post-CABG, after aortocoronary bypass revascularization surgery.
Cluster 1 was composed of 170 patients (10.5%) and was the one with the highest CEA and CA125 values in PF (Table 2). In addition, this is the group with the highest number of patients who underwent puncture 30 days after the onset of symptoms (39%), with radiological signs of malignancy (87%) and general syndrome (54%) (Table 2). As many as 98.8% of cases (168/170) were metastatic (Table 3). This cluster includes neoplastic PEs.
Cluster 2In total, 17.4% of subjects (n=280) were grouped in cluster 2. This group of patients is characterized by a young age (<18 years), a higher lymphocyte percentage, and elevated protein and adenosine deaminase concentrations in PF (Table 2). CRP was also higher in this cluster as compared to clusters 1, 5 and 6. This cluster primarily consists of patients with tuberculous (121 patients, 43.2%), metastatic (52, 18.6%) and non-complicated parapneumonic (33, 11.8%) PEs (see Table 3). It is associated with inflammatory pleural response.
Cluster 3A total of 259 patients (16.1%) were included in this cluster, which is characterized by a high percentage of segmented neutrophils, high IL-6 and CRP levels, and low pH. Moreover, 71% of patients exhibited a pulmonary infiltrate on chest X-ray, and 58% had fever. These percentages are significantly different from those for other clusters, except for cluster 4 (Table 2). This cluster is composed of non-complicated (57 patients, 20.4%) and complicated (75, 29%) paraneumonic PEs, empyemas (44, 17%) and metastatic PEs (26, 10%) (Table 3) and includes infectious PEs.
Cluster 4Only 40 patients were included in this cluster (2.5%), which seems to be a subcluster of cluster 3. The percentage of women was lower in this group (20%), with higher leukocyte and neutrophil percentages, LDH, ADA and IL-8 levels that the other clusters. IL-6 and CRP values were also high, whereas pH values were the lowest of all clusters (Table 2). Moreover, this cluster was the one with the highest incidence of lung injury on chest X-ray (75%); PE >2/3 of the hemithorax (37%); fever (65%); and purulent PE (65%) (Table 2). Ninety percent (36/40) of patients in this cluster exhibited complicated PEs or empyemas (Table 3), which suggests that this cluster includes patient with severe infection.
Cluster 5This cluster was composed of 378 patients (23.4%). Patients in this cluster had an advanced age (78 years), and their leukocyte, cholesterol, total protein and albumin levels were the lowest of all clusters. In contrast, these patients showed the highest NT-proBNP values and Alb S-PF gradients (Table 2). This is the cluster with the highest incidence of bilateral PE (38%) and the lowest incidence of effusion in the left hemithorax (23%). These patients rarely had chest pain (24%), and most (90%) PEs had a serous appearance (Table 2). Patients in this cluster had heart failure (279; 73.8%), hepatic hydrothorax (23; 6.1%), metastasis (20; 5.3%), uremia (7; 1.9%) and hypoalbuminemia (6; 1.6%) (Table 3). This data is associated with paucicellular PE.
Cluster 6This group was composed of 486 patients (30.1%), who did not exhibit any relevant characteristic (Table 2). This cluster embraces patients with all-etiology PEs, with special relevance of PEs of metastatic origin (171 patients; 35.2%), heart failure (86; 17.7%), non-complicated parapneumonic (60; 12.3%), paramalignant PEs (36, 7.4%) or lymphomas (34, 7%) (Table 3).
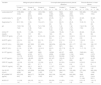
Significant differences were found among metastatic PEs in clusters 1, 2 and 6 in terms of lymphocyte percentage and cholesterol, total protein, albumin, CEA, CA125 and NT-proBNP levels (Table 4). PEs secondary to heart failure in cluster 6 differed from PEs of the same etiology in cluster 5 in higher cholesterol (55 vs. 29mg/dL), total protein (3.6 vs. 2.2g/dL) and albumin (2 vs. 1.2g/dL) levels, and lower ALB S-PE gradient (1.6 vs. 2.3) and NT-proBNP (2840 vs. 5042pg/mL) levels (Table 4). Relevant differences were also observed in non-complicated parapneumonic PEs from clusters 2, 3 and 6 in terms of leukocyte percentage/mm3, percentage of segmented neutrophils, cholesterol, total protein, albumin, IL-6, IL-8 and CRP levels in PF (Table 4). This cluster seems to encompass unclassifiable or miscellaneous PEs.
Analytical characteristics of malignant, uncomplicated parapneumonic pleural effusions and due to heart failure according to the cluster in which they were classified.
| Variable | Malignant pleural effusions | Uncomplicated parapneumonic pleural effusions | Pleural effusions in heart failure | |||||
|---|---|---|---|---|---|---|---|---|
| Cluster 1 (n=168) | Cluster 2 (n=52) | Cluster 6 (n=171) | Cluster 2 (n=33) | Cluster 3 (n=57) | Cluster 6 (n=60) | Cluster 5 (n=279) | Cluster 6 (n=86) | |
| Leukocytes/mm3 | 1735 (995, 3163) | 1325 (960, 2213) | 1610 (780, 2820) | 2420 (1365, 5990) | 5800 (2365, 10,300) | 1825 (858, 4755) | 530 (280, 1070) | 775 (458, 1553) |
| Lymphocytes, % | 40 (25, 57) | 65 (46, 77) | 63 (43, 76) | 45 (35, 65) | 14 (7, 23) | 49 (31, 70) | 43 (25, 65) | 60 (45, 74) |
| Segmented, % | 20 (7, 30) | 13 (8, 25) | 12 (4, 21) | 13 (6, 24) | 60 (51, 76) | 20 (8, 35) | 19 (8, 31) | 12 (3, 22) |
| pH | 7.39 (7.32, 7.42) | 7.39 (7.36, 7.42) | 7.41 (7.38, 7.46) | 7.40 (7.37, 7.43) | 7.40 (7.38, 7.43) | 7.42 (7.37, 7.50) | 7.43 (7.39, 7.50) | 7.42 (7.40, 7.47) |
| CHOL PF (mg/dL) | 96 (78, 116) | 111 (98, 127) | 72 (61, 85) | 114 (89, 126) | 79 (65, 95) | 71 (61, 88) | 29 (22, 38) | 55 (43, 68) |
| PROT PF (g/dL) | 4.7 (4.2, 5.1) | 5 (4.5, 5.5) | 4 (3.5, 4.5) | 5.2 (4.9, 5.6) | 4.1 (3.6, 4.7) | 3.9 (3.5, 4.3) | 2.2 (1.8, 2.6) | 3.6 (3.2, 4) |
| ALB PF (g/dL) | 2.8 (2.4, 3.1) | 2.9 (2.6, 3.2) | 2.2 (1.9, 2.6) | 2.9 (2.7, 3.3) | 2.2 (1.8, 2.5) | 2.2 (1.9, 2.5) | 1.2 (0.8, 1.5) | 2 (1.9, 2.4) |
| LDH PF (UI/L) | 599 (360, 1035) | 467 (290, 818) | 351 (230, 554) | 388 (234, 567) | 295 (234, 597) | 251 (177, 364) | 137 (102, 185) | 182 (127, 237) |
| ADA PF (U/L) | 21 (14, 26) | 27 (22, 34) | 19 (14.3, 25) | 29 (21, 35) | 23 (17.8, 27) | 23 (18, 29) | 11 (7, 15) | 17 (14, 21) |
| IL-6 PF (pg/mL) | 6377 (2880, 13,173) | 10,495 (4150, 20,507) | 5820 (2171, 10,661) | 18,584 (2299, 54,310) | 40,137 (15,364, 59,008) | 4299 (1152, 17,827) | 1549 (641, 3426) | 2971 (1372, 5608) |
| IL-8 PF (pg/mL) | 213 (104, 451) | 188 (93, 531) | 129 (50, 320) | 221 (67, 413) | 128 (41, 547) | 72 (37, 228) | 44 (27, 85) | 43 (25, 104) |
| CRP PF (mg/dL) | 1.2 (0.6, 2.2) | 2.3 (0.9, 4.9) | 1.2 (0.6, 2.7) | 4.4 (2, 7.7) | 6.5 (3.6, 8.8) | 2.4 (0.9, 4.9) | 0.5 (0.2, 1.5) | 0.9 (0.4, 2) |
| CEA PF (ng/mL) | 277 (64, 1135) | 3.8 (1, 17.9) | 6.6 (2, 48.4) | 1.1 (0.7, 1.5) | 1.3 (0.8, 1.9) | 1.1 (0.6, 2.3) | 0.7 (0.5, 1.3) | 0.9 (0.5, 1.6) |
| CA125 PF (U/mL) | 1708 (741, 4026) | 479 (236, 946) | 540 (296, 1125) | 470 (273, 715) | 464 (310, 794) | 720 (328, 1123) | 477 (308, 778) | 565 (358, 1128) |
| NT-proBNP PF (pg/mL) | 276 (106, 647) | 384 (177, 697) | 780 (256, 1150) | 630 (156, 810) | 740 (450, 1125) | 805 (560, 1105) | 5042 (2710, 11,156) | 2840 (1416, 5571) |
| ALB S-LP | 1.1 (0.8, 1.4) | 0.8 (0.5, 1) | 1.4 (1.1, 1.8) | 0.8 (0.6, 1.2) | 1.2 (0.9, 1.6) | 1.3 (1, 1.5) | 2.3 (1.8, 2.8) | 1.6 (1.2, 1.9) |
ADA, adenosine deaminase;ALB, albumin; CA125, cancer antigen 125; CEA, carcinoembryonic antigen; CHOL, cholesterol; CRP, C-reactive protein; CT, computed tomography; IL, interleukin; LDH, lactate dehydrogenase; NT-proBNP, N-terminal pro-brain natriuretic peptide; PF, pleural fluid; PROT, proteins; Rx, radiography; S, serum.
To the best of our knowledge, this is the first study to identify homogeneous groups of patients showing similar pleural response patterns based on the analytical characteristics of PF. The results obtained suggest that pleural response to aggressions is heterogeneous. On the one hand, pleural response to insults of the same etiology may vary (different clusters). On the other hand, pleural response to insults of different etiologies may be the same (same cluster).
In the last years, cluster-based analysis has been used to identify clusters of patients with other respiratory diseases based on shared clinical symptoms and phenotypes. Hence, five phenotypes of asthma were identified in a study based on level severity, with relevant differences among groups.23 In relation to COPD, five subgroups were established based on the clinical characteristics of patients (especially, severity of respiratory disease and presence of cardiovascular comorbidities and diabetes).24 A study in patients with obstructive sleep apnoea identified three groups of patients with different symptoms and comorbidities (sleep disorders, minimally symptomatic and daytime somnolence).25
PF accumulates in the pleural space by the action of different mechanisms.32 Pleural response varies according to the lung involved and the stimulus activated. Modification factors include time to thoracentesis, tumor load33 or previous use of drugs. We used biomarkers in PF to identify pleural response patterns, as they are the result of a process or disease, infection, cancer, or heart failure, and reflect the underlying physiopathological mechanism leading to PE. Combinations of six biomarkers were used to consider all factors that may be involved in a response without etiologies being identified. Diagnoses are generally based on critical and specific clinical and analytical findings. Clinically relevant data were obtained from clustering. Thus, a correlation was established between analytical PF parameters and the clinical characteristics of the patients who were more likely to be assigned to a specific cluster. Given a data set, each clustering algorithm can always generate a division, no matter whether the structure exists or not. To provide confidence for the clustering results derived from the algorithms used, we carried out an external evaluation based on patient's diagnosis and clinical data.
The six clusters identified represent pleural response patterns and classify them as neoplastic, inflammatory, infectious, superinfectious, paucicellular and miscellaneous (cluster 1–6, respectively). The results obtained are clinically relevant. PEs of the same etiology were not included in the same cluster. Thus, PEs of etiologies as disparate as pleural metastasis, non-complicated infection, or heart failure were included in six, four, and four different clusters, respectively (Table 3). Table 4 shows significant differences in analytical values for metastatic PEs across clusters 1, 2 and 6. The same occurred in non-complicated parapneumonic PEs across clusters 2, 3 and 6; and PEs caused for heart failure (cluster 5 and 6) (Table 4). These differences suggest that either, the underlying mechanism causing PE varies (i.e. in neoplastic PEs, the mechanism involved is not always the same), or the pattern of response (which are modulated by the modification factors described above) differs, which translates into a different modulation of PE biomarkers. The reason why pleural responds differently to insults of the same etiology is unknown. A reason might be that PE changes as the disease progresses, as it occurs with infectious PE. Another explanation may be that modification factors modulate biomarkers. The fact that PEs of the same etiology were categorized into different clusters indicates that an etiology cannot be ruled out based on a single parameter. Thus, a metastatic PE may show an inflammatory, infectious or paucicellular response pattern. Simple and complicated parapneumonic PEs may be lymphocyte-predominant. Heart-failure-associated PE may show high cholesterol, protein and albumin levels and lower NT-proBNP levels (cluster 6).
All clusters are composed of PEs of different etiologies (Table 3). Otherwise said, aggressions of different etiologies may induce a similar pleural response. No studies have been performed so far to explain this phenomenon. Finally, cluster 6 – a group composed of 486 patients (30% of the series) – included PEs of all etiologies and does not show any particular characteristic that may lead to a conclusive diagnosis (Table 2). This cluster includes patients of an advanced age (75 years), and it consists of patients with metastatic, paramalignant, and tuberculous PEs, lymphoma, heart failure or non-complicated infectious diseases that do not feature the characteristics commonly associated with these etiologies (Table 4). The non-specific pleural response exhibited by these patients suggests that several mechanisms may be involved in the production of PE, which would generate different pleural stimuli. Another explanation is that modification factors may modulate biomarkers. Whatever the cause is, this cluster illustrates the difficulties that physicians encounter in identifying the etiology of a PE.
Clinical or radiological characteristics were not considered for clustering, as the level of dyspnea, chest pain or PE size do not necessarily reflect a specific pleural response pattern. In contrast, the results obtained in this study support the identification of patient clusters based on biomarker analysis. Hence, time to thoracentesis was longer (39% after more than 30 days), the percentage of malignant lesions on imaging scans was higher (87%), and the proportion of patients with general syndrome was higher (54%) in cluster 1 (mostly, metastatic PEs). On the other hand, the percentage of patients with pulmonary lesions (71% and 75%, respectively) and high temperature (58% and 65%, respectively) was higher in clusters 3 and 4, which were primarily composed of infectious PEs. As many as 65% of PEs in cluster 4 were purulent. Finally, patients in cluster 5 – who prevailingly had heart failure – were the ones with a higher incidence of bilateral PE (38%) and a lower incidence of left-side PE (23%).
A limitation of this study is that patients were recruited from a single site. Therefore, the validity of this methodology in other sites needs to be confirmed. Although 312 patients were excluded for a potential double diagnosis, we cannot guarantee that all PEs were associated with a single etiology.
In conclusion, according to the analytical characteristics of the PF, six homogeneous groups of patients were identified that demonstrate that the pleural response to aggressions is heterogeneous: PEs of the same etiology show different response patterns, while PEs of different etiologies may show the same response pattern. This phenomenon illustrates the challenges faced when establishing a diagnosis in the presence of a PE. Further studies are required to better understand the modulating role of the cause of pleural effusion, identify the mechanisms that lead to the production of PE, and determine modification factors. Finally, further research should be conducted to elucidate the implications of the results of these studies in clinical practice.
FundingThis study was supported by an unrestricted grant by Laboratorios Menarini S.A.
Author's contributionLucía Ferreiro. Corresponding author. Author. Conception and design. Analysis and interpretation of data. Drafted the submitted article. Approval of the final version.
Óscar Lado-Baleato. Co-Author. Conception and design. Analysis and interpretation of data. Revised the article critically. Approval of the final version.
María E. Toubes. Co-Author. Acquisition of data. Analysis and interpretation of data. Revised the article critically. Approval of the final version.
Juan Suárez-Antelo. Co-Author. Acquisition of data. Revised the article critically. Approval of the final version.
Antonio Pose-Reino. Co-Author. Acquisition of data. Revised the article critically. Approval of the final version.
Esther San José. Co-Author. Acquisition of data. Revised the article critically. Approval of the final version.
Adriana Lama. Co-Author. Acquisition of data. Revised the article critically. Approval of the final version.
Nuria Rodríguez-Núñez. Co-Author. Acquisition of data. Revised the article critically. Approval of the final version.
José Manuel Álvarez Dobaño. Co-Author. Acquisition of data. Revised the article critically. Approval of the final version.
Francisco Javier González Barcala. Co-Author. Acquisition of data. Revised the article critically. Approval of the final version.
Jorge Ricoy. Co-Author. Acquisition of data. Revised the article critically. Approval of the final version.
Francisco Gude. Co-Author. Conception and design. Analysis and interpretation of data. Revised the article critically. Approval of the final version.
Luis Valdés. Author. Guarantor. Conception and design. Analysis and interpretation of data. Drafted the submitted article. Approval of the final version.
Conflict of interestsThe authors declare that they have no conflicts of interest.
The following are the supplementary data to this article:


