


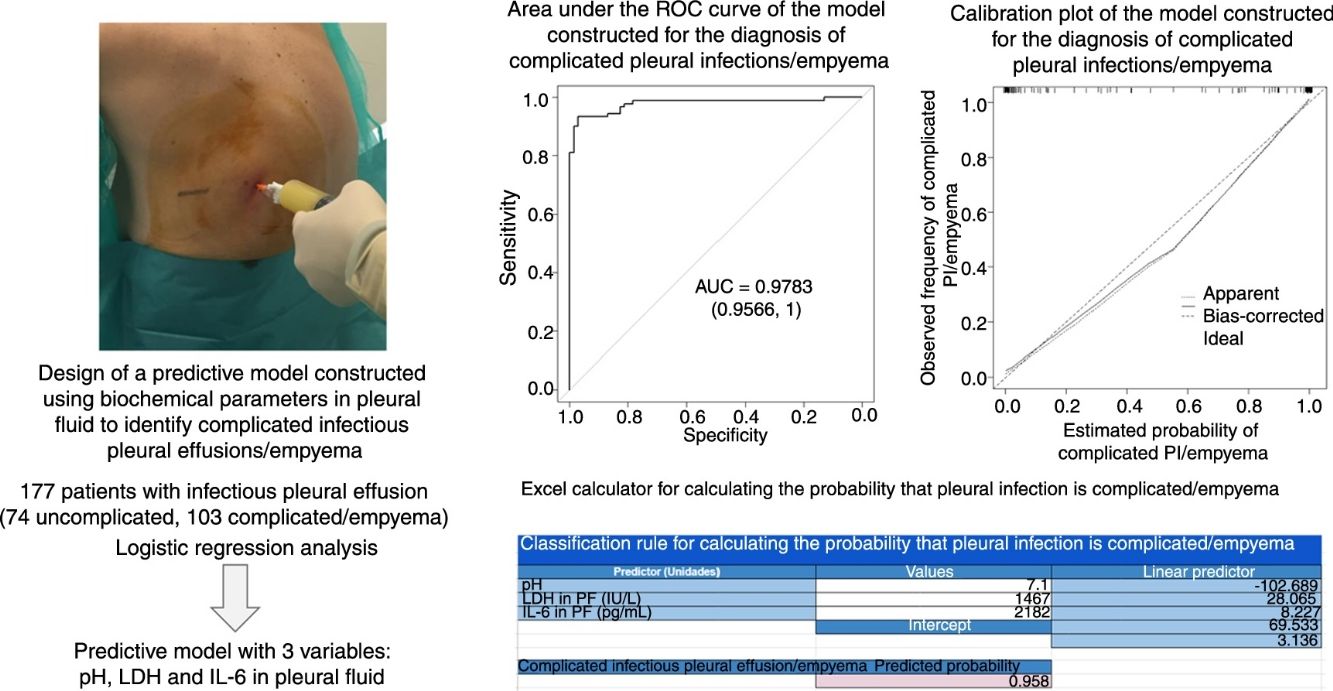
Identifying infectious pleural effusions (IPE) that will progress to complicated infection or empyema is challenging. The purpose of this study was to determine whether a model based on multiple biochemical parameters in pleural fluid can predict which IPEs will produce empyema.
MethodsA prospective study was performed of all cases of IPEs treated in our unit. IPEs were classified as uncomplicated or complicated (empyema). Logistic regression was used to estimate the risk for complicated pleural infection (empyema). A predictive model was developed using biochemical parameters in pleural fluid. Discriminatory power (areas under the ROC curve), calibration, and diagnostic accuracy of the model were assessed.
ResultsA total of 177 patients were included in the study (74 with uncomplicated infectious pleural effusion, and 103 with complicated pleural effusion/empyema). The area under the curve (AUC) for the model (pH, lactate dehydrogenase and interleukin 6) was 0.9783, which is significantly superior to the AUC of the individual biochemical parameters alone (0.921, 0.949, and 0.837, respectively; P<.001 using all parameters). The rate of correct classification of infectious pleural effusions was 96% [170/177: 72/74 (97.3%) for uncomplicated and 98/103 (95.1%) for complicated effusion (empyema)].
ConclusionThe multiple-marker model showed better diagnostic performance for predicting complicated infectious pleural effusion (empyema) compared to individual parameters alone.
Predecir cuándo un derrame pleural infeccioso puede evolucionar hacia una infección complicada/empiema es difícil de establecer. Nuestro propósito es analizar si un modelo predictivo construido con parámetros bioquímicos del líquido pleural puede ayudar a identificar estos derrames.
MétodosSe estudió de forma prospectiva a todos los pacientes diagnosticados de derrame pleural infeccioso y se clasificaron en no complicados y complicados/empiemas. Se realizó un análisis de regresión logística para estimar la probabilidad de infección pleural complicada/empiema. Con base en parámetros bioquímicos del líquido pleural, se construyó un modelo predictivo y se determinaron su discriminación (áreas bajo la curva ROC), calibración y precisión diagnóstica.
ResultadosSe incluyó a 177 pacientes (74 infecciones pleurales no complicadas y 103 complicadas/empiemas). El área bajo la curva del modelo construido (pH, lactato deshidrogenasa e interleucina 6) fue 0,9783, significativamente mejor que cualquiera de las variables bioquímicas utilizadas de forma individual (0,921, 0,949 y 0,837, respectivamente; p<0,001 usando todos los parámetros). La tasa de clasificación correcta fue del 96% de los derrames (170/177; 72/74 [97,3%] de los no complicados y 98/103 [95,1%] de los complicados/empiemas).
ConclusiónEl modelo predictivo analizado tiene una buena rentabilidad para el diagnóstico de las infecciones pleurales complicadas/empiemas, superior a la de cualquiera de las variables individuales que lo componen.
Pleural infection (PI) is a common finding in clinical practice, as 57% of patients with pneumonia can develop infectious pleural effusion (IPE).1 In the initial (exudative) phase, pleural fluid (PF) shows characteristics of neutrophilic exudate with no other distinguishing biochemical data; the yield from culture is generally low; and response to antibiotic treatment is usually favorable.2 In recent years, however, increasing numbers of patients are developing complicated PI/empyema, especially children and the elderly.3,4 These patients will require antibiotics and chest tube drainage, and occasionally, intrapleural fibrinolytics and surgical management.2 As a result, hospitalization rates for empyema are higher,3 hospital stays are longer,5 and mortality rates can be as high as 30% in immunocompromised patients.3,5,6
The biochemical characteristics of PF in the fibrinopurulent and organizing phases of PI are totally different from those of the exudative phase, and placement of a chest tube is often clearly indicated.2 However, no sufficiently reliable clinical, laboratory, or radiological predictors have yet been developed to identify patients with a simple PI that might evolve into a complicated PI/empyema.
The aim of this study was to assess if a predictive model based on combination of biomarkers of inflammatory response in PF can predict which patients with IPE will develop more complicated PI.
Materials and MethodsPatientsThis was a prospective study of all patients with IPE who were seen in our department between June 2013 and December 2016. If a patient underwent several thoracenteses, the biochemical data of the first procedure were used.
DefinitionsIPE was diagnosed on the basis of lung infection associated with an acute clinical picture progressing with fever, pulmonary infiltrates, purulent sputum, and response to antibiotic treatment, or identification of an organism in PF.
PIs were considered uncomplicated if they resolved with antibiotic treatment alone, and complicated if the effusion required a chest drain for resolution; empyema was defined as pus in the pleural space or a positive PF culture.7
We excluded patients under the age of 18 years and those who had had previous empyema, major surgery in the 5 previous days, pneumonectomy on the infected side, those who were pregnant or breast-feeding, and patients with a life expectancy of less than 3 months.
SamplesPF was obtained by ultrasound-guided thoracentesis before starting treatment and with the patient fasting. PF samples were sent for microbiology (Ziehl–Neelsen staining and culture in aerobic, anaerobic, and Löwenstein media), cytology and biochemistry studies. After samples were centrifuged at 1500×g at 4°C for 15min, the supernatants were processed within 2h of extraction and subsequently stored at −80°C. Interleukin 6 (IL-6) and C-reactive protein (CRP) were determined by IMMULITE® 2000 (Siemens Healthcare Diagnostics Products Ltd., Llanberis, Gwynedd LL55 4EL, United Kingdom). Results were expressed in pg/ml and mg/l, respectively, and were available in less than 1h.
Statistical AnalysisContinuous variables were expressed as mean±SD or median (25th–75th percentiles), according to whether distributions were normal or non-normal. Qualitative variables were expressed as absolute frequency and percentage. Normal distribution of the variables was calculated using the Kolgomorov–Smirnov test. The Chi-squared test was used to compare categorical variables, and the Mann–Whitney U test for continuous variables. The following were estimated to determine the diagnostic yield of the parameters: sensitivity, specificity, positive predictive value, negative predictive value, positive and negative likelihood ratios, and diagnostic accuracy. Optimal cut-off points were obtained using the Youden approach.8 ROC curves were constructed and areas under the curve (AUC)9 were identified to determine discrimination capacity. These values were interpreted according to the following limits: 0.60–0.69: poor discriminatory value; 0.70–0.79: moderate discriminatory value; 0.80–0.89: good discriminatory value; and 0.90–1.00: excellent discriminatory value.
Logistic binary regression models were constructed, in which all potentially predictive variables were initially included, followed by the elimination of those which contributed little or nothing to the explanatory power of the model according to the likelihood ratio test (P<.05). Odds ratios were estimated from the regression coefficients and their 95% confidence intervals. Different aspects of the performance of the model were studied, including discrimination, calibration, and diagnostic confidence.10,11 Calibration was evaluated using the Brier score, and non-parametric estimates of the observed frequencies versus those predicted by the model were plotted. ROC curves and their corresponding AUC also were used to check the discrimination capacity of the models. We used the theoretical relationship between the probability of the IPE threshold and the relative value of the false positive and false negative results to determine the value of the models. For this purpose, the classification rule was defined as follows: each patient was classified as belonging to the infectious group if they presented predicted probabilities equal or superior to the selected threshold, and negative otherwise. This means that individuals in whom the model predicted IPE but who did not have it would be false negatives, while cases in whom the model did not predict IPE and they had it were false positives. Bootstrap techniques were used to correct for possible overoptimism in both estimates of discrimination and patient classification. Finally, nomograms were built for the prediction models, based on the coefficients of the models obtained by logistic regression. Data were analyzed using the packages mgcv,12 MASS,13 rms,10 OptimalCutpoints13 and pROC,14 all of which are freely available in R.15
Our study was approved by the Clinical Research Ethics Committee of the hospital (registry 2013/013).
ResultsA total of 813 thoracenteses were carried out during the study period; 107 effusions were excluded as follows: no definitive diagnosis (27), presence of exclusion criteria (33), data from repeated patients (21), possible double diagnosis (18), and incomplete data (8). Of the 706 patients who were eventually diagnosed, 177 were IPE. Of these, 74 were uncomplicated, 65 were complicated and 38 were empyema (total complicated PI/empyema, 103).
PF culture was positive in 34/177 patients (19.2%). Streptococcus milleri (Streptococcus intermedius, constellatus, and mitis) was the group most frequently cultured (13 patients; 7.3%), followed by Streptococcus pneumoniae (5 patients; 2.8%), Streptococcus oralis (4 cases; 2.3%), other Streptococcus types (viridans, group C beta-hemolytic, and species) (3; 1.7%), Staphylococcus aureus, Escherichia coli, and Pseudomonas aeruginosa (2 cases each; 1.1%), nocardia, Fusobacterium nucleatum, and Parvimonas micra (1 case each; 0.6%). Fifty patients (28.2%) had received antibiotic treatment before thoracentesis was performed.
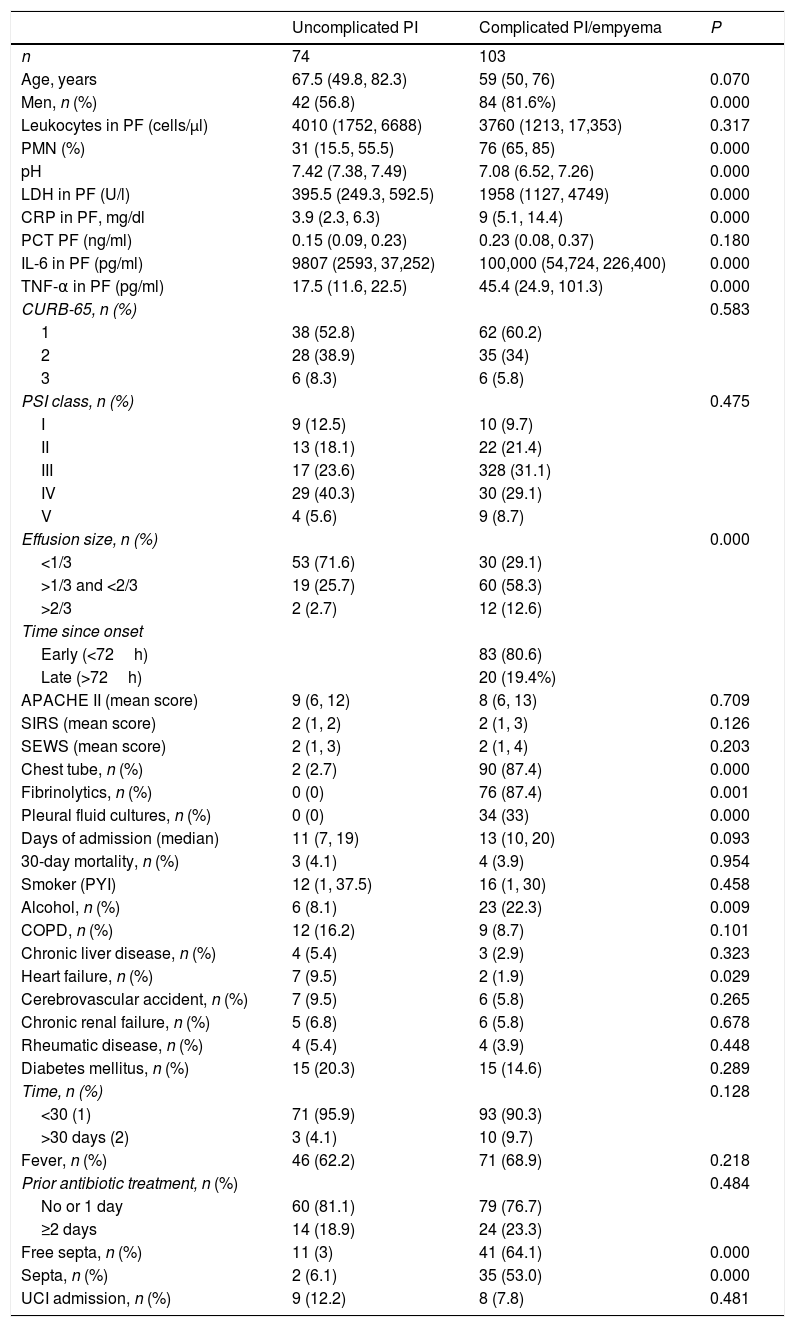
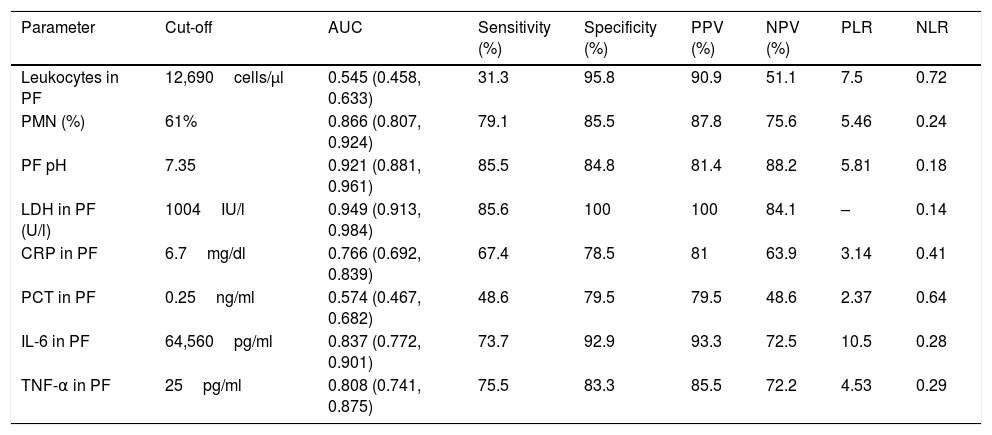
Table 1 shows the characteristics of the study patients according to their classification as uncomplicated PI and complicated PI/empyema. The percentages of polymorphonuclear (PMN) leukocytes, lactate dehydrogenase (LDH), CRP, IL-6 and tumor necrosis factor alpha (TNF-α) in PF increased significantly in line with the complexity of the effusion, while pH decreased. If the PI was complicated or empyema developed, significant increases were observed in the size of the PE, alcoholism, positive PF cultures, the need for chest tubes and treatment with fibrinolytic agents, and the presence of septa in the pleural space. No significant differences were found in CURB-65, PSI, length of hospital stay, need for ICU admission, and mortality. In contrast, heart failure was significantly more common in patients with uncomplicated PE than in those with complicated PE/empyema (9.5% vs. 1.9%, P=.029). Table 2 shows the yield of each PF parameter for the diagnosis of complicated PI/empyema. The parameters that showed the best AUC for diagnosis were LDH (0.949), pH (0.921), percentage of PMN (0.866), and IL-6 (0.837).
Main Characteristics of Patients With Infectious Pleural Effusion.
| Uncomplicated PI | Complicated PI/empyema | P | |
|---|---|---|---|
| n | 74 | 103 | |
| Age, years | 67.5 (49.8, 82.3) | 59 (50, 76) | 0.070 |
| Men, n (%) | 42 (56.8) | 84 (81.6%) | 0.000 |
| Leukocytes in PF (cells/μl) | 4010 (1752, 6688) | 3760 (1213, 17,353) | 0.317 |
| PMN (%) | 31 (15.5, 55.5) | 76 (65, 85) | 0.000 |
| pH | 7.42 (7.38, 7.49) | 7.08 (6.52, 7.26) | 0.000 |
| LDH in PF (U/l) | 395.5 (249.3, 592.5) | 1958 (1127, 4749) | 0.000 |
| CRP in PF, mg/dl | 3.9 (2.3, 6.3) | 9 (5.1, 14.4) | 0.000 |
| PCT PF (ng/ml) | 0.15 (0.09, 0.23) | 0.23 (0.08, 0.37) | 0.180 |
| IL-6 in PF (pg/ml) | 9807 (2593, 37,252) | 100,000 (54,724, 226,400) | 0.000 |
| TNF-α in PF (pg/ml) | 17.5 (11.6, 22.5) | 45.4 (24.9, 101.3) | 0.000 |
| CURB-65, n (%) | 0.583 | ||
| 1 | 38 (52.8) | 62 (60.2) | |
| 2 | 28 (38.9) | 35 (34) | |
| 3 | 6 (8.3) | 6 (5.8) | |
| PSI class, n (%) | 0.475 | ||
| I | 9 (12.5) | 10 (9.7) | |
| II | 13 (18.1) | 22 (21.4) | |
| III | 17 (23.6) | 328 (31.1) | |
| IV | 29 (40.3) | 30 (29.1) | |
| V | 4 (5.6) | 9 (8.7) | |
| Effusion size, n (%) | 0.000 | ||
| <1/3 | 53 (71.6) | 30 (29.1) | |
| >1/3 and <2/3 | 19 (25.7) | 60 (58.3) | |
| >2/3 | 2 (2.7) | 12 (12.6) | |
| Time since onset | |||
| Early (<72h) | 83 (80.6) | ||
| Late (>72h) | 20 (19.4%) | ||
| APACHE II (mean score) | 9 (6, 12) | 8 (6, 13) | 0.709 |
| SIRS (mean score) | 2 (1, 2) | 2 (1, 3) | 0.126 |
| SEWS (mean score) | 2 (1, 3) | 2 (1, 4) | 0.203 |
| Chest tube, n (%) | 2 (2.7) | 90 (87.4) | 0.000 |
| Fibrinolytics, n (%) | 0 (0) | 76 (87.4) | 0.001 |
| Pleural fluid cultures, n (%) | 0 (0) | 34 (33) | 0.000 |
| Days of admission (median) | 11 (7, 19) | 13 (10, 20) | 0.093 |
| 30-day mortality, n (%) | 3 (4.1) | 4 (3.9) | 0.954 |
| Smoker (PYI) | 12 (1, 37.5) | 16 (1, 30) | 0.458 |
| Alcohol, n (%) | 6 (8.1) | 23 (22.3) | 0.009 |
| COPD, n (%) | 12 (16.2) | 9 (8.7) | 0.101 |
| Chronic liver disease, n (%) | 4 (5.4) | 3 (2.9) | 0.323 |
| Heart failure, n (%) | 7 (9.5) | 2 (1.9) | 0.029 |
| Cerebrovascular accident, n (%) | 7 (9.5) | 6 (5.8) | 0.265 |
| Chronic renal failure, n (%) | 5 (6.8) | 6 (5.8) | 0.678 |
| Rheumatic disease, n (%) | 4 (5.4) | 4 (3.9) | 0.448 |
| Diabetes mellitus, n (%) | 15 (20.3) | 15 (14.6) | 0.289 |
| Time, n (%) | 0.128 | ||
| <30 (1) | 71 (95.9) | 93 (90.3) | |
| >30 days (2) | 3 (4.1) | 10 (9.7) | |
| Fever, n (%) | 46 (62.2) | 71 (68.9) | 0.218 |
| Prior antibiotic treatment, n (%) | 0.484 | ||
| No or 1 day | 60 (81.1) | 79 (76.7) | |
| ≥2 days | 14 (18.9) | 24 (23.3) | |
| Free septa, n (%) | 11 (3) | 41 (64.1) | 0.000 |
| Septa, n (%) | 2 (6.1) | 35 (53.0) | 0.000 |
| UCI admission, n (%) | 9 (12.2) | 8 (7.8) | 0.481 |
APACHE II: Acute Physiology and Chronic Health Evaluation II; CRP: C-reactive protein; ICU: intensive care unit; IL-6: interleukin 6; LDH: lactate dehydrogenase; PCT: procalcitonin; PI: pleural infection; SEWS: Standardized Early Warning Score; SIRS: Systemic Inflammatory Response Syndrome; TNF-α: tumor necrosis factor-alpha.
Sensitivity, Specificity, Positive and Negative Predictive Values and AUC for the Diagnosis of Complicated Pleural Infection/Empyema.
| Parameter | Cut-off | AUC | Sensitivity (%) | Specificity (%) | PPV (%) | NPV (%) | PLR | NLR |
|---|---|---|---|---|---|---|---|---|
| Leukocytes in PF | 12,690cells/μl | 0.545 (0.458, 0.633) | 31.3 | 95.8 | 90.9 | 51.1 | 7.5 | 0.72 |
| PMN (%) | 61% | 0.866 (0.807, 0.924) | 79.1 | 85.5 | 87.8 | 75.6 | 5.46 | 0.24 |
| PF pH | 7.35 | 0.921 (0.881, 0.961) | 85.5 | 84.8 | 81.4 | 88.2 | 5.81 | 0.18 |
| LDH in PF (U/l) | 1004IU/l | 0.949 (0.913, 0.984) | 85.6 | 100 | 100 | 84.1 | – | 0.14 |
| CRP in PF | 6.7mg/dl | 0.766 (0.692, 0.839) | 67.4 | 78.5 | 81 | 63.9 | 3.14 | 0.41 |
| PCT in PF | 0.25ng/ml | 0.574 (0.467, 0.682) | 48.6 | 79.5 | 79.5 | 48.6 | 2.37 | 0.64 |
| IL-6 in PF | 64,560pg/ml | 0.837 (0.772, 0.901) | 73.7 | 92.9 | 93.3 | 72.5 | 10.5 | 0.28 |
| TNF-α in PF | 25pg/ml | 0.808 (0.741, 0.875) | 75.5 | 83.3 | 85.5 | 72.2 | 4.53 | 0.29 |
AUC: area under the ROC curve; CRP: C-reactive protein; LDH: lactate dehydrogenase; IL-6: interleukin 6; NLR: negative likelihood ratio; NPV: negative predictive value PCT: procalcitonin; PLR: positive likelihood ratio; PPV: positive predictive value; TNF-α: tumor necrosis factor-alpha.
Fig. 1 shows the distribution of the concentrations of the main variables in PF for uncomplicated and complicated PI/empyema, and Table 2 shows the ROC AUC of all variables for the diagnosis of complicated PI/empyema.
, pH, LDH, CRP, PCT, IL-6 and TNF-α in pleural fluid in the uncomplicated and complicated pleural infections and empyemas. CRP: C-reactive protein; IL-6: interleukin 6; LDH, lactate dehydrogenase; PCT: procalcitonin; PF: pleural fluid; PMN: polymorphonuclear leukocytes; TNF-α: tumor necrosis factor-alpha.")
Distribution of concentrations in the number of leukocytes, polymorphonuclear leukocytes (%), pH, LDH, CRP, PCT, IL-6 and TNF-α in pleural fluid in the uncomplicated and complicated pleural infections and empyemas. CRP: C-reactive protein; IL-6: interleukin 6; LDH, lactate dehydrogenase; PCT: procalcitonin; PF: pleural fluid; PMN: polymorphonuclear leukocytes; TNF-α: tumor necrosis factor-alpha.
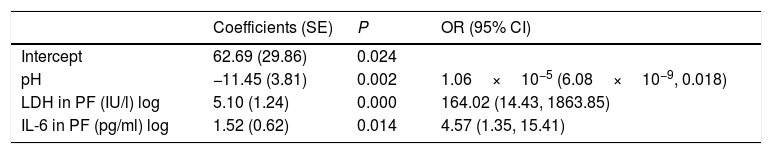
We used logistic regression analysis to differentiate the uncomplicated PIs from complicated PI/empyema. The model included 3 variables: pH, LDH, and IL-6 in PF. The coefficients obtained in the regression analysis for the study model are shown in Table 3. The discrimination capacity obtained was an AUC of 0.9783, significantly better than any of the component variables individually (P<.001). The bootstrap-corrected AUC was slightly lower than the apparent AUC (0.9757), which also does not reflect any optimism. This model correctly classified 96% (170/177) of the effusions (72/74 [97.3%] of uncomplicated PIs and 98/103 [95.1%] of the complicated PI/empyema cases).
Logistic Regression Model for the Diagnosis of Complicated Pleural Infections/Empyema.
| Coefficients (SE) | P | OR (95% CI) | |
|---|---|---|---|
| Intercept | 62.69 (29.86) | 0.024 | |
| pH | −11.45 (3.81) | 0.002 | 1.06×10⁻⁵ (6.08×10⁻⁹, 0.018) |
| LDH in PF (IU/l) log | 5.10 (1.24) | 0.000 | 164.02 (14.43, 1863.85) |
| IL-6 in PF (pg/ml) log | 1.52 (0.62) | 0.014 | 4.57 (1.35, 15.41) |
R2=0.843, Brier=0.052, AUC=0.978 (0.956, 1).
CI: confidence interval; IL-6: interleukin 6; LDH: lactate dehydrogenase; PF: pleural fluid; OR: odds ratio; SE: standard error.
The calibration plot of the constructed model is shown in Fig. 2. The calibration shows good concordance between the estimated probability and the observed frequency. Finally, Fig. 3 shows the constructed nomogram.


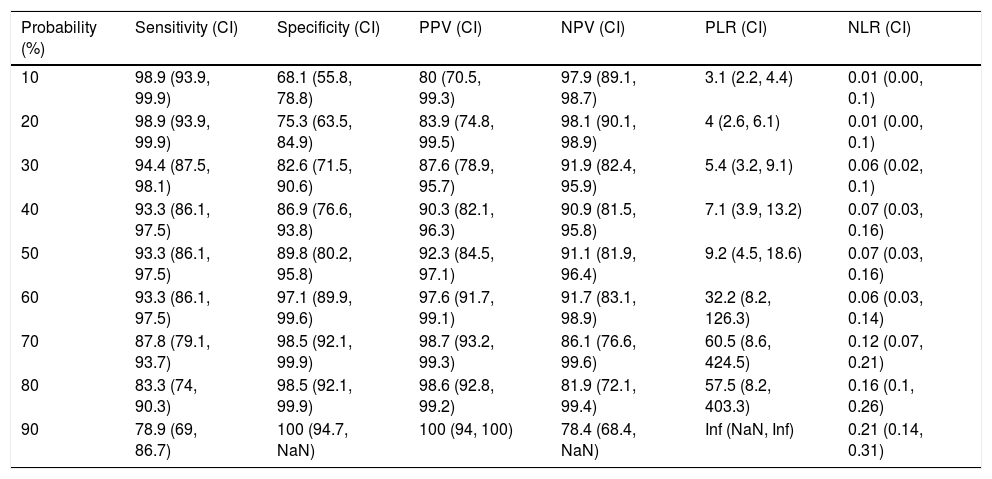
Table 4 shows the yield for different cut-off points of the predicted probability for the diagnosis of a complicated PI/empyema, obtained from the constructed model. In clinical practice, the calculation of the probability that the PI is complicated/empyema can be easily performed using an Excel calculator (Supplementary material [Annex], e-Figure 1).
Sensitivity, Specificity, Positive and Negative Predictive Values, and Positive and Negative Likelihood Ratio to Differentiate an Uncomplicated Pleural Infection From a Complicated Pleural Infection/Empyema Using the Constructed Model.
| Probability (%) | Sensitivity (CI) | Specificity (CI) | PPV (CI) | NPV (CI) | PLR (CI) | NLR (CI) |
|---|---|---|---|---|---|---|
| 10 | 98.9 (93.9, 99.9) | 68.1 (55.8, 78.8) | 80 (70.5, 99.3) | 97.9 (89.1, 98.7) | 3.1 (2.2, 4.4) | 0.01 (0.00, 0.1) |
| 20 | 98.9 (93.9, 99.9) | 75.3 (63.5, 84.9) | 83.9 (74.8, 99.5) | 98.1 (90.1, 98.9) | 4 (2.6, 6.1) | 0.01 (0.00, 0.1) |
| 30 | 94.4 (87.5, 98.1) | 82.6 (71.5, 90.6) | 87.6 (78.9, 95.7) | 91.9 (82.4, 95.9) | 5.4 (3.2, 9.1) | 0.06 (0.02, 0.1) |
| 40 | 93.3 (86.1, 97.5) | 86.9 (76.6, 93.8) | 90.3 (82.1, 96.3) | 90.9 (81.5, 95.8) | 7.1 (3.9, 13.2) | 0.07 (0.03, 0.16) |
| 50 | 93.3 (86.1, 97.5) | 89.8 (80.2, 95.8) | 92.3 (84.5, 97.1) | 91.1 (81.9, 96.4) | 9.2 (4.5, 18.6) | 0.07 (0.03, 0.16) |
| 60 | 93.3 (86.1, 97.5) | 97.1 (89.9, 99.6) | 97.6 (91.7, 99.1) | 91.7 (83.1, 98.9) | 32.2 (8.2, 126.3) | 0.06 (0.03, 0.14) |
| 70 | 87.8 (79.1, 93.7) | 98.5 (92.1, 99.9) | 98.7 (93.2, 99.3) | 86.1 (76.6, 99.6) | 60.5 (8.6, 424.5) | 0.12 (0.07, 0.21) |
| 80 | 83.3 (74, 90.3) | 98.5 (92.1, 99.9) | 98.6 (92.8, 99.2) | 81.9 (72.1, 99.4) | 57.5 (8.2, 403.3) | 0.16 (0.1, 0.26) |
| 90 | 78.9 (69, 86.7) | 100 (94.7, NaN) | 100 (94, 100) | 78.4 (68.4, NaN) | Inf (NaN, Inf) | 0.21 (0.14, 0.31) |
CI, confidence interval; Inf: infinite; PLR: positive likelihood ratio; NLR: negative likelihood ratio; NaN: not a number; NPV: negative predictive value; PPV: positive predictive value.
Fig. 4 shows the distribution of the values of pH, IL-6, and LDH in PF, by uncomplicated PI (black lines) or complicated PI/empyema (red lines), and the optimal cut-off points.
 or complicated PI/empyema (dashed line), and the optimal cut-off points.")
The parameters of the model constructed to differentiate uncomplicated PI from complicated PI/empyema were used to build a three-dimensional graph that shows the relationship between the values of pH, LDH and IL-6 in PE (Fig. 5). Uncomplicated PI, represented by black circles, are grouped mainly in the area of the graph occupied by the cases with lower values of LDH and IL-6 and higher levels of pH.
 in the construction of the model to differentiate non-complicated pleural infections (black circles) from complicated pleural infections/empyema (gray circles).")
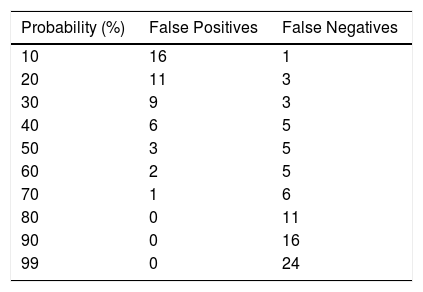
Table 5 shows the errors that occur (false positives and false negatives) with different cut-off points for the probabilities obtained after applying the constructed model.
DiscussionThis study confirms that a predictive model built with a combination of biochemical variables in PF has excellent discriminatory value for predicting complicated PI/empyema, differentiating them from uncomplicated PI in 96% of cases.
Differentiating between uncomplicated PI and complicated PI/empyema has prognostic and therapeutic implications. In contrast to uncomplicated PI, complicated PI and empyema rarely resolve with antibiotics alone, and usually require chest tube drainage and occasionally intrapleural fibrinolytics or even surgical management. This generates a greater burden on health resources and more hospital admissions with extended stays, which can lead to increased morbidity and mortality. If the PF appears purulent, it is relatively simple to diagnose empyema, but fluids with a serous appearance can give a positive culture and need to be resolved by chest tube drainage.16 It is important to establish early on which patients might have complicated IP/empyema, but to date no clinical or radiological data are available to identify these patients. pH, LDH, or glucose values in PF can help in this differentiation, but the margin of error is considerable.2 Other authors have attempted to identify these PIs using multivariate analysis, and certain clinical (age, alcoholism, chest pain, tachycardia, use of intravenous drugs) or laboratory (albumin, sodium, platelets, CRP, leukocytes) characteristics have been reported to be helpful.7,17
The variables that best discriminated complicated PI/empyema from uncomplicated cases on an individual basis were LDH (AUC 0.949), pH (AUC 0.921), percentage of PMN (AUC 0.866), and IL-6 (AUC 0.837) (Table 2). Both LDH and pH are widely used for this purpose16,18 and the yield obtained can be considered to be within the ranges observed in other series.19–22 The percentage of neutrophils is often used in the diagnosis of IPE. Although this parameter is specific, it is not sensitive, since factors such as the stage of disease progression at which the thoracentesis is performed and previous use of antibiotics may influence the outcome.23 However, it has given a good diagnostic yield in the diagnosis of complicated PI/empyema (cut-off point 61.1%; sensitivity 79.1%; specificity 85.5%; AUC 0.866), probably because all cases are at an advanced stage of infection (fibrinopurulent or organizing). Very little experience with IL-6 is available. It has only been used in 1 study and only to diagnose IPE.24 IL-6 is an immune system mediator, and serum levels may be raised in some autoimmune diseases, infections, and sepsis, and in the rejection of organ transplants. AUC has a good discriminatory value (0.837), higher than the above-mentioned study (0.70), and has higher sensitivity and specificity (73.7% and 92.9%, respectively). In contrast, the discriminatory value of CRP was moderate (AUC 0.766). This could mean that once a certain level of inflammation is reached in PF, IL-6 values did not continue to rise in the same proportion as the infection. As suggested by previous studies,25–27 the discriminatory power of procalcitonin was very poor (AUC 0.574).
The presence or absence of complicated IP/empyema was considered for prediction of the outcome. In this context, the logistic regression model is the most widely used statistical technique for binary medical outcomes.10 When developing a prediction model, the aim is to quantify the accuracy of the model (model yield), so calibration, discrimination, diagnostic accuracy, and validity of the predictions were performed for new patients. The model constructed to differentiate both PIs uses the variables pH, LDH, and IL-6. The probability of the patient presenting complicated PI/empyema rises as values of LDH and IL-6 increase, and pH decreases. The AUC of the model, after bootstrapping, is slightly lower than the apparent AUC (0.9757 vs. 0.9783), showing that there is no overoptimism in the estimate. It is interesting that the constructed model does not use percentage of PMNs as a variable, the AUC of which is higher than that of IL-6. This may be because the mechanism by which it rises is similar to that of any of the variables chosen and, therefore, its determination does not offer any advantage in increasing the performance of the model.
The calibration plot (Fig. 2) shows excellent concordance between the predicted probabilities and the observed frequencies, demonstrating the robustness of the model. The nomogram represents the weight of each of the selected variables and estimates the probability that a PI will be complicated PI/empyema, according to the total score obtained from all the variables (Fig. 3, bottom).
Misdiagnosing an uncomplicated PI as complicated PI will subject the patient to unnecessary invasive testing. However, the opposite situation will lead to delays in diagnosis and, as such, to a potential increase in morbidity and mortality. Perhaps, therefore, the best strategy for classifying these patients would be to obtain the lowest number of false negatives, that is to say, to try to avoid complicated PIs being mistakenly classified as uncomplicated, in order to avoid the complications mentioned above. For each predicted probability, a certain yield is obtained. A predicted probability of 60% seems to offer the greatest yield, since this is the point with the least possibility of committing errors when establishing the diagnosis of IPE (Table 5).
Our study has some limitations. First, the number of IPEs was low (177); second, patients were recruited in a single center. Although bootstrap techniques have been used to correct overoptimism, an external validation must be carried out in other centers. Finally, the calculation of the estimated probability of having a complicated PI/empyema is complex, but the construction of an Excel calculator, available in supplementary material, will facilitate the practical implementation of this approach by clinicians.
In summary, our predictive model has a higher yield than that of any of the component variables taken individually for identifying the complicated PI/empyema. Although further studies are needed to confirm these findings, the results obtained appear to suggest that it could be applied in clinical practice.
AuthorshipLucía Ferreiro. Study conception and design: Author. Data collection. Data analysis and interpretation. Critical review of the article. Final approval of the manuscript.
Óscar Lado-Baleato. Statistical analysis. Critical review of the article. Final approval of the manuscript.
Juan Suárez-Antelo. Co-author. Data collection. Data analysis and interpretation. Critical review of the article. Final approval of the manuscript.
María E. Toubes. Co-author. Data collection. Data analysis and interpretation. Critical review of the article. Final approval of the manuscript.
Esther San José. Determination of study parameters in pleural fluid. Co-author. Data analysis and interpretation. Final approval of the manuscript.
Adriana Lama. Co-author. Data collection. Critical review of the article. Final approval of the manuscript.
Nuria Rodríguez-Núñez. Co-author. Data collection. Critical review of the article. Final approval of the manuscript.
José Manuel Álvarez Dobaño. Co-author. Data collection. Critical review of the article. Final approval of the manuscript.
Francisco Javier González Barcala. Co-author. Data collection. Critical review of the article. Final approval of the manuscript.
Jorge Ricoy. Co-author. Data collection. Critical review of the article. Final approval of the manuscript.
Francisco Gude. Statistical analysis. Data analysis and interpretation. Critical review of the article. Final approval of the manuscript.
Luis Valdés. Principal author. Study conception and design. Data analysis and interpretation. Critical review of the article. Final approval of the manuscript.
FundingThis study was funded by a grant from the Spanish Society of Pulmonology and Thoracic Surgery (SEPAR 126/2012).
Conflict of InterestsThe authors state that they have no conflict of interests.
The following are the supplementary data to this article:
Please cite this article as: Ferreiro L, Lado-Baleato Ó, Suárez-Antelo J, Toubes ME, San José ME, Lama A, et al. La combinación de la determinación de parámetros bioquímicos del líquido pleural mejora la predicción diagnóstica de la infección pleural complicada/empiema. Arch Bronconeumol. 2019;55:565–572.


