
Most respiratory diseases are considered complex diseases as their susceptibility and outcomes are determined by the interaction between host-dependent factors (genetic factors, comorbidities, etc.) and environmental factors (exposure to microorganisms or allergens, treatments received, etc.).
The reductionist approach in the study of diseases has been of fundamental importance for the understanding of the different components of a system. Systems biology or systems medicine is a complementary approach aimed at analyzing the interactions between the different components within one organizational level (genome, transcriptome, proteome), and then between the different levels.
Systems medicine is currently used for the interpretation and understanding of the pathogenesis and pathophysiology of different diseases, biomarker discovery, design of innovative therapeutic targets, and the drawing up of computational models for different biological processes.
In this review we discuss the most relevant concepts of the theory underlying systems medicine, as well as its applications in the various biological processes in humans.
La gran mayoría de las enfermedades respiratorias son consideradas patologías complejas puesto que su susceptibilidad o desenlace están influidos por la interacción entre factores dependientes del huésped (genéticos, comorbilidad, edad, etc.) y del ambiente (exposición a microorganismos y alérgenos, tratamiento administrado, etc.).
El enfoque reduccionista ha sido muy importante para la comprensión de los diversos componentes de un sistema. La biología o medicina de sistemas es una aproximación complementaria cuyo objetivo es el análisis de las interacciones entre los componentes dentro de un nivel de organización (genoma, transcriptoma, proteoma) y posteriormente entre los distintos niveles.
Las actuales aplicaciones de la medicina de sistemas incluyen la interpretación de la patogénesis y fisiopatología de las enfermedades, el descubrimiento de biomarcadores, el diseño de nuevas estrategias terapéuticas y la elaboración de modelos computacionales para los distintos procesos biológicos.
En la presente revisión se exponen las principales nociones sobre la teoría que subyace a la medicina de sistemas así como sus aplicaciones en algunos procesos biológicos del ser humano.
Most respiratory diseases are considered complex, as their susceptibility and outcomes are determined by the interaction between host-dependent (genetic factors, comorbidities, etc.) and environmental factors (exposure to microorganisms and allergens, treatments received, etc.).
The advent of new, sophisticated techniques in the early 20th century enabled the function, structure and details of the parts of each biological system or process to be determined. It was the peak of the reductionist or mechanistic approach.
At the beginning of this century, newly motivated by technological developments capable of producing mass experimental and in silica data quickly and at a relatively low cost, the scientific paradigm shifted from the study of the parts to the study of the interactions that exist within a system. A specific disease can be considered a system.
Systems biology, therefore, can be defined as the field of study concerned with the analysis of complex interactions within a system with different scales of biological organization, from molecules to cells, organs, individuals, societies and ecosystems. Systems biology is characterized by the search for a quantitative description of biological processes, which includes multiple levels (genome, transcriptome, proteome, metabolome, etc.) and different time scales, based on data usually generated using high throughput technology, mathematical algorithms and computational models.1 When the concept of systems biology is applied to the field of health sciences, it is called systems medicine. Systems biology and systems medicine are practically identical concepts, except that the former is general and the latter is particularly focused on medicine. Another unique feature of systems medicine is the frequent use of graphs, which have specific rules (analyzed in this article) while constituting a simple way of understanding and visualizing the results.
The field of systems medicine is currently undergoing tremendous development and has clear clinical implications. Some of its applications include the development of physiological and pathophysiological models, discovery of new drugs, and the development of diagnostic tests and novel biomarkers (Table 1).
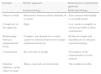
Comparison between the reductionist and holistic approaches.
| Example | Holistic approach | Reductionist or mechanistic approach |
| Systems biology | Molecular biology | |
| Object of study | Interactions between all the elements of a system | Each element individually or in small groups |
| Complexity of the approach | High | Low (seeks to simplify as much as possible to draw conclusions) |
| Relationship between organizational levels | Complex, non-linearLaws or rules cannot be inferred from lower to upper organizational levels | Relatively simple and linearBased on ontogeny and epistemology |
| Visualization | By networks or graphs | Description of the characteristics of each element |
| External influence on the object of study | Major, especially environmental | The smallest possible |
This review is aimed at clinicians and is intended to convey the basics of systems medicine and some of its applications as simple as possible.
Systems medicineThe traditional reductionist approach centers on the analysis of specific molecules or processes from an individual's point of view, based on 2 types of concepts:
- (a)
Ontological concepts: all things are constituted by a limited set of primitive and indivisible material elements. Understanding the interaction between these basic compounds is sufficient to explain all complex phenomena.
- (b)
Epistemological concepts: the laws and theories in a given area and level of organization can be derived from lower (more fundamental) organizational levels.2
“Classical” molecular biology almost exclusively uses the reductionist approach, since it is based mainly on the characterization of molecules or genes and on explaining biological processes by combinations of interactions and properties among its components.
However, the study of the genome, cell metabolism and protein–protein interactions can be approached using global techniques and interpretations (holistic approach), based on the identification and analysis of the interactions between the different elements (nodes) of a network. These interactions are complex and include multiple organizational levels (DNA, RNA, proteins and environment, for example); they are non-linear (there is no directly proportional, easily deduced relationship between one organizational level and another); and they are redundant, and have multiple feedback loops. In this holistic approach, the concepts of ontogeny and epistemology are not applicable, since an element cannot be assigned an exclusive function, and neither is it possible to deduce the rules or laws of one level based on another organizational level.
The application of systems biology to specific medical issues has given rise to systems medicine, which allows new associations to be established between biological functions and special human diseases or conditions. For example, severe sepsis is caused by an infectious injury (bacteria, viruses, parasites), at a certain time (in the community or during a stay in it), in a host with certain characteristics (comorbidities, nutritional status, immune status, carrier of certain genetic polymorphisms). The response generated (alterations in transcriptome or proteome) is clearly influenced by the previously described factors and the treatment received. The aim of systems medicine is to analyze all these factors in a holistic and comprehensive manner, prioritizing the link between the different organizational levels on the functioning of each specific element.
Graphs and biological networksGraphs used to display biological processes are called biological networks, and are a simple, easily understood way of visualizing information. A graph is a set of objects called vertices or nodes connected by links or edges. Airline connections are perhaps the best-known graphs. The nodes are the elements of interest, for example, proteins, genes, metabolites or in the aforementioned example, airports, while the links are the relationships between the nodes, and would correspond to flight routes between two airports. A graph, therefore, is defined by a set of nodes V (for example, airports) and links E (for example, routes), remembering that each link has two nodes (the airplane has to leave from one airport and arrive at another). Each link can be assigned a weight, direction and type.
Graphs have 3 main aims in the field of medicine:
- (a)
To represent knowledge of, for example, metabolic routes, transduction signals or gene expression.
- (b)
To quantify and visualize the data produced by experiments and high-throughput techniques, for example, data generated using microarrays or mass spectroscopy.
- (c)
To display statistical models. For example, to estimate which elements participate in forming a protein starting from a certain volume of data. Graphs enable various models to be developed from which the model that best fits the reality observed experimentally can be then chosen.
The topological parameters of a biological network are its inherent characteristics, which must be identified to understand its architecture and functioning. The key features are3 (Table 2):
- (a)
Degree. This is the number of connections of a particular node. It is represented by the letter k. In digraphs (Table 2), it is possible to discriminate between an in-degree and an out-degree. In general, the higher the degree of a node, the greater its importance in the network (hubs have a higher degree than other nodes).
- (b)
Distance. This is the shortest path between 2 nodes.
- (c)
Diameter. This is the maximum distance between 2 nodes.
- (d)
Clustering coefficient. This is the ratio between the number of actual links between neighboring nodes and the maximum number of potential links between them. It is calculated for each node in particular (Fig. 1).
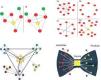
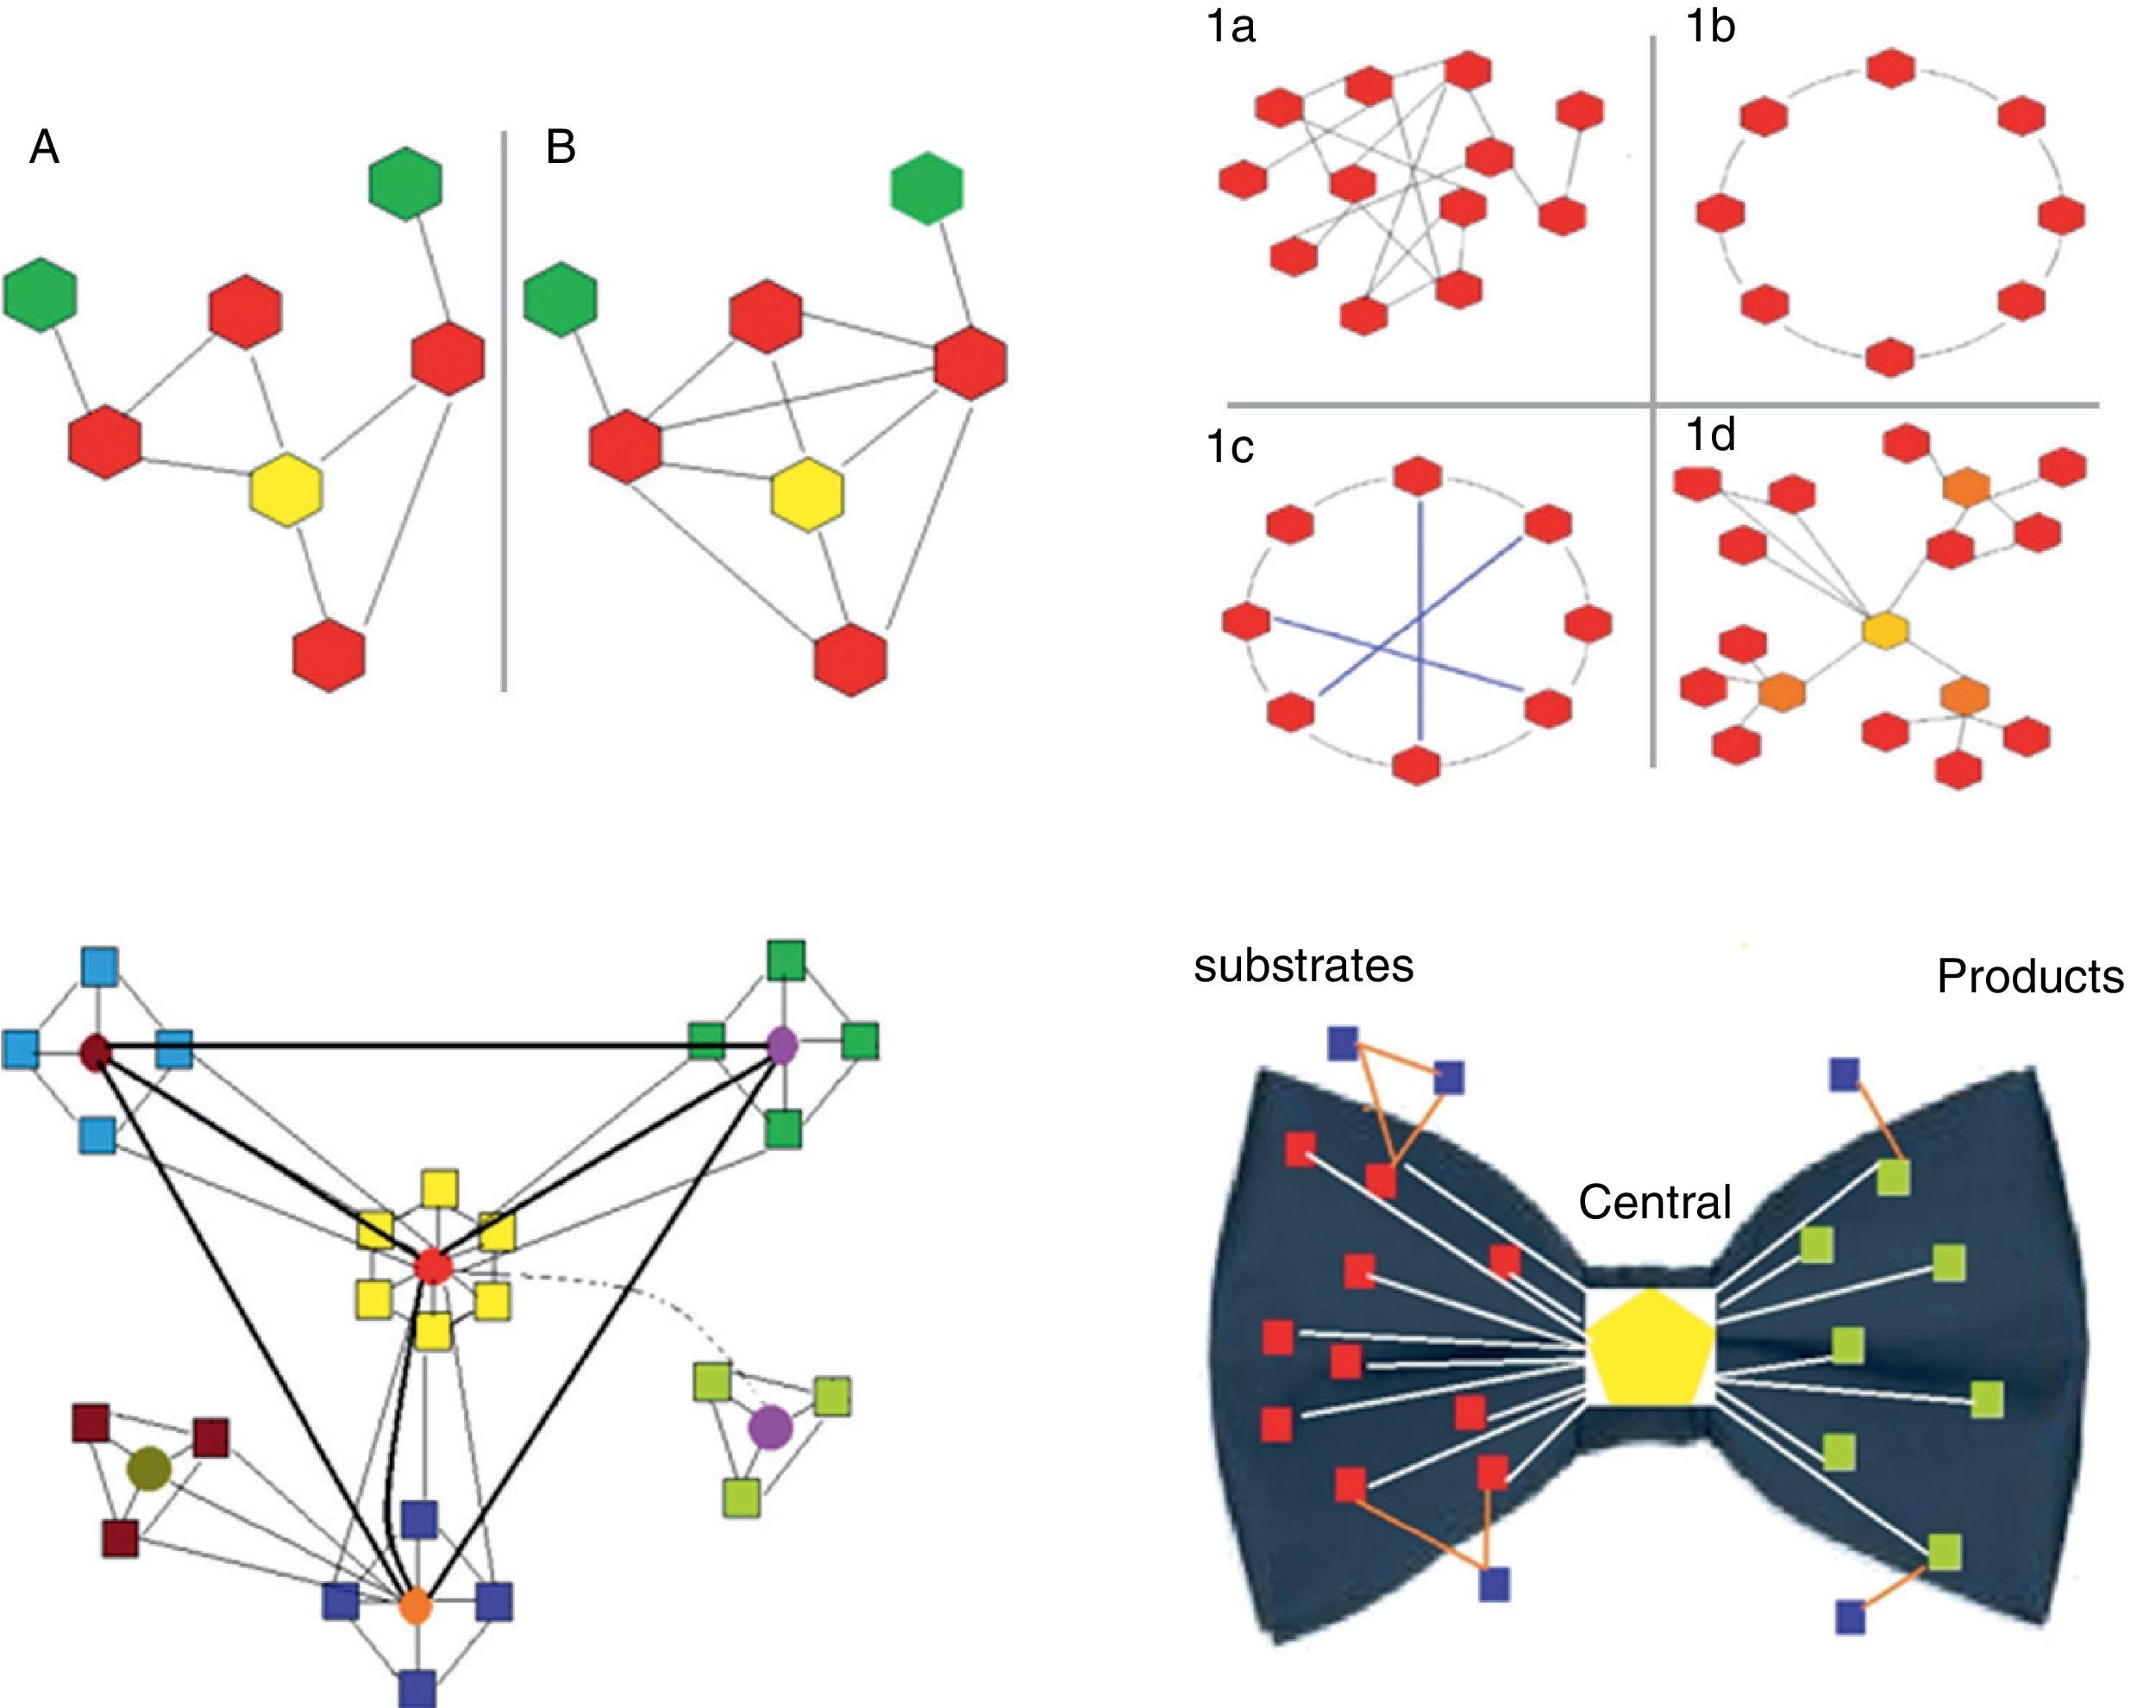
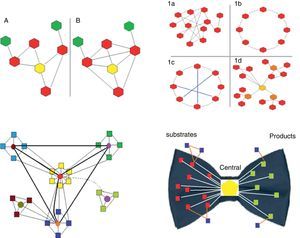 Fig. 1.
Upper left panel. Two biological networks are shown with their corresponding central node (yellow) and different clustering coefficients: network A has a clustering coefficient of 2/5 (2 connections out of 5 potentially possible); network B has a clustering coefficient of 1 (all possible connections are present). Upper right panel. The 4 main types of networks are shown (graph diagrams). The hexagons represent the nodes and the lines the connections. 1a, random network: the connections between the nodes are established randomly. 1b, regular network: all the nodes have the same number of connections (2 in the example). 1c, small world network: similar to the regular network but with shorter “paths” represented by the blue lines. 1d, scale-free network: there are nodes that are more important as they receive more connections (in the example, the yellow node is the most important, while the orange nodes have lesser importance) and independent subgroups are established. Lower left panel. Biological systems are shown. They are scale-free networks with particular characteristics, especially the presence of relatively independent modules and hierarchical organization. In the diagram, the origin of the network is represented by the central “yellow” module, which is hierarchically higher and therefore has more connections. The light blue, green and dark blue squares correspond to lower hierarchy modules, which could be linked to certain functions. Finally, the brown module is the lowest hierarchy. Most species conserve the higher hierarchy modules (in this case the yellow module), as they are linked to processes that are critical for life. In contrast, lower hierarchy modules, for example the brown module, are those that explain the difference between species, and enable adaptation to particular circumstances or environments. The light green represents a module that is switched on or off depending on a temporal or environmental pattern. Lower right panel. This represents the “bow-tie” structure of metabolic networks. They are made up of 4 parts: (a) red squares, substrate nodes; (b) green squares, product nodes; (c) blue squares, independent nodes; and (d) the central hexagon, corresponding to the giant strong component, which includes the major metabolic pathways, such as glycolysis or the Krebs cycle.
- (e)
Betweenness. This is the frequency with which a node appears in the shortest pathway that connects another 2 nodes. It is an estimation of the traffic in the aforementioned node.
Nomenclature used in graphs or networks.
| Neighboring or adjacent nodes: 2 nodes that are connected by an edge or arc |
| Neighboring or adjacent links: links that are connected by a node |
| Simple graph: a graph with no loops or parallel edges |
| Multigraph: graph with parallel edges but no loops |
| Digraphs or directed graphs: graphs in which the arcs are directed |
| Regular graph: all the nodes have the same degree |
| Degree of a node: the number of neighbors that said node has. If there are directed arcs, the in-degree and out-degree of the node can be calculated |
| Connected graph: at least one path connects each pair of nodes in the graph |
| Loop (or buckle): edge that starts and ends in the same node |
| Pseudograph: graph containing loops |
| Forest: graph with no cycles (acyclic) |
| Parallel edges: 2 edges that connect the same pair of vertices |
| Walk from a node A to a node Z: an alternating sequence of nodes and arcs that must be travelled to go from vertex x to y |
| Trail: a walk with no repeated edges |
| Path: walk in which all the nodes are different |
| Length: the number of edges of a walk when no link has a specific weight (if any link has a specific weight a correction should be made) |
| Minimal path or distance between node A and node Z: the minimum length (number of edges) that must be travelled between A and Z or vice versa |
| Closed walk: path or circuit with no repeated edges |
| Cycle: circuit with no repeated nodes |
| Articulation point: a node that, if removed, disconnects a connected graph |
| Cut: set of edges that, if removed, disconnects a connected graph; if a cut is composed of a single edge, it is called a bridge |
| Minimum cut: smallest number of edges that, if removed, disconnect the graph |
| Clique: subset in an undirected graph X in which all the vertices are joined by a link. If the clique only is considered, this is a complete graph |
| Size of a clique: number of vertices that it contains |
Depending on their topological characteristics, the major biological networks can be classified as (Fig. 1):
- (a)
Random. The connections between the nodes occur randomly (the degrees of the nodes follow a Poisson distribution), i.e. the probability of connection between nodes is equal; therefore, it is impossible to predict in which node the connection will occur.
- (b)
Scale-free. These are networks with a small group of nodes, called hubs, which are highly connected and interact with a large number of lower-level nodes. Most nodes have few connections, while hubs are highly connected. Hubs are critical points that, if removed, significantly decrease the size of the network or cause it to disintegrate into independent sub-sets (clusters or modules) (see below). The existence of these critical points means that scale-free networks are highly sensitive to specific modifications (directed at these critical points) but very resistant to random distortions (common in mutations). This characteristic could explain why the sensitivity of a small proportion of complex human diseases (for example, diabetes, hypertension, pneumonia) is associated with point mutations that can be induced experimentally but which are very difficult to induce using randomly generated mutations. Most biological systems are scale-free networks.
The main scale-free networks in humans are3:
- (a)
Transcription factor-binding networks. Transcription factor binding sites have been identified by means of microarrays and/or DNA sequencing in yeasts and other organisms.4,5 Combining these with information on gene expression, it was later possible to deduce or identify gene activation and repression sites.
- (b)
Protein–protein interaction networks. These networks are the most widely studied, as there are techniques for identifying the presence of proteins (for example, by combining two-dimensional polyacrylamide gel electrophoresis and mass spectrometry) and their interactions (for example, using the yeast two-hybrid assay [“Y2H”]).
- (c)
Protein phosphorylation networks. Protein phosphorylation is an important regulatory mechanism in eukaryotic cells, and it is estimated that 2% of genes code enzymes with kinase activity.6 Advances in techniques such as mass spectrometry, the use of kinases that only act on labeled nucleotides and the development of micromatrices have enabled mass analysis of the cell phosphorylation phenomenon and the construction of this type of network.
- (d)
Metabolic interaction networks. Metabolism has traditionally been described as a set of metabolic pathways that originate from a particular starting substrate that undergoes a series of enzymatic transformations to form a final product. A metabolic network, meanwhile, refers to the overall analysis of the entire metabolism by applying non-linear differential catalysis and mutual inhibition equations. One very important characteristic that emerged from comparing the metabolic networks of different organisms was that they are all very similar, which shows the advantages of the model adopted (see below).7
- (e)
Genetic molecule interaction networks. The combination of two mutations (acting together but not independently) in an individual can result in severe modifications.8 In living beings, must mutations have no lethal effects if produced individually, since (i) they are generated randomly and affect mainly environmental adaptation processes and not the survival of the individual, and (ii) there is great redundancy in the function. However, when two mutations occur in the same pathway, the effect may be magnified (for example, death of the individual or potentiation of the phenotype).
Biological systems must be stable, i.e. they must maintain their phenotypic traits despite various perturbations (environmental or genetic) that act on them. This stability, also known as robustness, is inherent to all biological systems and experiments have clearly shown that it has facilitated the evolution of species.9
The robustness of a biological system is relative, as no system can withstand any type of disruption, and can be destabilized by a specifically directed change. Therefore, the robustness of a biological system is based on a series of characteristics:
- (a)
Redundancy. This refers to the presence of alternative pathways that can substitute a failed pathway without affecting the system. The most common example is the cytokines, proteins secreted mainly by the cells of the innate and adaptive immune system, which are responsible for mediating several functions. These molecules are notable for their pleiotropic (ability to act on several cell types) and redundant action (many cytokines have the same effect). These two qualities give the biological system excellent robustness, and could explain, for example, the failure to date of all immunomodulatory treatments applied to sepsis.10
- (b)
Feedback control. This refers to the control exerted by “loops” by which the product of a series of reactions controls the action of the substrate. It is an effective way of maintaining the stability of a system. Negative feedback or thermodynamic control (the increase in products inhibits substrate processing) is mainly used to maintain the steady state of the system, while positive feedback or autocatalysis (the increase in products stimulates substrate processing) is used for sensitization.
- (c)
Modularity. Biological systems are made up of functional units or modules which are semi-independent entities with a high internal clustering coefficient (Fig. 1) but with few links to other nodes. Modularity allows functions to be “encapsulated”, which contributes to the robustness of the system and the evolution of the species. The existence of metabolic modules,11 protein–protein interactions12 and gene regulation13 has now been demonstrated. It is fundamental to remember that some modules can be activated or inhibited in certain circumstances, for example, in the presence of external stimuli such as infections.14
- (d)
Protocolization and hierarchization. These characteristics are essential for ordering, organizing and coordinating the system. Protocolization means having a set of rules by which the different parts of a system can be efficiently organized and coordinated. Hierarchization, which is part of protocolization, refers to the assignment of different organizational levels in order to reduce the burden of transmitting information.15 As mentioned above, biological networks are mostly scale-free, and are also modular and hierarchized (Fig. 1).
The characteristics of biological networks help to explain the concept, proposed by our group, of therapeutic paradox, which refers to the fact that therapeutic interventions that are effective in studies of animal models are often ineffective in clinical trials. Studies of novel treatments for numerous complex diseases (for example, acute respiratory distress syndrome (ARDS), severe sepsis or septic shock) often generate positive results in experimental conditions; however, very few of these breakthroughs are confirmed in clinical trials. One possible explanation is that models are developed in healthy animals (with no comorbidities) that are genetically similar, young and subjected to a specific injury. This is the case, for example, of acute lung injury induced by intratracheal administration of lipopolysaccharide or by mechanical ventilation using a high tidal volume, or models of sepsis induced by cecal ligature and puncture. In these models, the host response mechanisms are concentrated in a relatively limited group of pathways (redundant and hierarchical modules), so the potential efficacy of treatment is maximized. Another essential difference between animal and human studies is the great genetic similarity between laboratory animals, while the opposite is true in human patients. The animals generally come from the same family and originate from inbreeding, while humans descend from relatively panmictic populations. Absolute panmixia (choice of reproductive partner regardless of the phenotype) does not exist, as phenotypic features tend to group together.
However, in real life, ARDS or severe sepsis is the result of a wide range of injuries, possibly recurring over time (for example, peritonitis requiring repeated laparotomies), especially in elderly or immunosuppressed individuals, with significant genomic and epigenomic heterogeneity (epigenetics refers to reversible modifications at the DNA sequencing level that are determined by the host–environment interaction). Because of this, the “host” biological system response is highly diverse and heterogeneous, involving a large number of hubs and modules that cast doubt on the beneficial effect observed in animal models. For example, immunomodulatory drugs such as anti-TNF antibodies,16 or nitric oxide synthase inhibitors,17 have shown beneficial effects in animal models, but do not affect or increase mortality in humans, perhaps because the specific inhibition of a certain module (pathway) causes greater imbalance in the overall systemic response.
Conservation of biological networksAnother of the main characteristics of biological networks is their high conservation between different species. Jeong et al.7 used bioinformatics to compare the metabolic networks of 43 different organisms belonging to the 3 domains of life (eukaryotes, bacteria and archaea) obtained from the WIT system.18 This system predicts the existence of metabolic pathways based on the annotation of genes and experimental data. This study enabled the authors to reach important conclusions, which are summarized below:
- (i)
It confirmed that most metabolic networks are scale-free.
- (ii)
The mean distance in the 43 networks was 3.2, which means that, on average, 3 steps would be needed to convert one metabolite into any other. Obviously, this conclusion is not consistent with experimental data, so Ma and Zeng19 later reconstructed the metabolic networks in 80 different organisms; unlike Jeong et al.,7 however, they did not include either very common metabolites or very small molecules such as ATP and NADH. They then found that the average distance in the metabolic networks of eukaryotic cells, bacteria and archaea was 9.57, 8.50 and 7.22, respectively, which is more similar to the distances obtained experimentally.
- (iii)
The diameter of metabolic networks increases in parallel with the complexity of the organism studied. However, this does not occur exponentially, as would be expected if the connections were random. This finding supports the hypothesis that the connections are made following the power law (see below). Another important consequence of this type of directed growth is that increasing the connectivity of some nodes increases their importance, and their removal leads to the disintegration of the network into dysfunctional clusters. It has been shown that the list of the most highly connected nodes is practically identical for all 43 organisms analyzed. These nodes refer to a very small group of metabolites used for basic processes that are common to all of them. The remaining, i.e. less connected metabolites are those used to acquire the distinctive characteristics of each species. Ma and Zeng,19 complementing the study by Jeong et al.,7 proposed the bow tie shape of the theoretical macroscopic structure of metabolic networks (Fig. 1).
Various models have been proposed to explain the growth of biological networks. The most widely accepted is the fixed-degree node model, in which nodes are being constantly added and connected to the network. In this model, the probability a priori of establishing a new link with a certain node increases as the number of existing links of this node increases.20,21 This is Matthew's preferential attachment model.6,22 For example, if there are 3 nodes called a, b and c, with 3, 10 and 15 links, respectively, it is most likely that node c will receive the new links, since it is the largest.
It has been suggested that (i) new nodes in biological networks appear due to gene duplication, since orthologous genes (evolutionally old genes that are present in different organisms but which code proteins with the same function) tend to generate more highly connected nodes23; and (ii) the specialization of the nodes is relatively rapid, since the existing connections between paralogous genes (genes that originated by duplication in the same species but evolved independently, and therefore code proteins with similar but not identical functions) are different. Therefore, a second theory called link dynamics has been proposed, according to which the evolution of a network is based not only on preferential connections but also on the loss and gain of links between specific nodes.
These biological network growth theories explain how other types of networks function. For example, in business, a new enterprise is more likely to be established if a “link” is created with the manager of the company rather than with the employee, even when other links could be generated later and the original link with the manager is lost or diminished. Another example is social life. We are more likely to join a new group of people if a connection is established with the most popular boy or girl, even when later, once included in the network, we could become more closely linked to an individual who is not so popular but who generates a specific interest. These links in turn are not fixed, and are influenced by environmental factors. Indeed we only need look at the relationships between the members of any research laboratory or hospital department.
Genome-scale metabolic modelsAnalyzing the patterns obtained experimentally from the “-omic” sciences from a global perspective requires the construction of mathematical models called genome-scale metabolic models (GEM) in which the experimental data (metabolomic pattern) are integrated into predicted interactions between them using bioinformatic platforms and information from large repositories and databases.24–26
There are various types of metabolic models or GEM, although all share the common objective of mathematically identifying restriction sites. These restriction sites allow the possible and impossible to be distinguished from a metabolic point of view. There are 3 types of restrictions:
- (a)
Physicochemical, defined by (i) the law of conservation of mass and energy, (ii) the dependence between reactions and metabolite concentration, and (iii) changes in free energy of spontaneous reactions;
- (b)
Environmental, for example, the availability of nutrients; and
- (c)
Regulatory, for example, how the cell adapts to environmental changes.
The construction of a GEM begins with the preparation of a stoichiometric matrix. A detailed description of the process of generating a stoichiometric matrix is beyond the scope of this review (see Covert et al.27). We will simply mention that the process begins with collecting data from the literature (e.g. from Uniprot [www.uniprot.org], BRENDA [www.brenda-enzymes.info], Biocyc [www.biocyc.org] or KEGG [http://www.genome.jp/kegg]) to generate a list of chemical products and transport reactions together with participating metabolites in a certain cell. In a stoichiometric matrix, each column corresponds to a chemical element or transport reaction, with values other than zero to identify which metabolites take part in the reaction, as well as the stoichiometric coefficient that corresponds to each metabolite. The matrix should have directionality (the substrates have negative coefficients and the products have positive coefficients). The rows of the matrix make up the list of reactions in which a metabolite participates.
Mass balance applies the law of conservation of mass to a physicochemical system in order to identify the flows or reactions that occur by analyzing what enters and leaves in a certain system. At present, stoichiometric matrices can also be merged with “-omic” data, coming, for example, from the study of the transcriptome. Although there are many obstacles, each chemical element or transport reaction can be connected to proteins or genes that enable the formation of the element or reaction, in order to improve the representation of the system.
Metabolomics and genome-scale metabolic modelsMetabolomics refers to the global study of endogenous metabolites, and is a “snapshot” of the gene expression and enzymatic and physiological activity22,28–30 in a specific element (e.g. a tissue or blood) of an individual. Metabolomics originates from the concept that human diseases are associated with an abnormal metabolic state and, therefore, are reflected in changes in the components of body tissues and fluids.31,32
Mass identification of metabolites can be performed in cells, tissues or biological fluids, using 2 main techniques: (a) high-resolution nuclear magnetic resonance spectrometry; and (b) mass spectrometry in tandem with capillary electrophoresis, gas chromatography, and Fourier transform ion cyclotron mass spectrometry. Both modalities are considered complementary.
Metabolomic analysis can (a) identify metabolites; (b) quantitate their concentration; (c) relate the metabolites to special situations, thus defining biomarkers with a diagnostic, prognostic or treatment response value; (d) understand the function of metabolites in particular metabolic pathways or the entire metabolic network in general, thus providing information on the pathogenesis of an entity; (e) identify therapeutic targets; and (f) obtain images using non-invasive techniques such as nuclear magnetic resonance imaging or positron emission tomography (PET).
The first living being to be modeled was Haemophilus influenzae.33 At present, the biological networks of numerous prokaryotes and eukaryotes have been reconstructed using this holistic approach.34,35 In humans, three GEM called Recon 1,36 the Edinburgh human metabolic network37 and HumanCyc38 have been published to date.
Recon 1, to which we will refer in particular as it is the most widely used, was published in 2007,36 and includes 1496 open reading frames (these refer to DNA sequences that code for proteins), 2004 proteins, 2712 metabolites and 3311 metabolic reactions.
The main applications of Recon 1 are currently:
- (a)
To integrate the “-omic” sciences for the construction of specific models. For example, transcriptomic or proteomic studies can be integrated using Recon 1 to determine the reactions in a particular cell or tissue.
- (b)
To map homologous genes for the construction of models. The use of experimental animals is essential in scientific development, so restrictive models have been developed for animals,39,40 although they are not very accurate. Recently, algorithms have been used to adapt Recon 1 to animal models, taking advantage of the large sequence homology that exists between certain animals.41,42
- (c)
To interpret data obtained massively in disease states or in the response to treatments.
- (d)
To simulate disease states or response to treatments.
Agren et al.43 recently published a protocol for the automatic construction of GEM in specific cell lines. The algorithm was applied to 69 different human cell types and 16 cancer types.
Unsupervised hierarchical clustering (without previously knowing or defining the group) of the 69 cell and 16 cancer networks found that normal cells tend to group according to closely related cell types (for example, the cells of the adrenal cortex and medulla cluster together). Rather unexpectedly, it was found that cancer cells can be differentiated into 3 groups: (a) liver, colorectal, breast and endometrial cancer; (b) head and neck cancer; and (c) the remaining cancers. It was also found that only 189 reactions (4.1% of the total number of reactions) are unique to a specific cell line or cancer, while 501 (11% of the total number of reactions) are common to all cells. They also compared the networks of the 16 cancer cell types with the 24 normal cell types that they came from, finding that: (a) there is a pronounced increase in the metabolism of the polyamines (spermidine, spermine and putrescine), the effects of which include antioxidant function, suppression of necrosis and increased cell proliferation; (b) there is an increase in the isopenoid synthesis pathway, especially geranylgeranyl diphosphate, involved in various pro-oncogenic events; and (c) increased production of prostaglandins, leucotrienes and hydroperoxyeicosatetraenoic acid, compounds that significantly contribute to inflammation and stimulate cancer progression.
Future outlookDespite recent advances, our capacity to analyze data on a massive scale and use them in a holistic approach needs to be improved. The near future will see significant technological breakthroughs that will increase our sensitivity and specificity for detecting many more metabolites and other molecules, as well as drastically reducing analysis and processing costs. This will allow us to study biological systems in various health and disease conditions, and at different developmental stages (birth, adolescence and senescence), or at the start and end of a disease, for example.
Molecular interaction detection systems must be improved. For example, there are techniques for analyzing the interactions between proteins (two-hybrid screening) but not metabolites, which is one of the major difficulties that must be overcome at present.
Likewise, better and more powerful bioinformatic platforms must be developed that are capable of including, in addition to metabolites and gene expression, other potential “restrictions”, such as epigenetic and microRNA patterns.
The prospect of accumulating large amounts of data in the future poses the challenge of transforming this information into useful knowledge. In this context, intuitive interpretation or interpretation based on the investigator's experience is no longer valid, and researchers must instead rely on tools such as data mining, which indentifies relevant patterns or elements in large data sets, in the same way as text mining is used in large databases (e.g. PubMed). The algorithms used by data mining in general or text mining in particular are extremely complex (e.g. neural networks, decision trees, clustering or association rules). Free ware programs have been developed (e.g. Weka, http://www.cs.waikato.ac.nz/ml/weka/) which are simple to use and give very reliable results. Despite this, the results obtained using these strategies must always be validated using experimental techniques.
Finally, correct interpretation of results depends to a large extent on the multidisciplinary nature of research teams. Experts in bioinformatics and in the specific area of study should work together in the early stages of planning the study design, and should continue to collaborate throughout the study.
ConclusionsModern science is in a constant state of transformation, driven to a large extent by technological development. The last century saw the rise of the reductionist approach, which deduced the general functioning on each system from a description of its component “parts”. In this century, the emergence of high performance technologies combined with the development of bioinformatic platforms has led to the analysis of biological processes as a “whole”, and not the sum of their “parts”. This new approach has been called holistic or systems biology and has both unique characteristics and those shared by most organisms. In systems biology, it is more important to understand how all elements interact as a whole, and the importance of specific interactions between one or a few elements takes second place. The application of systems biology to health processes or problems has given rise to a new discipline called systems medicine.
Graphs are one way of representing the interactions between the elements of a biological network. Almost all networks in living beings are “scale-free”.
The large amount of data collected using complex mathematical models based on constructing stoichiometric matrices and identifying restriction sites can now be integrated. Although challenges and difficulties must be overcome in the future, the holistic perspective provides an exceptional opportunity to gain comprehensive insight into biological processes and to develop groundbreaking treatment strategies.
FundingEuropean Union Seventh Framework Programme (ITN-FP7-26486); Instituto de Salud Carlos III (FIS PI 12/2898); Instituto de Salud Carlos III (FIS PI 11/2791); PC is a Marie Curie Program grant holder (PI-NET: ITTN 264864).
Conflict of interestsThe authors declare that they have no conflict of interests.
Please cite this article as: Cardinal-Fernández P, Nin N, Ruíz-Cabello J, Lorente JA. Medicina de sistemas: una nueva visión de la práctica clínica. Arch Bronconeumol. 2014;50:444–451.