


Studies on the prevalence of asthma and allergies often lack representation of the pediatric population, and their impact has not been examined using children without these diseases as a reference group. This study aimed to determine the prevalence of asthma and allergies in children under 14 years old in Spain and their impact on health-related quality of life, activities, healthcare utilization, and environmental and household exposure risk factors.
MethodsData came from a Spanish population-based representative survey of children aged <14 years (N=6297). A sample of controls (1:4) from the same survey was matched using propensity score matching. Logistic regression models and population-attributable fractions were calculated to determine the impact of asthma and allergy.
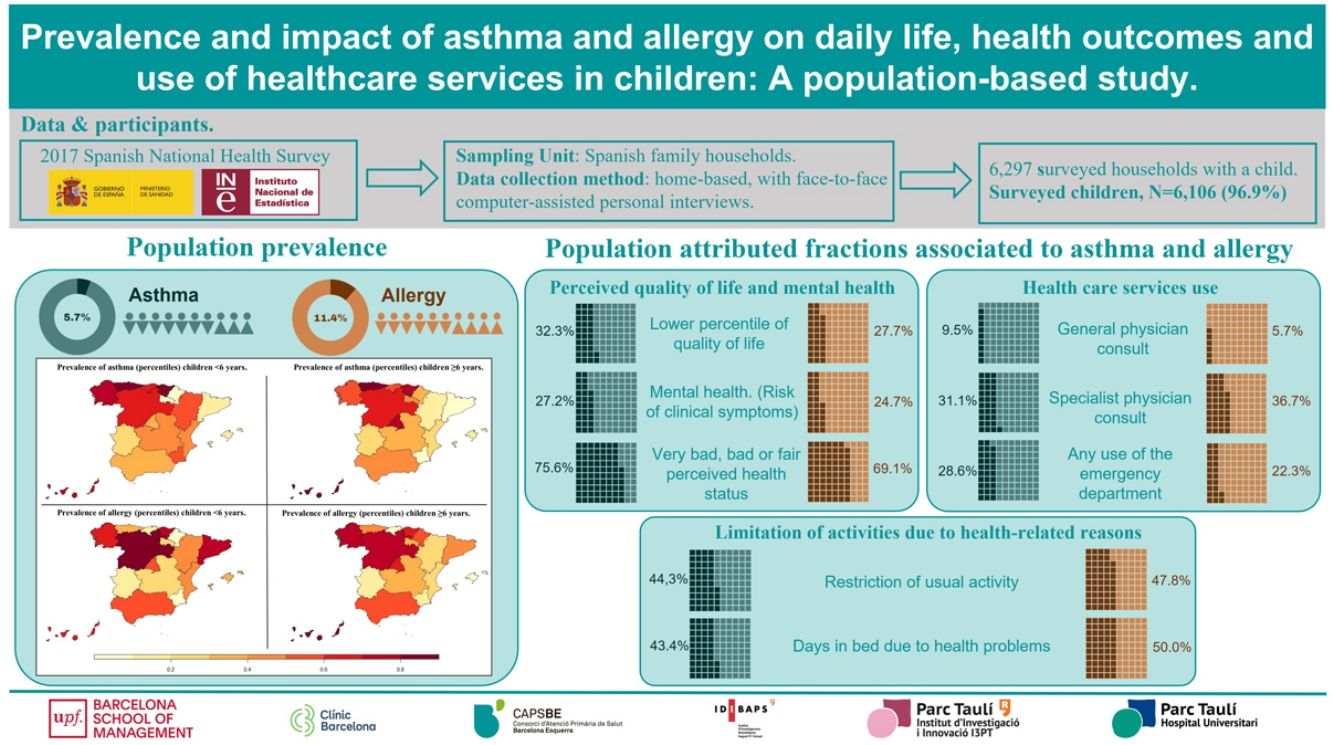
ResultsThe population prevalence of asthma was 5.7% (95% CI: 5.0%, 6.4%), and of allergy was 11.4% (95% CI: 10.5%, 12.4. In children with lower percentiles of health-related quality of life (≤20th), 32.3% (95% CI, 13.6%, 47.0%) was attributed to asthma and 27.7% (95% CI: 13.0%, 40.0%) to allergy. Forty-four percent of restrictions in usual activity were attributed to asthma (OR: 2.0, p-value: <0.001), and 47.9% to allergy (OR: 2.1, p-value: <0.001). 62.3% of all hospital admissions were attributed to asthma (OR: 2.8, p-value: <0.001), and 36.8% (OR: 2.5, p-value: <0.001) of all specialist consults to allergy.
ConclusionsThe high prevalence of atopic disease and its impact on daily life and healthcare utilization call for an integrated healthcare system focused on children and caregivers’ needs with continuity of care across education and healthcare settings.
Asthma and allergy often begin early in childhood and are sparked by genetic susceptibility and environmental factors. Allergic asthma is the most common asthma phenotype in children aged >1 year.1 Asthma has non-specific triggers: pollution, tobacco smoke, temperature and humidity, and specific triggers such as allergens. Asthma and atopic disease affect children's daily life, from the quality of life and school performance2 to sedentary lifestyles caused by breathing difficulties.3 Children with asthma and atopic disease are burdened by school absence due to hospital admissions, referrals to the emergency department and frequent physicians’ consults.4
The most recent study reported a prevalence of asthma in Europe of 11.7% in children aged 6–7 years, and 14.6% in children aged 13–14 years.5 In the Spanish sample, the mean prevalence of the two groups was 17.6%, but with considerable regional variations.6 The prevalence of allergic rhinitis, and food allergies are estimated at 6.5–24.6% in European children aged 7–10 years,7 and in Spain, a prevalence of hay fever of 13.7%.5
Examining the prevalence of asthma and allergy in children typically involves surveying parents about symptoms. Surveys allowed inclusion of large numbers of participants,8 but had the drawbacks of reduced external validity due to the design's lacked randomization and population representativeness. The study of the impact of asthma and allergy in children has focused on the severity of the disease.9 However, few studies have compared children with and without asthma or allergy to examine factors and outcomes associated with the impact on asthma and allergy. Therefore, in this study, we aimed (i) to determine the prevalence of asthma and allergies in Spanish children, (ii) to study the impact of asthma and allergy on the quality of life, mental health conditions, use of health care services compared to non-atopic children, and (iii) to examine the potential impact of environmental and household exposure factors on the population prevalence of asthma and allergy.
MethodsStudy designWe carried out a two-stage study: First, we examined the prevalence of asthma and allergy and described the characteristics of affected children in a representative sample of children living in Spanish households. Second, we made a matched cross-sectional to study the impact of asthma and allergy on daily life, perceived quality of life and health outcomes, and use of healthcare services and to association to environmental and household risk exposure factors.
Data source and contextThe Spanish National Health Survey (SNHS) is conducted periodically by the Ministry of Health, Consumer Affairs and Social Welfare and forms part of the National Health System Information System. SNHS data is a source of information for countrywide statistics on health, morbidity, the degree of access to and use of health services and health determinants of the population.10
The SNHS sample collects countrywide and regional samples and uses the family dwelling as the basic unit. Sampling is obtained using a multistage cluster method with proportional random selection with independent samples from Spanish regions. The survey is home-based, with face-to-face computer-assisted personal interviews with trained interviewers. The latest available data comes from 2017. The parents or caregivers providing information about the child's health were deemed to be sufficiently well-informed. This approach was adopted to bypass any limitations imposed on children's long-term events and their related consequences, as well as health and living conditions, and used adapted questionnaires. A total of 6297 children were surveyed, with a response rate of 97% and a refusal rate of 2.1%. Further methodological details are available in a separate publication,10 and tables containing sampling errors can be accessed online.11
Participants, main outcomes, and matching criteriaIn the first stage of the study, we analyzed data from children with a positive answers to the questions “Has your doctor ever told you your child has asthma (including allergic asthma)? and “Has your doctor ever told you your child has allergy, such as rhinitis, hay fever, eye inflammation, dermatitis, food allergy or other allergies (excluding allergic asthma)? While ICD-10 codes were not specified, the intention was to represent codes for asthma (J45) and status asthmaticus (J46), vasomotor and allergic rhinitis (J30), dermatitis and eczema (L20–L30 excluding L2: seborrheic dermatitis) and other allergies, irrespective of the origin.
In the second stage, the impact of asthma and allergy and associated exposure to risk factors were studied by matching four controls for each participant with asthma or allergy (4:1), respectively. Control participants were children completing the SNHS without asthma or allergy. Matching was made using propensity score analysis and the nearest neighbor criteria (Caliper=0.2, r=1:4). This method reduced confounding bias and dependence. It permitted a data set closer to that resulting from a block-randomized design. Matching criteria of controls were adjusted by covariates of age groups (<3, ≥3 to <6, ≥6 to <10, and ≥10 years), sex, any chronic diseases, size of the municipality, number of children in the household (1, 2 or >2), and social class according to the six- group classification adopted by the Spanish Society of Epidemiology, which is based on the occupation of the household reference person.12 Comparability on matched samples were guaranteed because differences in the variables selected were reduced to almost 0 from the pre-matched sample to the final matched (Figures A and B in the online appendix).
Study variablesThe characteristics of children with allergy and asthma were described according to sociodemographics, household characteristics, use of healthcare services, health insurance coverage, chronic diseases, special diet or food regimen, and medication consumption in the last two weeks. The impact of asthma and allergy was studied according to the perceived health-related quality of life, using the parent version of the Kidscreen-10 quality of life questionnaire.13 The proxy version of the questionnaire has demonstrated a strong correlation between children's self-report and parental reports. Mental health was measured with the emotional issues sub-module of the Strengths and Difficulties Questionnaire.14 Sedentarism was studied in children aged ≥6 years and obesity in children aged 2–17. Limitations in activities due to health-related reasons and days in bed due to health problems in the last two weeks, healthcare services and complementary medicine use in the last 12 months were studied. The impact of environmental and household exposures included poor quality drinking water and exposure to smoking indoors.
Statistical methodsThe prevalence of asthma and allergy was computed using the whole SNHS sample. Population estimates and 95% confidence intervals (CI) were calculated using weighting factors for the entire population and children aged <6 years and ≥6 years. Weighting factors are the number of children in the survey target population represented by the surveyed children. We computed independent prevalence estimates for the 18 Spanish regions. Differences in the regional distribution of asthma and allergy were examined using percentile ranks plotted on a map of Spanish regions.
To measure the impact of asthma and allergy on children and risk factors, we computed the population attributable fraction (PAF). This measure of impact estimates the disease burden attributable to that factor in the population. We computed groups of children with a lower health-related quality of life (≤20th percentile). In the case of the mental health questionnaire, groups were created according to the risk of clinical symptoms (score ≥4) according to Spanish norms.15 Self-perceived health status groups were according to the lower three categories of the rating scale used (bad, very bad, and fair). Additionally, we analyzed the strength of the association between controls and children with asthma or allergy with logistic regression models, and the results were reported using odds ratios (OR) and the corresponding p-value. In all analyses the level of statistical significance was set at α=0.05. All analyses were made using the R v.4.1.2.16
Ethical considerationsThe study used information from public sources including a public, anonymous dataset available in an online repository. Therefore, according to Spanish legislation and European Union rules, Ethics Committee approval was not needed.
ResultsWe found a prevalence of asthma of 5.7% (95% CI: 5.0%, 6.4%) and allergy of 11.4% (95% CI: 10.5%, 12.4%) in Spanish children. Asthma in children aged <6 years was 3.6% (95% CI: 2.8%, 5.0%) and 6.9% (95% CI: 6.0%, 8.0%) in children aged ≥6 years. Based on the age and Spanish regions, asthma in children aged <6 years varied from 8.8% in the Basque Country to 1.4% in Ceuta and Melilla. In children aged ≥6 years, it varied from 13.1% in the Canary Islands to 3.6% in Catalonia. The prevalence of allergy was 6.0% (95% CI: 4.8%, 7.0%) in children aged <6 years and 14.6% (95% CI: 13.3%, 16.0%) in children aged ≥6 years. Based on the age and Spanish regions, allergy in children <6 years varied from 11.8% in Ceuta and Melilla to 1.6% in the Region of Murcia. In children aged ≥6 years, it ranged from 26.0% in Ceuta and Melilla to 5.7% in Cantabria. The prevalence of atopic diseases and the estimated population by region are shown in tables A and B in the online appendix. Fig. 1 shows the prevalence based on percentile ranks of asthma and allergy in childhood by regions.
 in children aged <6 years (left side) and ≥6 years (right side), in Spain")
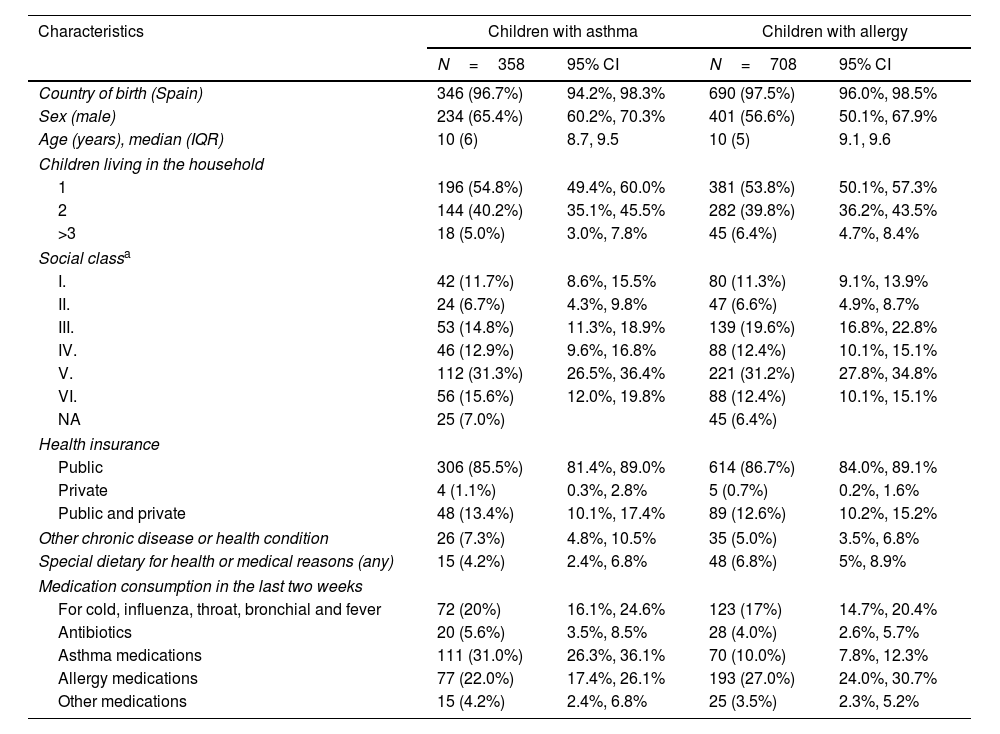
Table 1 shows the characteristics of children with asthma and allergies in the overall sample, including percentages and 95% confidence intervals. Most children with asthma were male (n=234, 65.4%). Half also reported a concurrent diagnosis of allergy (50.6%, 95% CI: 41.9%, 52.5%). Of children with allergy, almost half had no siblings (n=381, 53.8%) living in the household, and 25.6% reported an asthma diagnosis (95% CI: 22.4%, 29%). Among children with asthma, 31.0% (95% CI: 26.3, 36.1%) reported taking medication for asthma treatment in the last two weeks, while 27.0% (95% CI: 24.0%, 30.7%) of children with allergies reported taking medication for allergy treatment.
Characteristics of children with reported asthma and allergy.
| Characteristics | Children with asthma | Children with allergy | ||
|---|---|---|---|---|
| N=358 | 95% CI | N=708 | 95% CI | |
| Country of birth (Spain) | 346 (96.7%) | 94.2%, 98.3% | 690 (97.5%) | 96.0%, 98.5% |
| Sex (male) | 234 (65.4%) | 60.2%, 70.3% | 401 (56.6%) | 50.1%, 67.9% |
| Age (years), median (IQR) | 10 (6) | 8.7, 9.5 | 10 (5) | 9.1, 9.6 |
| Children living in the household | ||||
| 1 | 196 (54.8%) | 49.4%, 60.0% | 381 (53.8%) | 50.1%, 57.3% |
| 2 | 144 (40.2%) | 35.1%, 45.5% | 282 (39.8%) | 36.2%, 43.5% |
| >3 | 18 (5.0%) | 3.0%, 7.8% | 45 (6.4%) | 4.7%, 8.4% |
| Social classa | ||||
| I. | 42 (11.7%) | 8.6%, 15.5% | 80 (11.3%) | 9.1%, 13.9% |
| II. | 24 (6.7%) | 4.3%, 9.8% | 47 (6.6%) | 4.9%, 8.7% |
| III. | 53 (14.8%) | 11.3%, 18.9% | 139 (19.6%) | 16.8%, 22.8% |
| IV. | 46 (12.9%) | 9.6%, 16.8% | 88 (12.4%) | 10.1%, 15.1% |
| V. | 112 (31.3%) | 26.5%, 36.4% | 221 (31.2%) | 27.8%, 34.8% |
| VI. | 56 (15.6%) | 12.0%, 19.8% | 88 (12.4%) | 10.1%, 15.1% |
| NA | 25 (7.0%) | 45 (6.4%) | ||
| Health insurance | ||||
| Public | 306 (85.5%) | 81.4%, 89.0% | 614 (86.7%) | 84.0%, 89.1% |
| Private | 4 (1.1%) | 0.3%, 2.8% | 5 (0.7%) | 0.2%, 1.6% |
| Public and private | 48 (13.4%) | 10.1%, 17.4% | 89 (12.6%) | 10.2%, 15.2% |
| Other chronic disease or health condition | 26 (7.3%) | 4.8%, 10.5% | 35 (5.0%) | 3.5%, 6.8% |
| Special dietary for health or medical reasons (any) | 15 (4.2%) | 2.4%, 6.8% | 48 (6.8%) | 5%, 8.9% |
| Medication consumption in the last two weeks | ||||
| For cold, influenza, throat, bronchial and fever | 72 (20%) | 16.1%, 24.6% | 123 (17%) | 14.7%, 20.4% |
| Antibiotics | 20 (5.6%) | 3.5%, 8.5% | 28 (4.0%) | 2.6%, 5.7% |
| Asthma medications | 111 (31.0%) | 26.3%, 36.1% | 70 (10.0%) | 7.8%, 12.3% |
| Allergy medications | 77 (22.0%) | 17.4%, 26.1% | 193 (27.0%) | 24.0%, 30.7% |
| Other medications | 15 (4.2%) | 2.4%, 6.8% | 25 (3.5%) | 2.3%, 5.2% |
NA: Data not available.
I. Directors and managers of establishments with 10 or more employees and professionals traditionally associated with bachelor's university degrees. II. Directors and managers of establishments with fewer than 10 employees, professionals traditionally associated with diploma university degrees and other technical support professionals. Athletes and artists. III. Intermediate occupations: administrative employees and support professionals for administrative management and other services. IV. Supervisors and workers in skilled technical occupations. V. Skilled primary sector workers and other semi-skilled workers. VI. Unskilled workers.
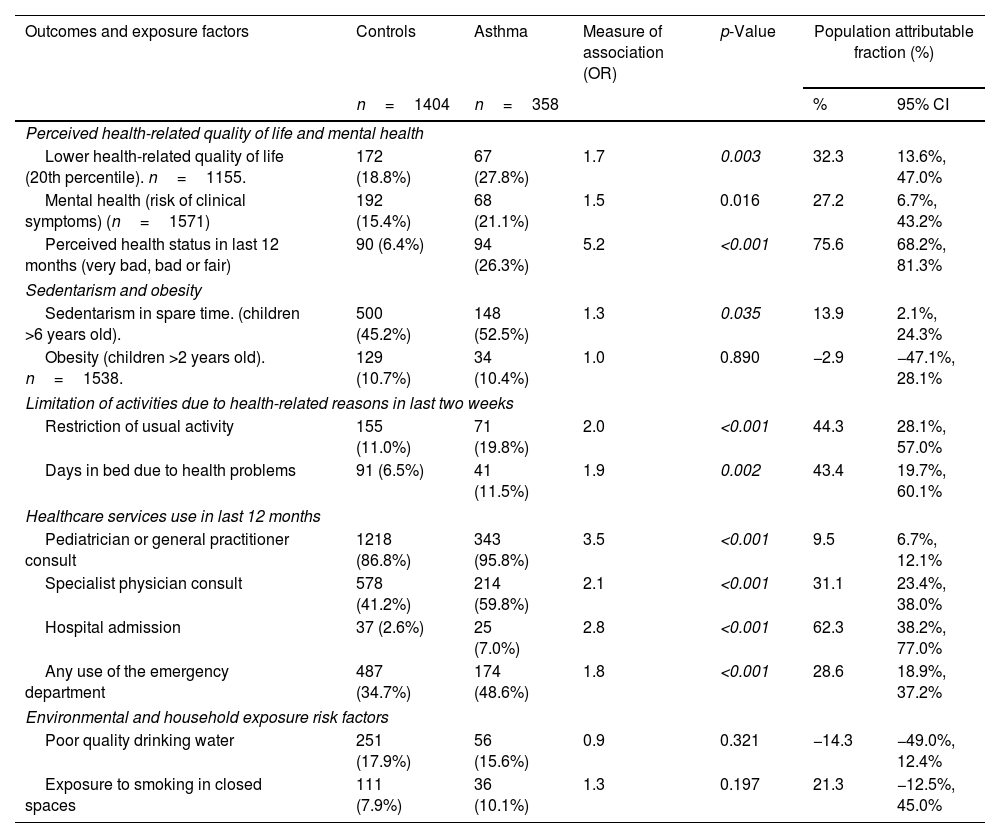
Thirty-two percent of children with a lower health-related quality of life were attributed to asthma (PAF=32.3%, 95% CI: 13.6%, 47.0%). Asthma had an associated PAF of 27.2% for the risk of clinical mental health symptoms (emotional dimension) and an attributed 75.6% for the worsened self-perceived health status in the last 12 months. A total of 13.9% of sedentarism in children aged >6 years (PAF 95% CI: 2.1%, 24.3%) was attributed to asthma but was not associated with obesity. The potential fraction of restrictions on usual activity due to asthma was 44.3% (PAF 95% CI: 28.1%, 57.0%), with 43.4% reporting days in bed due to health problems in the last two weeks (PAF 95% CI: 19.7%, 60.1%) attributed to asthma. All indicators of healthcare service use in the last 12 months showed high attributable fractions: 31.1% of pediatric specialist consults, and 62.3% of hospital admissions in the last 12 months were attributed to asthma. Exposure to smoking was found to have no significant association with asthma (OR: 1.3, p-value: 0.197). Table 2 presents the identified associations and the corresponding impact on asthma values.
Association and population attributable fractions of asthma on health outcomes.
| Outcomes and exposure factors | Controls | Asthma | Measure of association (OR) | p-Value | Population attributable fraction (%) | |
|---|---|---|---|---|---|---|
| n=1404 | n=358 | % | 95% CI | |||
| Perceived health-related quality of life and mental health | ||||||
| Lower health-related quality of life (20th percentile). n=1155. | 172 (18.8%) | 67 (27.8%) | 1.7 | 0.003 | 32.3 | 13.6%, 47.0% |
| Mental health (risk of clinical symptoms) (n=1571) | 192 (15.4%) | 68 (21.1%) | 1.5 | 0.016 | 27.2 | 6.7%, 43.2% |
| Perceived health status in last 12 months (very bad, bad or fair) | 90 (6.4%) | 94 (26.3%) | 5.2 | <0.001 | 75.6 | 68.2%, 81.3% |
| Sedentarism and obesity | ||||||
| Sedentarism in spare time. (children >6 years old). | 500 (45.2%) | 148 (52.5%) | 1.3 | 0.035 | 13.9 | 2.1%, 24.3% |
| Obesity (children >2 years old). n=1538. | 129 (10.7%) | 34 (10.4%) | 1.0 | 0.890 | −2.9 | −47.1%, 28.1% |
| Limitation of activities due to health-related reasons in last two weeks | ||||||
| Restriction of usual activity | 155 (11.0%) | 71 (19.8%) | 2.0 | <0.001 | 44.3 | 28.1%, 57.0% |
| Days in bed due to health problems | 91 (6.5%) | 41 (11.5%) | 1.9 | 0.002 | 43.4 | 19.7%, 60.1% |
| Healthcare services use in last 12 months | ||||||
| Pediatrician or general practitioner consult | 1218 (86.8%) | 343 (95.8%) | 3.5 | <0.001 | 9.5 | 6.7%, 12.1% |
| Specialist physician consult | 578 (41.2%) | 214 (59.8%) | 2.1 | <0.001 | 31.1 | 23.4%, 38.0% |
| Hospital admission | 37 (2.6%) | 25 (7.0%) | 2.8 | <0.001 | 62.3 | 38.2%, 77.0% |
| Any use of the emergency department | 487 (34.7%) | 174 (48.6%) | 1.8 | <0.001 | 28.6 | 18.9%, 37.2% |
| Environmental and household exposure risk factors | ||||||
| Poor quality drinking water | 251 (17.9%) | 56 (15.6%) | 0.9 | 0.321 | −14.3 | −49.0%, 12.4% |
| Exposure to smoking in closed spaces | 111 (7.9%) | 36 (10.1%) | 1.3 | 0.197 | 21.3 | −12.5%, 45.0% |
OR: odds ratio. Significant p-values are in italic.
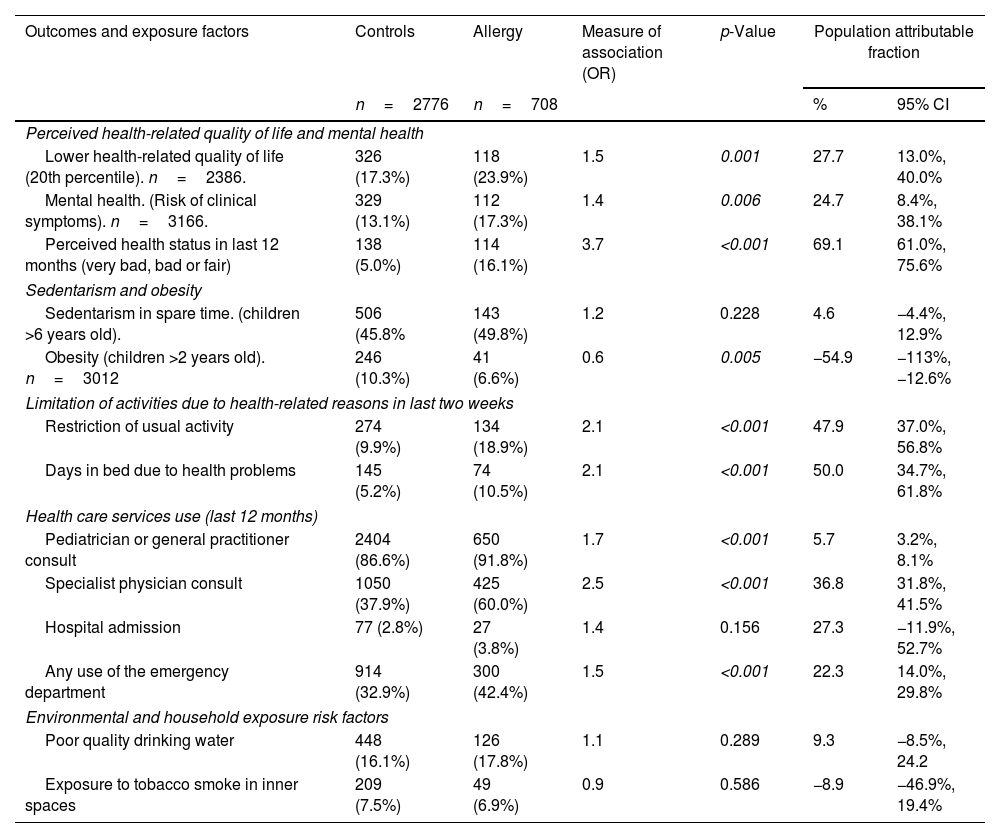
The impact of allergy on children's lower health related-quality of life and worse self-perceived health status in the last 12 months showed a PAF of 27.7% and 69.1%, respectively, and the PAF of the clinical symptoms of mental health was 24.7% (PAF 95% CI: 8.4%, 38.1%). Children with allergy had less obesity (10.3% vs. 6.6%). The attributable restriction of usual activity in the last two weeks due to allergy was 47.9% (PAF 95% CI: 37.0%, 56.8%), and an attributed 50.0% of days in bed due to health problems (PAF 95% CI: 34.7%, 61.8%). Potentially, 36.8% of all specialist consults and 22.3% of emergency department visits were attributed to allergy. Table 3 shows the associations and impact of allergy.
Association and population attributable fractions of allergy on health outcomes.
| Outcomes and exposure factors | Controls | Allergy | Measure of association (OR) | p-Value | Population attributable fraction | |
|---|---|---|---|---|---|---|
| n=2776 | n=708 | % | 95% CI | |||
| Perceived health-related quality of life and mental health | ||||||
| Lower health-related quality of life (20th percentile). n=2386. | 326 (17.3%) | 118 (23.9%) | 1.5 | 0.001 | 27.7 | 13.0%, 40.0% |
| Mental health. (Risk of clinical symptoms). n=3166. | 329 (13.1%) | 112 (17.3%) | 1.4 | 0.006 | 24.7 | 8.4%, 38.1% |
| Perceived health status in last 12 months (very bad, bad or fair) | 138 (5.0%) | 114 (16.1%) | 3.7 | <0.001 | 69.1 | 61.0%, 75.6% |
| Sedentarism and obesity | ||||||
| Sedentarism in spare time. (children >6 years old). | 506 (45.8% | 143 (49.8%) | 1.2 | 0.228 | 4.6 | −4.4%, 12.9% |
| Obesity (children >2 years old). n=3012 | 246 (10.3%) | 41 (6.6%) | 0.6 | 0.005 | −54.9 | −113%, −12.6% |
| Limitation of activities due to health-related reasons in last two weeks | ||||||
| Restriction of usual activity | 274 (9.9%) | 134 (18.9%) | 2.1 | <0.001 | 47.9 | 37.0%, 56.8% |
| Days in bed due to health problems | 145 (5.2%) | 74 (10.5%) | 2.1 | <0.001 | 50.0 | 34.7%, 61.8% |
| Health care services use (last 12 months) | ||||||
| Pediatrician or general practitioner consult | 2404 (86.6%) | 650 (91.8%) | 1.7 | <0.001 | 5.7 | 3.2%, 8.1% |
| Specialist physician consult | 1050 (37.9%) | 425 (60.0%) | 2.5 | <0.001 | 36.8 | 31.8%, 41.5% |
| Hospital admission | 77 (2.8%) | 27 (3.8%) | 1.4 | 0.156 | 27.3 | −11.9%, 52.7% |
| Any use of the emergency department | 914 (32.9%) | 300 (42.4%) | 1.5 | <0.001 | 22.3 | 14.0%, 29.8% |
| Environmental and household exposure risk factors | ||||||
| Poor quality drinking water | 448 (16.1%) | 126 (17.8%) | 1.1 | 0.289 | 9.3 | −8.5%, 24.2 |
| Exposure to tobacco smoke in inner spaces | 209 (7.5%) | 49 (6.9%) | 0.9 | 0.586 | −8.9 | −46.9%, 19.4% |
OR: odds ratio. Significant p-values are in italic.
Our results show the prevalence of asthma and allergy in children in Spain, with detailed geographical variations and the impact of diseases. Children with atopic disease had a worse perceived quality of life and mental health. Furthermore, a higher percentage of children with asthma or allergies reported being bedridden and experiencing greater limitations in their daily activities during the two weeks prior to the survey compared to children without these conditions. A significant fraction of the total use of health services was attributed exclusively to asthma and allergy.
Asthma and allergy prevalenceThe prevalence of asthma of 5.7% was found to be lower than expected. The ISAAC study reported a prevalence of asthma symptoms of 11.8% in children aged 6–7 years and 14.3% in those aged 13–14 years.6 The recent GAN Phase I study reported a prevalence of 13.6% in children and 21.6% in adolescents.5 The study of the prevalence of allergy disorders is difficult, as they are wide-ranging diseases. In Spain, the GAN phase I study reported that rhinitis in adolescents was 14.6% and 9.3% in children aged 6–7 years.5 However, we studied allergy, including rhinitis, hay fever, eye inflammation, dermatitis, food allergy and other allergies, and found estimate intervals ranging from 10.5% to 12.4%. The SNSH question on allergy did not specify types of allergies and, while this might be critical to the study of specific diseases, the results were not markedly different. The differences in the results of this study may be due to differences in data collection, sampling methods, and a limited age range. The most referenced studies in children with asthma have better internal validity, but the sampling methods hamper generalization. In this study, the reliability of the estimates obtained from the SNSH using weighting factors combined with the calculation of corresponding confidence intervals, allowed accurate estimates that reflect the target population and provide a measure of certainty associated with our findings. In our opinion, the results might complement other studies, which used other data collection methods, to provide accurate knowledge on the prevalence of atopic diseases.
Geographical differencesThe map of the prevalence of asthma and allergy in children shows four areas with differences in climate (sun, temperature and humidity) and exposure levels to seasonal and perennial allergens (e.g., pollens, molds or house dust mites)17: the most affected areas included the North (Atlantic and Cantabrian seas), the Center (including Madrid region) and the South (Canary Islands, and Ceuta and Melilla cities), while the Eastern region (Mediterranean) had a lower prevalence. While the asthma distribution across Spanish regions was similar to previous reports,5,6 the maps by region provide more detail.
Regional differences in the prevalence in children aged <6 and ≥6 years might represent difficulties in diagnosing asthma in pre-school children.18 To the clinical difficulty of diagnosing asthma in pre-school children it should be added that, after diagnosis, chronic drug treatment may be considered. Many physicians are cautious and prefer to use the terms “recurrent bronchitis”, bronchial hyperresponsiveness or wheezing instead of asthma.19 The results showed only 31% of children with a reported diagnosis of asthma had taken medicines in the last two weeks. This result suggests that the SNSH detected children with mild asthma (and well-controlled asthma with as-needed drug treatment)20; however, low adherence to drug treatment in asthma is >50% in diagnosed children and might be the cause of this low percentage.
Environmental and household exposure risk factorsWhile our study did not find a significant association between exposure to indoor smoking and the development of asthma or allergies, this counterintuitive result is not surprising: parental reporting of children's tobacco smoke exposure is prone to measurement errors, social desirability bias, inaccurate memory, or a misunderstanding of actual exposure.21 Furthermore, although our study did not find a statistically significant association between water quality and the risk of asthma and allergies, it remains crucial to monitor the increasing prevalence of allergic sensitization in countries where tap water is treated with trihalomethanes or chlorination because of drinking water is an environmental factor potentially linked to the development of atopic diseases.22
Impact on daily lifeTaking the results of the impact of asthma and allergy together with the limitations in usual activities, a reduction in perceived health-related quality of life and the use of healthcare services shows the repercussions of atopic disorders. The study revealed that, at the population level, asthma and allergy diseases were associated with a significant attributable fraction of risk for mental health and quality of life outcomes. Traditionally, research has focused primarily on the severity of these conditions in relation to the quality of life,9 and the extent compared to the healthy population was not examined. However, studying the differences between diseased and healthy populations is crucial for understanding the impact of diseases on the lives of children, assessing the disease burden, and facilitating informed public health decision-making in the field of healthcare. A US population-based study reported that the risk of school absenteeism in children with uncontrolled asthma as double that of those with controlled asthma.23 Another study also showed an association between hospitalization caused by asthma and the risk of not achieving the minimum education attainment for numeracy and reading.24 This emphasizes the need for community interventions on asthma and allergy (e.g., training of teachers and educators on atopic disorders). The atopic disease's varying complexity requires continuity of care across all health and social care settings to focus children's care needs, which might improve with an integrated care approach focusing on patient needs.25 In Spain, primary healthcare physicians and pediatricians act as gatekeepers of the healthcare system, although a central role between community and hospital would be more efficient.26 As the Global Initiative for Asthma guidelines state, successful care requires partnership between patients, caregivers, and healthcare professionals.20
LimitationsWhile the reliability of the study depends on the power of the large sample size and the sampling methods, it also had limitations. First, the results may be affected by parental recall bias: however, we analyzed only the item focused on the diagnosis made by a physician and given that, in Spain, children's health is important to parents or caregivers and public health authorities, we believe this potential bias is low. Second, in two small regions (La Rioja and Navarra) no cases of asthma were reported in children aged <6 years. This could be attributed to the challenge of diagnosing asthma in pre-school children, as previously mentioned, as well as the diversity of protocols followed across different regions, along with the difficulties faced by primary care physicians and pediatricians in referring cases to specialists. Nevertheless, the fact that these geographic variations align with other studies indicates that policy-makers at a regional level should explore clinical procedures in children of this age group. Furthermore, online sampling error tables facilitate the examination of the reliability estimates of this study.11 The method of questioning might be criticized because items did not follow strict definitions of asthma and allergy and only asked about diagnoses made by a physician, not symptoms or signs. While the SNHS data is a reference for EU figures, the questions on these two items might be improved.
ConclusionThis population-based study of children reported the prevalence of asthma and allergies in Spain and provided complementary figures on geographic variability. The study shows that children with asthma and allergies had a worse perceived health status, quality of life, mental health, significant use of healthcare services, and restrictions in activities of daily living. This is a realistic illustration of the impact of asthma and allergies on children's lives, giving a new perspective to help physicians and public health authorities design new and effective policies.
Availability of data and materialThe data that support the findings of this study are openly available in the National Health Survey microdata repository at https://www.ine.es/dyngs/INEbase/en/operacion.htm?c=Estadistica_C&cid=1254736176783&menu=resultados&idp=1254735573175#!tabs-1254736195295.
FundingThe authors received no financial support for the research, authorship, and/or publication of this article.
Conflict of interestsThe authors declare no conflicts of interest.
We thank the Spanish Health Ministry and the National Statistics Institute for data available from the Spanish National Health Survey and David Buss and Dr. Belchin Kostov for technical assistance.
The following are the supplementary data to this article:


