


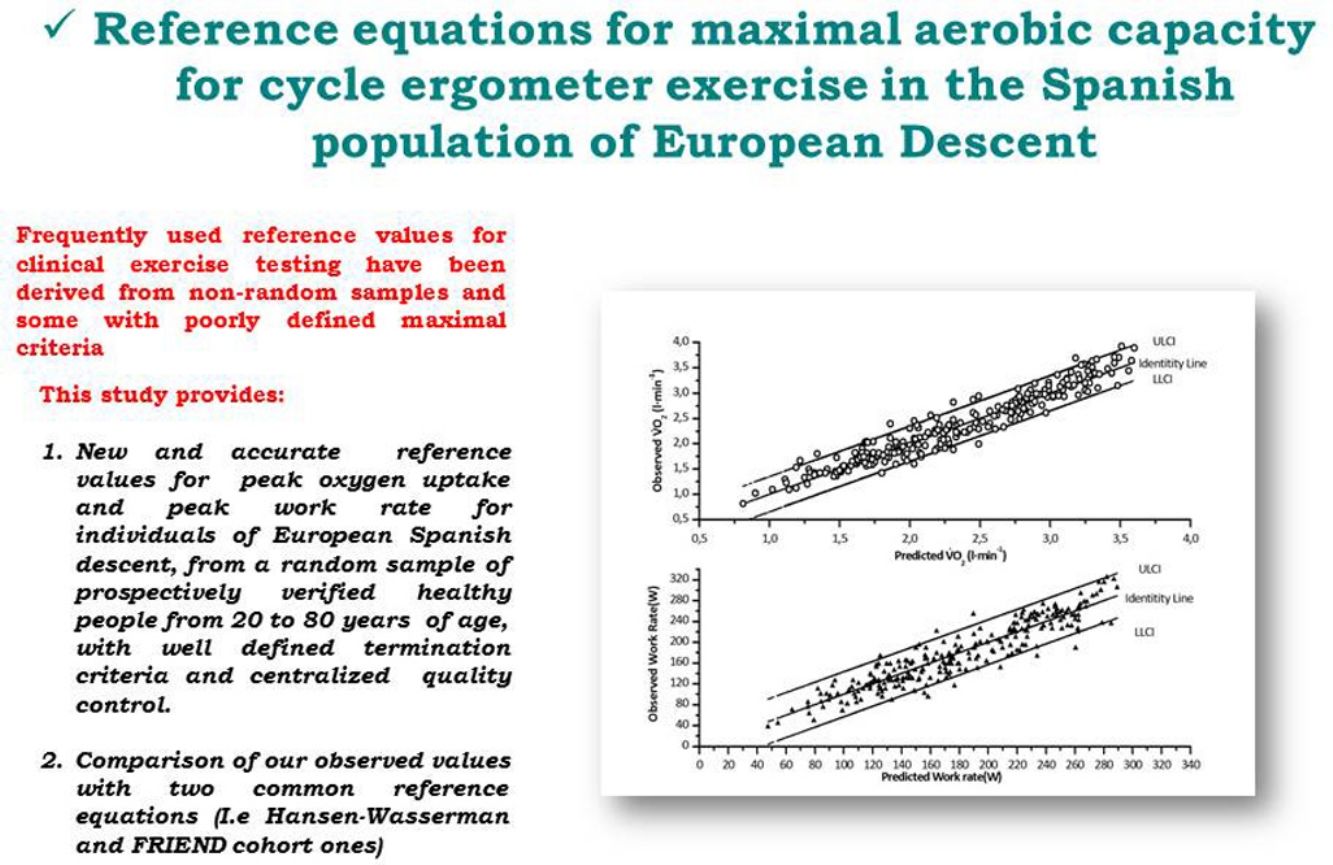
Frequently used reference values for clinical exercise testing have been derived from non-random samples and some with poorly defined maximal criteria.
Our objective was to obtain population based reference values for peak oxygen uptake (V?O2) and work rate (WR) for cardiopulmonary exercise testing in a representative sample of Caucasian Spanish men and women.
Methods182 men and women, 20–85 years old, were included and exercised on cycle-ergometer to exhaustion. (V?O2) and WR were measured. The equations obtained from this sample were validated in an independent cohort of 69 individuals, randomly sampled form the same population. Then a final equation merging the two cohorts (=251) was produced.
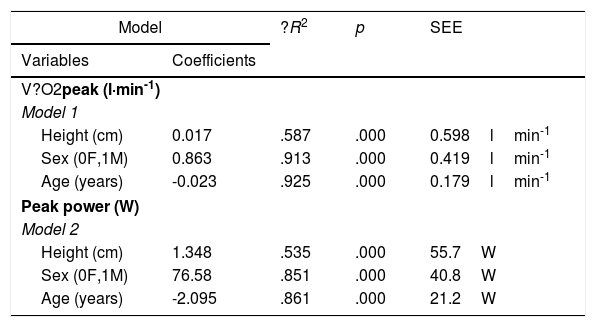
ResultsHeight, sex and age resulted predictive of both V?O2 peak and WR. Weight and physical activity added very little to the accuracy to the equations. The formulas V?O2peak=0.017·height?(cm)-0.023·age?(years)+0.864·sex?(female=0/male=1)±179?l?min-1, and peak WR=1.345 · height (cm) - 2.074 · age (years)+76.54 · sex (female=0/male=1)±21.2W were the best compromise between accuracy and parsimony.
ConclusionsThis study provides new and accurate V?O2 peak and WR rate reference values for individuals of European Spanish descent.
Los valores de referencia utilizados con frecuencia para las pruebas de esfuerzo clínicas derivan de muestras no aleatorias y los criterios máximos para algunos de ellos están mal definidos.
Nuestro objetivo fue obtener valores de referencia basados en la población general para el consumo máximo de oxígeno (VO2) y la carga de trabajo (CT) para las pruebas de ejercicio cardiopulmonar a partir de una muestra representativa de varones y mujeres caucásicos españoles.
MétodosSe incluyeron 182 varones y mujeres, de entre 20 y 85 años, que realizaron ejercicio en el cicloergómetro hasta el agotamiento. Se midieron el VO2 y la CT. Las ecuaciones obtenidas de esta muestra se validaron en una cohorte independiente de 69 individuos, seleccionados aleatoriamente de la misma población. A continuación, se creó una ecuación final que fusionó las dos cohortes (n=251).
ResultadosLa altura, el sexo y la edad resultaron predictivos tanto del V?O2 máximo como de la CT. El peso y la actividad física contribuyeron muy poco a la precisión de las ecuaciones. Las fórmulas V?O2 máximo=0,017×altura (cm)-0,023×edad (años)+0,864×sexo (mujer=0/varón=1)±179 L×min-1; y CT máxima=1,345×altura (cm)-2,074×edad (años)+76,54×sexo (mujer=0/varón=1)±21,2W fueron el mejor equilibrio entre precisión y parsimonia.
ConclusionesEste estudio proporciona valores de referencia del V?O2 máximo y la CT nuevos y precisos para personas de ascendencia española europea.
The measurement of exercise capacity has numerous clinical applications, including risk stratification, evaluation of therapies efficacy in patients with cardiovascular or pulmonary disease and assessment of perioperative risk or disability.1 Cardiopulmonary exercise testing (CPET) is an excellent tool for the evaluation of exercise capacity both in healthy subjects and in patients with various conditions since the physiological response can be measured along the whole spectrum of exercise domains in a compact format.2 The main goal of incremental CPET is to stress the organ systems contributing to exercise performance to its maximum or else to a level at which a would-be abnormality becomes discernible from the expected responses. The interpretation of the results, then, is based on both detecting deviations from the normal response of a matched standard population, determining its magnitude and identifying specific patterns pointing to the cause of limitation.3 In order to establish “abnormality”, however, it is crucial to have representative frames of reference allowing the interpretation of the appropriateness (or lack of) of the systemic responses to exertion. This is not a trivial task in the nonathletic subject as there are multiple potential confounding factors, such as the level of regular physical activity, the ethnic and health backgrounds and other factors that can influence exercise capacity.
When examining reference values from the literature, a number of aspects should be pondered. On the one hand one will want to be sure that the sample is representative of the population to which the standard values will be applied. This goal is primarily linked to how carefully the sampling method and factors such as ethnicity, sex, age and screening criteria for healthy participants have been considered. On the other hand important technical aspects such as quality assurance, peak criteria and smoothing of the raw signal have to be also thoroughly pondered.4 Recruitment should preferably be community based rather than hospital based and random selection will be preferable to convenience recruiting in order to avoid potential biases when individuals are drafted from accessible populations.4,5
While several cycle-ergometer values for peak exercise response have been published,4,5 only a few are based in random samples of the targeted population and have been prospectively obtained with a centralized quality control. In addition, the samples used in many of them did they meet the ATS/ACCP recommendations for reference subjects.4
The main aim of the present work is to produce peak exercise values from a randomly selected community based population of healthy, south-European (Spanish) ancestry. A secondary objective was to compare our equations with two sets of frequently used reference values.6–10
MethodsParticipants were recruited from the telephone directory by a market research company (IPSOS, Madrid, Spain). The sampling was randomly performed and stratified so that half were men and half women and a similar number of subjects of the following age groups 18–29, 30–49, 50–69 were included. Individuals >70 years were recruited at an association dedicated to encourage physical activity among the elderly, promoted by a primary care center of the public health system. Inclusion criteria are described in the Annex 1, in summary, healthy never-smokers>18 years, with no history of acute (in the last 3 monts) or chronic diseases (except for mild essential hypertension, see annex 1) and not using any treatment that could influence exercise performance, were enrolled.
To achieve a power of 80%, anticipating that up to six independent variables could explain at least 30% of the variability (R2>0.3), with an a-error=0.05, two-tailed the minimum necessary sample size was 155. In addition 65 individuals were needed for the validation cohort to detect bilateral differences of 7%4 with a t-Student test, assuming an a-error=0.05 and a statistical power of 80%.
The study was approved by the human research ethics committee of each center, and performed according to the applicable regulations. All the participants signed an informed consent before being enrolled.
CPET were carried out on electromagnetically-braked cycle-ergometers (Annex 1).4 Consisted of a 2–3min resting period, followed by 3min of unload pedaling after which the WR was progressively (ramp-wise) increased. The ramp speed was calculated for a test duration of about 10min.4 Participants wore a low dead-space face mask. V?O2 and carbon dioxide production (V?CO2) were measured in standard temperature and pressure dry (STPD) lmin-1. Data were averaged every 10s and corrected for the dead-space of the mask. Criteria for a peak test were the observation of a V?O2 plateau or a respiratory exchange ratio (RER)>1.05 together with a heart rate>90% of predicted (220-agein years) and the observation of a good subject performance. The last 10s average was considered to be the subject's peak V?O2.
Exercise tests were done in eight experienced laboratories from 4 regions of Spain (Andalucía, Basque country, Catalonia and Madrid) between January 2015 and April 2018. Quality control (QC) was carried out according to published recommendations11 (Annex 1). Biological controls tests from each lab were approved by a centralized QC reviewer.
Previous week physical activity was estimated in metabolic equivalents of task (METs) by means of the international physical activity questionnaire (IPAQ-27).12
Statistical analysisPredictive equations were developed using linear regression (Annex 1). For comparison we used the Hansen–Wasserman's6,7 and the Fitness Registry and the Importance of Exercise National Database (FRIEND) equations for cycle-ergometer.8–10
ResultsThree hundred and nine individuals were eligible. From them 38 were excluded because they acknowledged to be smokers or had high carboxyhemoglobin levels, 13 had low hemoglobin blood concentrations, 12 had restrictive or obstructive spirometries, 4 had a BMI>35kgm-2). Eighteen additional individuals (6.6%) did not perform a good effort and were excluded from the analysis.
Two hundred and fifty-one individuals were analyzed, 182 constituted the generation cohort and 69 the validation cohort. There were 122 (48.6%) female and 129 (51.2%) male in the generation cohort and 34 (49.3%) and 35 (50.7%) male and female respectively in the validation cohort (Table S2).
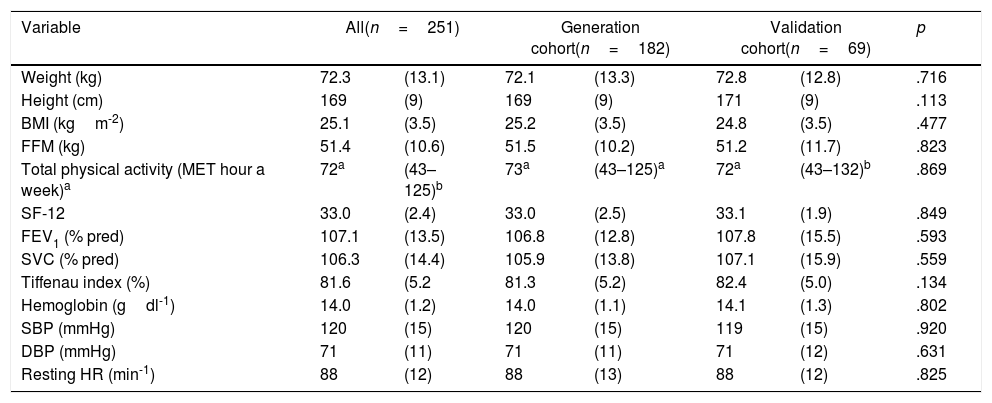
According to the IPAQ-27, 3 (1.2%) referred low physical activity, 71 (28.6%) moderate physical activity and 174 (70.2%) high physical activity (Table S3). There were no differences in age, sex, weight, body mass index (BMI), free fatty mass, physical activity, vital signs, spirometric values or blood hemoglobin concentration (Table 1 and S1–S5).
Description of the cohorts.
| Variable | All(n=251) | Generation cohort(n=182) | Validation cohort(n=69) | p | |||
|---|---|---|---|---|---|---|---|
| Weight (kg) | 72.3 | (13.1) | 72.1 | (13.3) | 72.8 | (12.8) | .716 |
| Height (cm) | 169 | (9) | 169 | (9) | 171 | (9) | .113 |
| BMI (kgm-2) | 25.1 | (3.5) | 25.2 | (3.5) | 24.8 | (3.5) | .477 |
| FFM (kg) | 51.4 | (10.6) | 51.5 | (10.2) | 51.2 | (11.7) | .823 |
| Total physical activity (MET hour a week)a | 72a | (43–125)b | 73a | (43–125)a | 72a | (43–132)b | .869 |
| SF-12 | 33.0 | (2.4) | 33.0 | (2.5) | 33.1 | (1.9) | .849 |
| FEV1 (% pred) | 107.1 | (13.5) | 106.8 | (12.8) | 107.8 | (15.5) | .593 |
| SVC (% pred) | 106.3 | (14.4) | 105.9 | (13.8) | 107.1 | (15.9) | .559 |
| Tiffenau index (%) | 81.6 | (5.2 | 81.3 | (5.2) | 82.4 | (5.0) | .134 |
| Hemoglobin (gdl-1) | 14.0 | (1.2) | 14.0 | (1.1) | 14.1 | (1.3) | .802 |
| SBP (mmHg) | 120 | (15) | 120 | (15) | 119 | (15) | .920 |
| DBP (mmHg) | 71 | (11) | 71 | (11) | 71 | (12) | .631 |
| Resting HR (min-1) | 88 | (12) | 88 | (13) | 88 | (12) | .825 |
BMI: body mass index, DBP: diastolic blood pressure, FEV1: forced expiratory volume in 1st second, FFM: free fatty mass, HR: heart rate, MET: metabolic equivalent of task, pred: predicted, SBP: systolic blood pressure, SF-12 Short form 12 questionnaire of Overall Quality-of-Life Status.
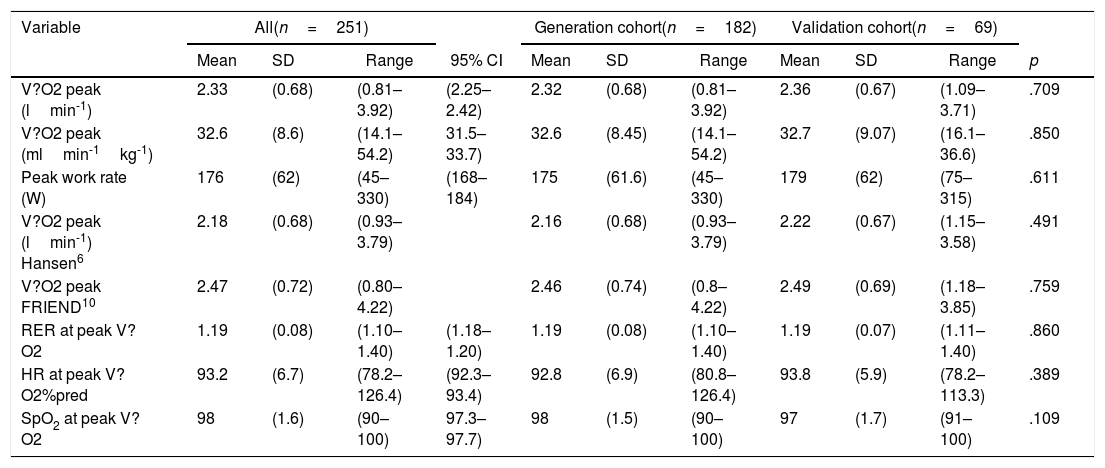
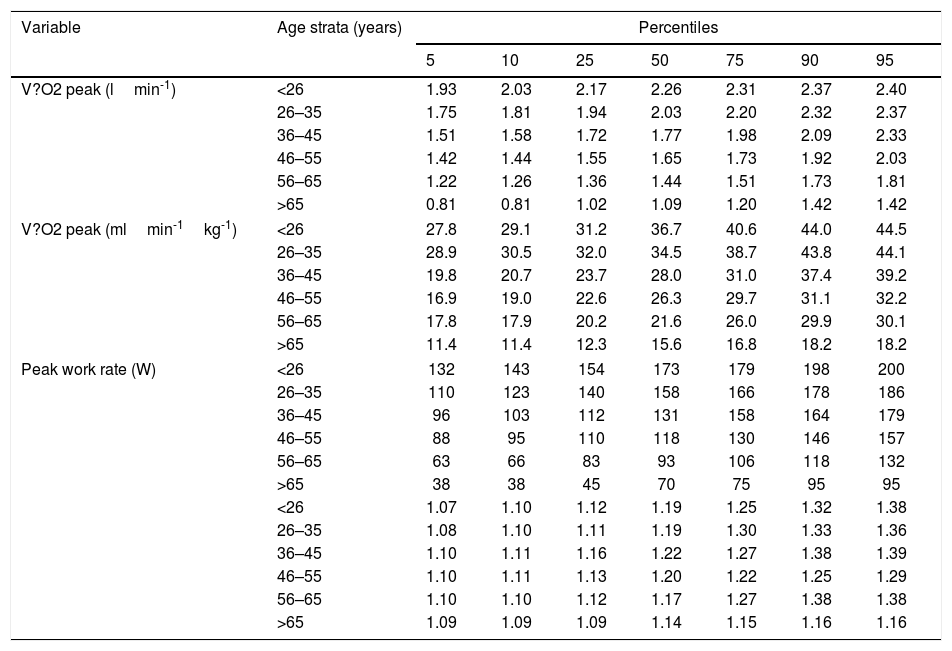
No differences were observed between the two cohorts in the variables characterizing maximal exercise performance (Table 2). The percentiles of these variables by age strata pre presented in Tables 5 and 6 and S7.
Peak exercise values for the generation and validation cohorts.
| Variable | All(n=251) | Generation cohort(n=182) | Validation cohort(n=69) | ||||||||
|---|---|---|---|---|---|---|---|---|---|---|---|
| Mean | SD | Range | 95% CI | Mean | SD | Range | Mean | SD | Range | p | |
| V?O2 peak (lmin-1) | 2.33 | (0.68) | (0.81–3.92) | (2.25–2.42) | 2.32 | (0.68) | (0.81–3.92) | 2.36 | (0.67) | (1.09–3.71) | .709 |
| V?O2 peak (mlmin-1kg-1) | 32.6 | (8.6) | (14.1–54.2) | 31.5–33.7) | 32.6 | (8.45) | (14.1–54.2) | 32.7 | (9.07) | (16.1–36.6) | .850 |
| Peak work rate (W) | 176 | (62) | (45–330) | (168–184) | 175 | (61.6) | (45–330) | 179 | (62) | (75–315) | .611 |
| V?O2 peak (lmin-1) Hansen6 | 2.18 | (0.68) | (0.93–3.79) | 2.16 | (0.68) | (0.93–3.79) | 2.22 | (0.67) | (1.15–3.58) | .491 | |
| V?O2 peak FRIEND10 | 2.47 | (0.72) | (0.80–4.22) | 2.46 | (0.74) | (0.8–4.22) | 2.49 | (0.69) | (1.18–3.85) | .759 | |
| RER at peak V?O2 | 1.19 | (0.08) | (1.10–1.40) | (1.18–1.20) | 1.19 | (0.08) | (1.10–1.40) | 1.19 | (0.07) | (1.11–1.40) | .860 |
| HR at peak V?O2%pred | 93.2 | (6.7) | (78.2–126.4) | (92.3–93.4) | 92.8 | (6.9) | (80.8–126.4) | 93.8 | (5.9) | (78.2–113.3) | .389 |
| SpO2 at peak V?O2 | 98 | (1.6) | (90–100) | 97.3–97.7) | 98 | (1.5) | (90–100) | 97 | (1.7) | (91–100) | .109 |
CI: confidence interval, HR: heart rate, RER: respiratory exchange ratio, SpO2: arteria blood oxygen saturation by pulse-oximetry, V?CO2: carbon dioxide oputput, V?E: minute ventilation, V?O2: oxygen uptake, pred: predicted.
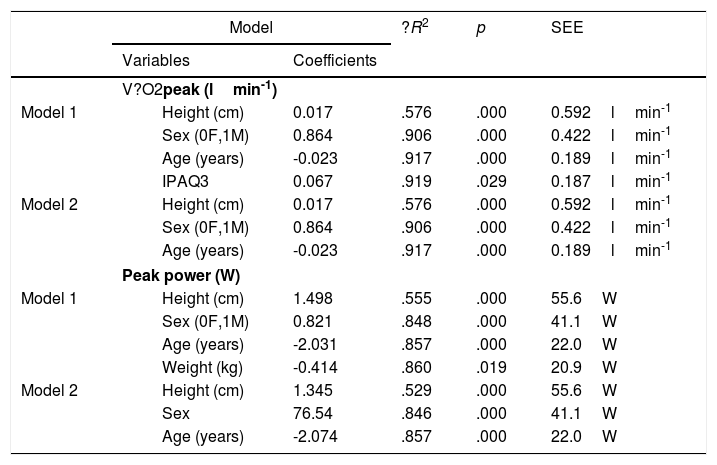
Explicative models of V?O2 peak (lmin-1) and Peak work rater (W) derived from the generation cohort.
| Model | ?R2 | p | SEE | ||
|---|---|---|---|---|---|
| Variables | Coefficients | ||||
| V?O2peak (lmin-1) | |||||
| Model 1 | Height (cm) | 0.017 | .576 | .000 | 0.592lmin-1 |
| Sex (0F,1M) | 0.864 | .906 | .000 | 0.422lmin-1 | |
| Age (years) | -0.023 | .917 | .000 | 0.189lmin-1 | |
| IPAQ3 | 0.067 | .919 | .029 | 0.187lmin-1 | |
| Model 2 | Height (cm) | 0.017 | .576 | .000 | 0.592lmin-1 |
| Sex (0F,1M) | 0.864 | .906 | .000 | 0.422lmin-1 | |
| Age (years) | -0.023 | .917 | .000 | 0.189lmin-1 | |
| Peak power (W) | |||||
| Model 1 | Height (cm) | 1.498 | .555 | .000 | 55.6W |
| Sex (0F,1M) | 0.821 | .848 | .000 | 41.1W | |
| Age (years) | -2.031 | .857 | .000 | 22.0W | |
| Weight (kg) | -0.414 | .860 | .019 | 20.9W | |
| Model 2 | Height (cm) | 1.345 | .529 | .000 | 55.6W |
| Sex | 76.54 | .846 | .000 | 41.1W | |
| Age (years) | -2.074 | .857 | .000 | 22.0W | |
V?O2: oxygen uptake, IPAQ3: Level 3 (very active) of the international physical activity questionnaire-27, F: female, M: male, SEE: standard error of the estimate.
Explicative models of V?O2 peak (lmin-1) and Peak work rate, whole cohort.
| Model | ?R2 | p | SEE | |
|---|---|---|---|---|
| Variables | Coefficients | |||
| V?O2peak (l·min-1) | ||||
| Model 1 | ||||
| Height (cm) | 0.017 | .587 | .000 | 0.598lmin-1 |
| Sex (0F,1M) | 0.863 | .913 | .000 | 0.419lmin-1 |
| Age (years) | -0.023 | .925 | .000 | 0.179lmin-1 |
| Peak power (W) | ||||
| Model 2 | ||||
| Height (cm) | 1.348 | .535 | .000 | 55.7W |
| Sex (0F,1M) | 76.58 | .851 | .000 | 40.8W |
| Age (years) | -2.095 | .861 | .000 | 21.2W |
V?O2: oxygen uptake, IPAQ3: Level 3 (very active) of the international physical activity questionnaire-27, F: female, M: male, SEE: standard error of the estimate
Peak exercise variable percentiles by age in women.
| Variable | Age strata (years) | Percentiles | ||||||
|---|---|---|---|---|---|---|---|---|
| 5 | 10 | 25 | 50 | 75 | 90 | 95 | ||
| V?O2 peak (lmin-1) | <26 | 1.93 | 2.03 | 2.17 | 2.26 | 2.31 | 2.37 | 2.40 |
| 26–35 | 1.75 | 1.81 | 1.94 | 2.03 | 2.20 | 2.32 | 2.37 | |
| 36–45 | 1.51 | 1.58 | 1.72 | 1.77 | 1.98 | 2.09 | 2.33 | |
| 46–55 | 1.42 | 1.44 | 1.55 | 1.65 | 1.73 | 1.92 | 2.03 | |
| 56–65 | 1.22 | 1.26 | 1.36 | 1.44 | 1.51 | 1.73 | 1.81 | |
| >65 | 0.81 | 0.81 | 1.02 | 1.09 | 1.20 | 1.42 | 1.42 | |
| V?O2 peak (mlmin-1kg-1) | <26 | 27.8 | 29.1 | 31.2 | 36.7 | 40.6 | 44.0 | 44.5 |
| 26–35 | 28.9 | 30.5 | 32.0 | 34.5 | 38.7 | 43.8 | 44.1 | |
| 36–45 | 19.8 | 20.7 | 23.7 | 28.0 | 31.0 | 37.4 | 39.2 | |
| 46–55 | 16.9 | 19.0 | 22.6 | 26.3 | 29.7 | 31.1 | 32.2 | |
| 56–65 | 17.8 | 17.9 | 20.2 | 21.6 | 26.0 | 29.9 | 30.1 | |
| >65 | 11.4 | 11.4 | 12.3 | 15.6 | 16.8 | 18.2 | 18.2 | |
| Peak work rate (W) | <26 | 132 | 143 | 154 | 173 | 179 | 198 | 200 |
| 26–35 | 110 | 123 | 140 | 158 | 166 | 178 | 186 | |
| 36–45 | 96 | 103 | 112 | 131 | 158 | 164 | 179 | |
| 46–55 | 88 | 95 | 110 | 118 | 130 | 146 | 157 | |
| 56–65 | 63 | 66 | 83 | 93 | 106 | 118 | 132 | |
| >65 | 38 | 38 | 45 | 70 | 75 | 95 | 95 | |
| <26 | 1.07 | 1.10 | 1.12 | 1.19 | 1.25 | 1.32 | 1.38 | |
| 26–35 | 1.08 | 1.10 | 1.11 | 1.19 | 1.30 | 1.33 | 1.36 | |
| 36–45 | 1.10 | 1.11 | 1.16 | 1.22 | 1.27 | 1.38 | 1.39 | |
| 46–55 | 1.10 | 1.11 | 1.13 | 1.20 | 1.22 | 1.25 | 1.29 | |
| 56–65 | 1.10 | 1.10 | 1.12 | 1.17 | 1.27 | 1.38 | 1.38 | |
| >65 | 1.09 | 1.09 | 1.09 | 1.14 | 1.15 | 1.16 | 1.16 | |
RER: respiratory exchange ratio, V?O2: oxygen uptake.
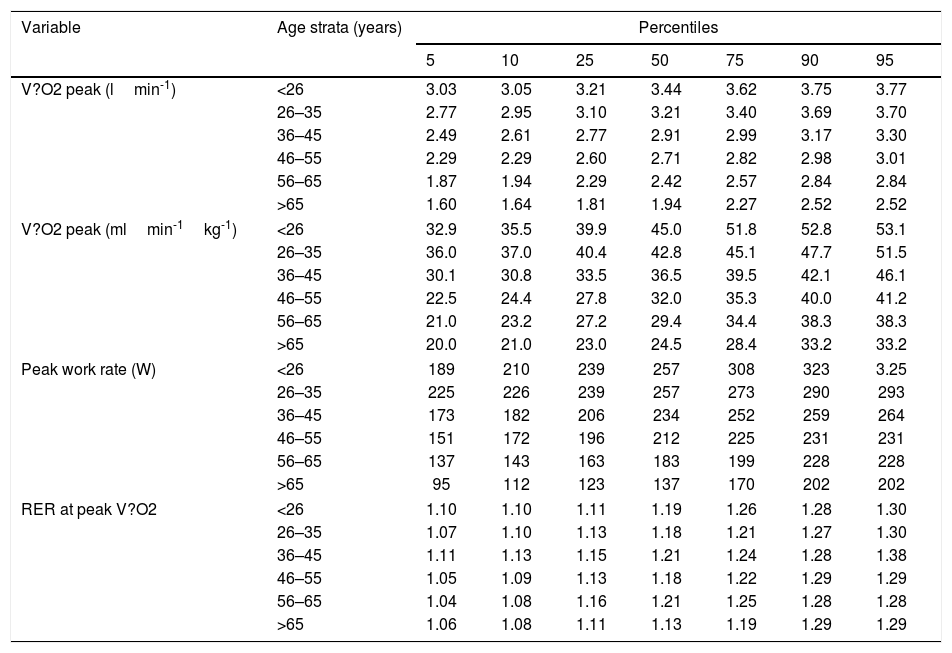
Peak exercise variable percentiles by age in men.
| Variable | Age strata (years) | Percentiles | ||||||
|---|---|---|---|---|---|---|---|---|
| 5 | 10 | 25 | 50 | 75 | 90 | 95 | ||
| V?O2 peak (lmin-1) | <26 | 3.03 | 3.05 | 3.21 | 3.44 | 3.62 | 3.75 | 3.77 |
| 26–35 | 2.77 | 2.95 | 3.10 | 3.21 | 3.40 | 3.69 | 3.70 | |
| 36–45 | 2.49 | 2.61 | 2.77 | 2.91 | 2.99 | 3.17 | 3.30 | |
| 46–55 | 2.29 | 2.29 | 2.60 | 2.71 | 2.82 | 2.98 | 3.01 | |
| 56–65 | 1.87 | 1.94 | 2.29 | 2.42 | 2.57 | 2.84 | 2.84 | |
| >65 | 1.60 | 1.64 | 1.81 | 1.94 | 2.27 | 2.52 | 2.52 | |
| V?O2 peak (mlmin-1kg-1) | <26 | 32.9 | 35.5 | 39.9 | 45.0 | 51.8 | 52.8 | 53.1 |
| 26–35 | 36.0 | 37.0 | 40.4 | 42.8 | 45.1 | 47.7 | 51.5 | |
| 36–45 | 30.1 | 30.8 | 33.5 | 36.5 | 39.5 | 42.1 | 46.1 | |
| 46–55 | 22.5 | 24.4 | 27.8 | 32.0 | 35.3 | 40.0 | 41.2 | |
| 56–65 | 21.0 | 23.2 | 27.2 | 29.4 | 34.4 | 38.3 | 38.3 | |
| >65 | 20.0 | 21.0 | 23.0 | 24.5 | 28.4 | 33.2 | 33.2 | |
| Peak work rate (W) | <26 | 189 | 210 | 239 | 257 | 308 | 323 | 3.25 |
| 26–35 | 225 | 226 | 239 | 257 | 273 | 290 | 293 | |
| 36–45 | 173 | 182 | 206 | 234 | 252 | 259 | 264 | |
| 46–55 | 151 | 172 | 196 | 212 | 225 | 231 | 231 | |
| 56–65 | 137 | 143 | 163 | 183 | 199 | 228 | 228 | |
| >65 | 95 | 112 | 123 | 137 | 170 | 202 | 202 | |
| RER at peak V?O2 | <26 | 1.10 | 1.10 | 1.11 | 1.19 | 1.26 | 1.28 | 1.30 |
| 26–35 | 1.07 | 1.10 | 1.13 | 1.18 | 1.21 | 1.27 | 1.30 | |
| 36–45 | 1.11 | 1.13 | 1.15 | 1.21 | 1.24 | 1.28 | 1.38 | |
| 46–55 | 1.05 | 1.09 | 1.13 | 1.18 | 1.22 | 1.29 | 1.29 | |
| 56–65 | 1.04 | 1.08 | 1.16 | 1.21 | 1.25 | 1.28 | 1.28 | |
| >65 | 1.06 | 1.08 | 1.11 | 1.13 | 1.19 | 1.29 | 1.29 | |
RER: respiratory exchange ratio, V?O2: oxygen uptake.
Most of the explicative variables showed bivariate positive or negative correlations with V?O2 peak and peak WR, with absolute values between 0.42 and 0.77 (Table S10); however when introduced in the multivariable model, only height, age, sex and being in the category 3 of the IPAQ-27 added significant increases in R2 (Table 3). However, this latter added a scanty (+0.01)—albeit significant (p=0.029)—increase in R2 to the model it only reduced the standard error of the estimate (SEE) by 0.01lmin-1, so we opted for the more parsimonious model 2 (Table 3).
With regard to peak WR, height, age, sex, weight and being in the category 3 of the IPAQ-27 added significant increases in R2; however the contribution of weight and category 3 of the IPAQ-27 were again minor and they did only reduce the precision of the model by 0.4W, which we considered negligible.
A very good agreement was found between the observed values in the validation cohort and predicted values derived from the generation cohort (Fig. 1). The Intraclass correlation coefficients (Table S9) were 0.967 (0.948–0.980) for V?O2 peak and 0.923 (0.879–0.52).

The agreement was also very good between the observed values and the model derived from the whole cohort (Fig. 2) again intraclass correlation coefficients (Table S9) were high 0.960 (0.948–0.968) for V?O2 peak and 0.925 (0.905–0.941).

We further compared the V?O2 peak values observed in our whole cohort with the predicted values derived from two popular sets of standards from the literature. As it can be seen (Fig. 3, panels A and B and Table S10) on average our sample tended to have slightly higher V?O2 peak values (average 0.156lmin-1) than Hansen et al predicted values.6 On the other hand were a little lower (average – 0.137lmin-1) than those obtained from the FRIEND cohort,10 what corresponds on average to 108% and 95% of the Hansen et al.6,7 and FRIEND values8–10 respectively Table S10); In spite of these average differences, both equations agreed well enough with our observed values (Fig. 3 and Tables S9–S12) with intraclass correlation coefficients of 0.958 (0.946–0.967) and 0.952 (0.939–0.962) respectively.

Observed versus predicted values from the FRIEND8–10 and Hansen–Waserman's6,7 cohorts. A: Observed values-FRIEND cohort predicted values,8–10 B: Observed values-Hansen-Waserman's predicted values.6,7 LLCI: 95 confidence interval for the predicted values, ULCI 95% confidence interval of the predicted values.
When comparing our predictive equation for V?O2 peak with Hansen et al.,6,7 and FRIEND equations,8–10 the agreement was again reasonably good (Fig. 3, panels A and B and Tables S9–S12). A detailed comparison of the three equations (Tables S13–S16), shows that our equations render higher V?O2 peak values than Hansen et al.6—average 11(7)% in men and 8 (5%) in women. Discrepancies are more pronounced in women and men below 165cm or older than 65 yr. Regarding the FRIEND equation8 our predicted values are closer, but slightly lower, average=-4(4)% in men and -9(3)% in women. Here discrepancies are higher in taller (>180cm) and younger people (<35 years old) (Tables S13 and S16).
DiscussionThis study presents a set of standard values for peak aerobic responses to ramp-incremental cycle CPET obtained from a randomly selected sample from the Spanish population of European descent. The evaluated sample is likely to be representative of the population usually referred to clinical exercise laboratories for CPET.
Our work suggest that for both peak V?O2 and WR it is important to include sex, age and height in the equations (Tables 3 and 4); however if height and sex are included in the model, body mass does not contribute to improve its predictive capacity in individuals with BMI between 18 and 35kgm-2. Similarly physical activity as measured by the IPAQ-27 only marginally improves the goodness of the model. It can be reasoned, though, that individuals who have adopted a life style in which physical activity is low enough to reduce their aerobic capacity are—similarly to obese or underweighted people—unhealthy or even sick population since their life-expectancy is reversibly decreased13,14 and therefore the inclusion of physical activity in a regression equations for clinical purposes is arguable. Peak V?O2 values for very fit people can be found elsewhere.3
One fact worth to mention is that the distribution of the residuals in our sample was homoscedastic (i.e. the variability was similar across the range of V?O2, and WR) therefore it is more scientifically sound to use lower limits of the 95% confidence intervals than a fixed percentage.
A detailed comparison between our reference values with Hansen-Wassermann's6,7 and FRIEND equations8–10 can be found in the supplementary material (tables S9–S16). In comparison with our predicted values Hansen-Wassermann's equations6,7 give lower values than ours. For men discrepancies are particularly marked in individuals in the lower range of height and higher range of age (Tables S13 and S15). For women disagreement is higher in the taller and younger ranges of age (Tables S14 and S16). Disagreement with Hansen–Wasserman's equations6,7 may be due to the strict termination criteria in our study as well as a larger proportion of females and older people in our sample, which may have led to more accurate values in those subpopulations.
With regard to the FRIEND equations8–10 our values were lower. Form men FRIEND an our equations give roughly similar values (Tables S13 and S15). For women, however, our values are 9% lower particularly for older women (Tables S14 and S16).8–10
The strengths of the present study are that it is population-based, with a broad age distribution both for men and women and a wide geographical distribution across Spain and it has a relative large size for studies based on random samples.5 The definition of healthy population was quite rigorous and included—besides non-smoking status and a thorough clinical interview and exploration—normal carboxyhemoglobin, hemoglobin, spirometry and ECG. Moreover, clear maximal end-test criteria were defined and adequate quality control measures were taken, what allowed minimizing the variability, which is lower than most published studies.3 Finally the primarily obtained values were validated in an independent cohort drawn from the same population than the generation cohort.
There are some limitations that should be considered as well, (1) as in other prospective studies with random sampling, it is difficult to recruit very large populations as in retrospective studies, nonetheless our SEE is fairly small (Table 3) – particularly for V?O2 – compared with values from the literature,3 likely because of the strict quality control measures that can be applied to prospective studies like ours. (2) Patients older than 70 years had to be recruited selectively and were tested only in one center. This was a necessary measure consequence of the extraordinary difficulties concomitant to randomly sampling old people fulfilling the health-population criteria of the present study and willing to participate. The limitation of recruiting healthy population among the elders is well recognized in the literature15 and has to be accounted for when interpreting our reference equations in those older than 70 years. (3) The termination criteria required to consider a test as maximal were not met roughly by 7% of the studied participants. This does not necessary mean that such individuals did not reach their peak V?O2.16 Users of our equations must be aware of the end-exercise criteria employed in our study when interpreting exercise tests. (4) Finally we had anticipated that physical activity could influence maximal aerobic capacity, but this was not the case in our sample, one possible reason might be that most of those participating in the study were physically active.
ConclusionsThis study was carried out in response to the lack of good enough V?O2 peak reference values, particularly for women, validated in the population attending to exercise labs across Spain. This report provides cycle-ergometry standard values for both peak V?O2 and WR, which will allow for more accurate interpretation than previously possible. Our equation predicts V?O2 peak values that are very similar to the FRIEND ones8–10 albeit slightly lower for women. On the other hand, with respect to the widely used Hansen-Wasserman's V?O2 peak values,6,7 the standards developed in this work are higher and, once more, the differences are greater for women, but in the opposite direction.
FundingThis study was supported by a SEPAR (Sociedad Española de Neumología y Cirugía Torácica/Spanish society of Pulmonology and Thoracic Surgery) grant and NEUMOMADRD (Sociedad Madrileña de Neumología y Cirugía Torácica/Madrilenian Society of Pulmonology and Thoracic Surgery) research award.
Conflict of interestNone of the authors perceive any conflict of interest regarding this paper.
The following are the supplementary data to this article:


