


Tuberculosis (TB) is a world public health problem that still has a high morbidity and mortality rate mainly in countries with significant wealth gaps. Poverty, malnutrition, HIV infection, drug resistance, diabetes and addictions (mainly alcoholism) have been seen to contribute to the persistence of TB as an important health problem in Mexico.
MethodsDeath certificates associated with pulmonary tuberculosis (PTB) for 2000–2009 were obtained from the National Information System of the Secretariat of Health. Rates of mortality nationwide, by state, and by socioeconomic region were calculated. The strength of association between states where individuals resided, socioeconomic regions, and education with mortality from PTB was determined.
ResultsAge-adjusted mortality rates per 100000 inhabitants who died from PTB decreased from 4.1 to 2 between 2000 and 2009. Men (67.7%) presented higher mortality than women (32.3%). Individuals failing to complete elementary education presented a higher risk of dying from PTB (RR 1.08 [95% CI: 1.05–1.12]). The socioeconomic region and the entities with the strongest association were regions 1, 5, Chiapas and Baja California. Region 1 in 2007 presented RR 7.34 (95% CI: 5.32–10.13), and region 5 in 2009 had RR 10.08 (95% CI: 6.83–14.88).
ConclusionsIn Mexico, the annual mortality rate from PTB decreased. Men presented higher mortality than women. Individuals failing to complete elementary education showed a higher risk of dying from PTB. The states and regions of Mexico that presented a stronger association with mortality from PTB were Chiapas and Baja California, regions 1 and 5.
La tuberculosis (TB) es un problema de salud pública mundial que continúa teniendo una morbimortalidad elevada, principalmente en los países con más desigualdades económicas. Se ha observado que la pobreza, la desnutrición, la infección por VIH, la resistencia a medicamentos, la diabetes y las adicciones, principalmente el alcoholismo, son factores que han contribuido a producir la persistencia de la TB como problema de salud pública importante en México.
MétodosSe obtuvieron los registros de mortalidad asociada a la tuberculosis pulmonar (TBP) correspondientes al periodo 2000–2009 a partir del Sistema Nacional de Información de la Secretaría de Salud. Se calcularon las tasas de mortalidad nacionales, por estados y por regiones socioeconómicas. Se determinó la fuerza de asociación de los estados en los que residían los individuos, las regiones socioeconómicas y el nivel de estudios con la mortalidad por TBP.
ResultadosLas tasas de mortalidad debida a TBP por 100.000 habitantes ajustadas por edad disminuyeron de 4,1 a 2 entre 2000 y 2009. Los varones (67,7%) presentaron una mortalidad superior a la de las mujeres (32,3%). En los individuos que no habían completado los estudios primarios el riesgo de muerte por TBP fue superior (RR 1,08 [IC 95%: 1,05–1,12]). Las regiones socioeconómicas y las entidades con mayor fuerza de asociación fueron la región 1, 5, Chiapas y Baja California. En 2007 la región 1 presentó un RR de 7,34 (IC 95%: 5,32–10,13), y en 2009 la región 5 presentó un RR de 10,08 (IC 95%: 6,83–14,88).
ConclusionesEn México hubo una disminución de la tasa de mortalidad anual por TBP. Los varones presentaron una mortalidad superior a la de las mujeres. Los individuos que no habían completado los estudios primarios presentaron un riesgo superior de muerte por TBP. Los estados y regiones de México que presentaron una mayor fuerza de asociación con la mortalidad por TBP fueron los de Chiapas y Baja California, regiones 1 y 5.
Tuberculosis has been a global public health problem since it was first identified, and continues to be a significant problem, primarily in developing countries, despite advances in diagnosis, prevention and treatment. TB is the 10th highest cause of death worldwide1 and is the 2nd cause of death from infection after human immunodeficiency virus (HIV). All countries are affected by this disease, but Africa and Asia account for 85% of the cases (30% and 55%, respectively), while 35% of the TB cases occur in the Asian subcontinent, in India and China.2
In 2010, the number of cases of TB worldwide was estimated at between 8.5 million and 9.2 million, with between 1.2 million and 1.5 million deaths, including those due to TB in HIV-positive patients.3 However, mortality from this disease has fallen by more than one-third since 1990.4
The economic burden of TB can be devastating, particularly for the poor. Direct and indirect costs of TB and its social consequences are catastrophic for patients, families and the community.5 The cost-per-patient has been estimated at 20% and 40% of a family's annual income, and up to 70% of the annual per capita income. Studies conducted in Myanmar, Bangalore and India have shown that the mean cost of care expressed as a proportion of annual income was much greater in patients with a lower socioeconomic level than those with greater means (68% vs 32% of per capita income in Myanmar).6
In Mexico, around 15000 new cases of pulmonary tuberculosis (PTB) are reported every year and almost 2000 deaths are attributed to this cause, representing a significant loss of potential years of healthy life, since the mean age at death from this disease is 54 years.7 However, mortality has fallen substantially in recent years: the mortality rate per 100000 inhabitants in 1990 was 61, while in 2009 and 2010 it was lower than 2.3 Poverty,8 malnutrition, HIV infection,9 drug resistance,10 diabetes,11,12 and addictions, primarily alcoholism,13 are factors that contribute to the persistence of TB as a significant health problem in Mexico.
No studies investigating mortality trends in PTB by state and by socioeconomic region have hitherto been conducted in Mexico, nor have any data been published on the strength of association between educational level, state of residence, socioeconomic region and mortality from PTB.
The aim of this study was to determine trends in nationwide mortality rates by state and by socioeconomic region, and to determine the relative risk (RR) of educational level, state of residence and socioeconomic region with PTB mortality from 2000 to 2009.
MethodsAn ecological study design was used. Records of PTB deaths between 2000 and 2009 were obtained from the Health Information National System of the Mexican Secretariat of Health.14 This information, based on death certificates issued throughout the country, is generated by the National Institute of Statistics and Geography. All individual death certificates in which the underlying cause of death was recorded as PTB between 2000 and 2009 were included. International Classification of Disease codes (10th edition)15 corresponding to underlying cause of death TBP (A15-A15.9, A16-A16.9) were identified.
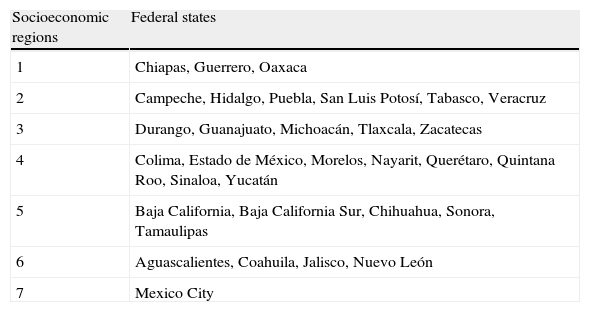
Gross and age-adjusted mortality rates per 100000 inhabitants in Mexico, standardized to the world population, were obtained.16,17 Age-adjusted mortality rates per 100000 inhabitants were also obtained for each state and each of the 7 socioeconomic regions (Table 1) defined by the National Institute of Statistics and Geography.18 The national population of Mexico, estimated by the National Population Board for the period 2000–2009,19 was used for rate adjustment. Poisson regression was used to calculate the RR and 95% confidence interval (CI) for PTB mortality for each of the 7 socioeconomic regions and for each state of residence.
Socioeconomic Regions of Mexico.
| Socioeconomic regions | Federal states |
| 1 | Chiapas, Guerrero, Oaxaca |
| 2 | Campeche, Hidalgo, Puebla, San Luis Potosí, Tabasco, Veracruz |
| 3 | Durango, Guanajuato, Michoacán, Tlaxcala, Zacatecas |
| 4 | Colima, Estado de México, Morelos, Nayarit, Querétaro, Quintana Roo, Sinaloa, Yucatán |
| 5 | Baja California, Baja California Sur, Chihuahua, Sonora, Tamaulipas |
| 6 | Aguascalientes, Coahuila, Jalisco, Nuevo León |
| 7 | Mexico City |
The 7 categories of socioeconomic regions in Mexico were defined by the National Institute of Statistics and Geography on the basis of differences in social and economic conditions of the population of Mexico as a whole, and presented as part of the XII Census of Population and Housing. The 7 socioeconomic regions include the 31 Mexican states and Mexico City, and are determined according to indicators of wellbeing, such as educational level, occupation, health, housing and employment. The states classified under a single socioeconomic region generally have similar characteristics, i.e., they are homogeneous, while the regions differ. According to the indicators used, socioeconomic conditions range from region 1, the worst, to region 7, the best.
The methodology used for establishing the regions aimed to create strata with minimal variance. The objective was to pool the most similar or closely connected elements following established similarity criteria for differentiating one region from another. Techniques employed included Mahalonobis distances and a combination of factorial analysis and k-means clustering.18
The Poisson regression model was used to determine the strength of association between states, socioeconomic regions of residence and level of studies, and PTB mortality, because the number of deaths, as a dependent variable, has a Poisson distribution of whole positive numbers. The Poisson regression is equivalent to a logarithmic regression of mortality rates. Exponentiated coefficients allow the RR of death to be estimated.20
Records were collected in Access 2003 software. Data were transferred to Number Cruncher Statistical System Program 200121 that calculated the strength of association between each state and socioeconomic region of residence and mortality from PTB, using a Poisson regression. Epidat version 3.1 software was used to determine age-adjusted mortality rates by state and socioeconomic region.
ResultsA total of 22670 individuals died of PTB between 2000 and 2009. During this period, the age-standardized rate per 100000 fell from 4.1 to 2 (Fig. 1). Deaths were predominantly in men, with 15350 cases (67.7%) compared to 7320 (32.3%) in women.
. Standardized mortality rates (trends in men and women).")
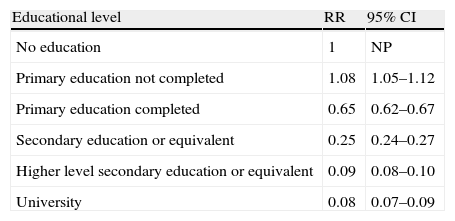
Strength of association between educational level and death from PTB was determined. Individuals who had not completed primary schooling had a higher risk of death (1.08 [95% CI: 1.05–1.12]) than those with a higher level of education, such as university studies (RR 0.08 [95% CI: 0.07–0.09]) (Table 2).
Relative Risk of Death From Pulmonary Tuberculosis by Educational Level and 95% Confidence Interval, Using a Poisson Regression, Mexico, 2000–2009.
| Educational level | RR | 95% CI |
| No education | 1 | NP |
| Primary education not completed | 1.08 | 1.05–1.12 |
| Primary education completed | 0.65 | 0.62–0.67 |
| Secondary education or equivalent | 0.25 | 0.24–0.27 |
| Higher level secondary education or equivalent | 0.09 | 0.08–0.10 |
| University | 0.08 | 0.07–0.09 |
NA: not applicable; RR: relative risk; CI: confidence level.
During the study period, mortality rates in the states showed a downward trend. States with the highest rates of mortality were Chiapas, Baja California and Nayarit. In 2000 and 2009, the rates in Chiapas were 8.4 and 4.5, in Baja California, 6.3 and 5.4 (Fig. 2A), and in Nayarit, 4.8 and 2.3 (Fig. 2C), respectively.
.")
The states with the lowest mortality rates were Mexico City, Tlaxcala and Zacatecas. In 2000 and 2009, the rates in Mexico City were 1 and 0.2 (Fig. 2B), in Tlaxcala 0.9 and 0.2, and in Zacatecas, 1.3 and 0.3, respectively (Fig. 2D).
Socioeconomic region 1 showed the highest mortality rates during the study period, except in 2006 and 2007 (Fig. 3). In this region, the mortality rates in 2000 and 2009 were 5.6 and 3.1, respectively. Region 7 showed the lowest mortality rates between 2000 and 2009. In this region, the mortality rates in 2000 and 2009 were 1 and 0.2, respectively (Fig. 3).
.")
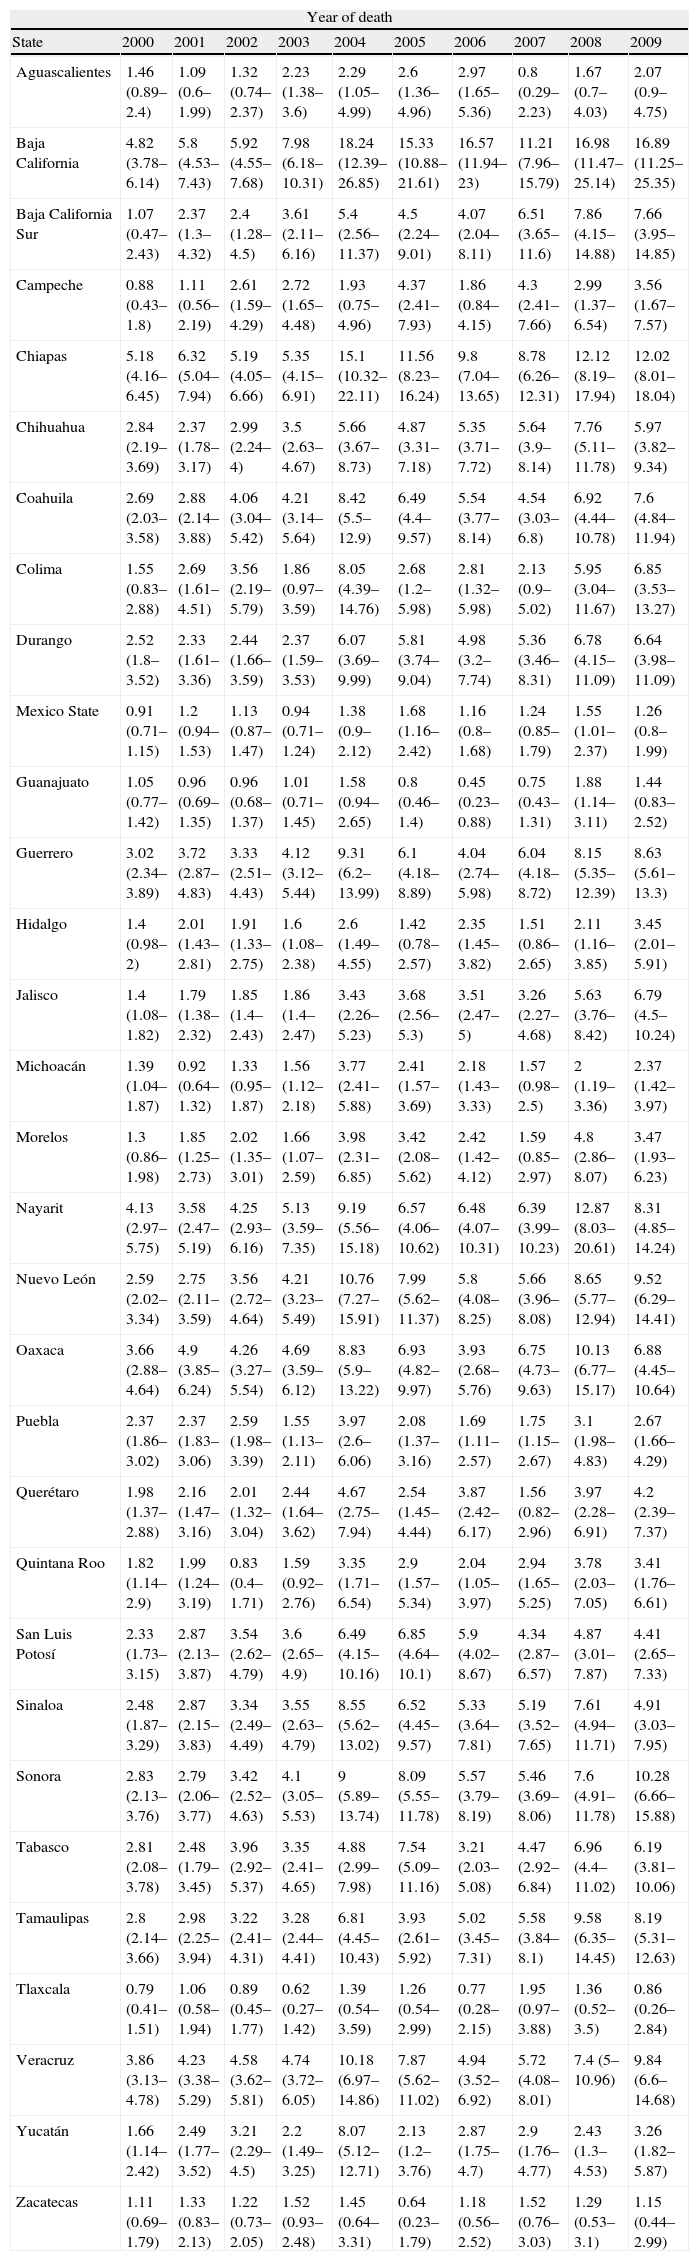
The strength of association between each state of residence and death from PTB in the 2000–2009 period was determined using a Poisson regression, taking Mexico City as standard, since this is the state in socioeconomic region 7 with the highest economic level (Table 1) and the lowest PTB mortality rate (Fig. 2B). States with a greater strength of association with PTB deaths were Chiapas and Baja California. In 2000 and 2009, these two states had a RR of 5.18 (95% CI: 4.16–6.45) and 12.02 (CI 95%: 8.01–18.04), and an RR of 4.82 (95% CI: 3.78–6.14) and 16.89 (95% CI: 11.25–25.35), respectively (Table 3).
Relative Risk Of Death From Pulmonary Tuberculosis by State of Residence and 95% Confidence Interval, Using a Poisson Regression, Mexico, 2000–2009.
| Year of death | ||||||||||
| State | 2000 | 2001 | 2002 | 2003 | 2004 | 2005 | 2006 | 2007 | 2008 | 2009 |
| Aguascalientes | 1.46 (0.89–2.4) | 1.09 (0.6–1.99) | 1.32 (0.74–2.37) | 2.23 (1.38–3.6) | 2.29 (1.05–4.99) | 2.6 (1.36–4.96) | 2.97 (1.65–5.36) | 0.8 (0.29–2.23) | 1.67 (0.7–4.03) | 2.07 (0.9–4.75) |
| Baja California | 4.82 (3.78–6.14) | 5.8 (4.53–7.43) | 5.92 (4.55–7.68) | 7.98 (6.18–10.31) | 18.24 (12.39–26.85) | 15.33 (10.88–21.61) | 16.57 (11.94–23) | 11.21 (7.96–15.79) | 16.98 (11.47–25.14) | 16.89 (11.25–25.35) |
| Baja California Sur | 1.07 (0.47–2.43) | 2.37 (1.3–4.32) | 2.4 (1.28–4.5) | 3.61 (2.11–6.16) | 5.4 (2.56–11.37) | 4.5 (2.24–9.01) | 4.07 (2.04–8.11) | 6.51 (3.65–11.6) | 7.86 (4.15–14.88) | 7.66 (3.95–14.85) |
| Campeche | 0.88 (0.43–1.8) | 1.11 (0.56–2.19) | 2.61 (1.59–4.29) | 2.72 (1.65–4.48) | 1.93 (0.75–4.96) | 4.37 (2.41–7.93) | 1.86 (0.84–4.15) | 4.3 (2.41–7.66) | 2.99 (1.37–6.54) | 3.56 (1.67–7.57) |
| Chiapas | 5.18 (4.16–6.45) | 6.32 (5.04–7.94) | 5.19 (4.05–6.66) | 5.35 (4.15–6.91) | 15.1 (10.32–22.11) | 11.56 (8.23–16.24) | 9.8 (7.04–13.65) | 8.78 (6.26–12.31) | 12.12 (8.19–17.94) | 12.02 (8.01–18.04) |
| Chihuahua | 2.84 (2.19–3.69) | 2.37 (1.78–3.17) | 2.99 (2.24–4) | 3.5 (2.63–4.67) | 5.66 (3.67–8.73) | 4.87 (3.31–7.18) | 5.35 (3.71–7.72) | 5.64 (3.9–8.14) | 7.76 (5.11–11.78) | 5.97 (3.82–9.34) |
| Coahuila | 2.69 (2.03–3.58) | 2.88 (2.14–3.88) | 4.06 (3.04–5.42) | 4.21 (3.14–5.64) | 8.42 (5.5–12.9) | 6.49 (4.4–9.57) | 5.54 (3.77–8.14) | 4.54 (3.03–6.8) | 6.92 (4.44–10.78) | 7.6 (4.84–11.94) |
| Colima | 1.55 (0.83–2.88) | 2.69 (1.61–4.51) | 3.56 (2.19–5.79) | 1.86 (0.97–3.59) | 8.05 (4.39–14.76) | 2.68 (1.2–5.98) | 2.81 (1.32–5.98) | 2.13 (0.9–5.02) | 5.95 (3.04–11.67) | 6.85 (3.53–13.27) |
| Durango | 2.52 (1.8–3.52) | 2.33 (1.61–3.36) | 2.44 (1.66–3.59) | 2.37 (1.59–3.53) | 6.07 (3.69–9.99) | 5.81 (3.74–9.04) | 4.98 (3.2–7.74) | 5.36 (3.46–8.31) | 6.78 (4.15–11.09) | 6.64 (3.98–11.09) |
| Mexico State | 0.91 (0.71–1.15) | 1.2 (0.94–1.53) | 1.13 (0.87–1.47) | 0.94 (0.71–1.24) | 1.38 (0.9–2.12) | 1.68 (1.16–2.42) | 1.16 (0.8–1.68) | 1.24 (0.85–1.79) | 1.55 (1.01–2.37) | 1.26 (0.8–1.99) |
| Guanajuato | 1.05 (0.77–1.42) | 0.96 (0.69–1.35) | 0.96 (0.68–1.37) | 1.01 (0.71–1.45) | 1.58 (0.94–2.65) | 0.8 (0.46–1.4) | 0.45 (0.23–0.88) | 0.75 (0.43–1.31) | 1.88 (1.14–3.11) | 1.44 (0.83–2.52) |
| Guerrero | 3.02 (2.34–3.89) | 3.72 (2.87–4.83) | 3.33 (2.51–4.43) | 4.12 (3.12–5.44) | 9.31 (6.2–13.99) | 6.1 (4.18–8.89) | 4.04 (2.74–5.98) | 6.04 (4.18–8.72) | 8.15 (5.35–12.39) | 8.63 (5.61–13.3) |
| Hidalgo | 1.4 (0.98–2) | 2.01 (1.43–2.81) | 1.91 (1.33–2.75) | 1.6 (1.08–2.38) | 2.6 (1.49–4.55) | 1.42 (0.78–2.57) | 2.35 (1.45–3.82) | 1.51 (0.86–2.65) | 2.11 (1.16–3.85) | 3.45 (2.01–5.91) |
| Jalisco | 1.4 (1.08–1.82) | 1.79 (1.38–2.32) | 1.85 (1.4–2.43) | 1.86 (1.4–2.47) | 3.43 (2.26–5.23) | 3.68 (2.56–5.3) | 3.51 (2.47–5) | 3.26 (2.27–4.68) | 5.63 (3.76–8.42) | 6.79 (4.5–10.24) |
| Michoacán | 1.39 (1.04–1.87) | 0.92 (0.64–1.32) | 1.33 (0.95–1.87) | 1.56 (1.12–2.18) | 3.77 (2.41–5.88) | 2.41 (1.57–3.69) | 2.18 (1.43–3.33) | 1.57 (0.98–2.5) | 2 (1.19–3.36) | 2.37 (1.42–3.97) |
| Morelos | 1.3 (0.86–1.98) | 1.85 (1.25–2.73) | 2.02 (1.35–3.01) | 1.66 (1.07–2.59) | 3.98 (2.31–6.85) | 3.42 (2.08–5.62) | 2.42 (1.42–4.12) | 1.59 (0.85–2.97) | 4.8 (2.86–8.07) | 3.47 (1.93–6.23) |
| Nayarit | 4.13 (2.97–5.75) | 3.58 (2.47–5.19) | 4.25 (2.93–6.16) | 5.13 (3.59–7.35) | 9.19 (5.56–15.18) | 6.57 (4.06–10.62) | 6.48 (4.07–10.31) | 6.39 (3.99–10.23) | 12.87 (8.03–20.61) | 8.31 (4.85–14.24) |
| Nuevo León | 2.59 (2.02–3.34) | 2.75 (2.11–3.59) | 3.56 (2.72–4.64) | 4.21 (3.23–5.49) | 10.76 (7.27–15.91) | 7.99 (5.62–11.37) | 5.8 (4.08–8.25) | 5.66 (3.96–8.08) | 8.65 (5.77–12.94) | 9.52 (6.29–14.41) |
| Oaxaca | 3.66 (2.88–4.64) | 4.9 (3.85–6.24) | 4.26 (3.27–5.54) | 4.69 (3.59–6.12) | 8.83 (5.9–13.22) | 6.93 (4.82–9.97) | 3.93 (2.68–5.76) | 6.75 (4.73–9.63) | 10.13 (6.77–15.17) | 6.88 (4.45–10.64) |
| Puebla | 2.37 (1.86–3.02) | 2.37 (1.83–3.06) | 2.59 (1.98–3.39) | 1.55 (1.13–2.11) | 3.97 (2.6–6.06) | 2.08 (1.37–3.16) | 1.69 (1.11–2.57) | 1.75 (1.15–2.67) | 3.1 (1.98–4.83) | 2.67 (1.66–4.29) |
| Querétaro | 1.98 (1.37–2.88) | 2.16 (1.47–3.16) | 2.01 (1.32–3.04) | 2.44 (1.64–3.62) | 4.67 (2.75–7.94) | 2.54 (1.45–4.44) | 3.87 (2.42–6.17) | 1.56 (0.82–2.96) | 3.97 (2.28–6.91) | 4.2 (2.39–7.37) |
| Quintana Roo | 1.82 (1.14–2.9) | 1.99 (1.24–3.19) | 0.83 (0.4–1.71) | 1.59 (0.92–2.76) | 3.35 (1.71–6.54) | 2.9 (1.57–5.34) | 2.04 (1.05–3.97) | 2.94 (1.65–5.25) | 3.78 (2.03–7.05) | 3.41 (1.76–6.61) |
| San Luis Potosí | 2.33 (1.73–3.15) | 2.87 (2.13–3.87) | 3.54 (2.62–4.79) | 3.6 (2.65–4.9) | 6.49 (4.15–10.16) | 6.85 (4.64–10.1) | 5.9 (4.02–8.67) | 4.34 (2.87–6.57) | 4.87 (3.01–7.87) | 4.41 (2.65–7.33) |
| Sinaloa | 2.48 (1.87–3.29) | 2.87 (2.15–3.83) | 3.34 (2.49–4.49) | 3.55 (2.63–4.79) | 8.55 (5.62–13.02) | 6.52 (4.45–9.57) | 5.33 (3.64–7.81) | 5.19 (3.52–7.65) | 7.61 (4.94–11.71) | 4.91 (3.03–7.95) |
| Sonora | 2.83 (2.13–3.76) | 2.79 (2.06–3.77) | 3.42 (2.52–4.63) | 4.1 (3.05–5.53) | 9 (5.89–13.74) | 8.09 (5.55–11.78) | 5.57 (3.79–8.19) | 5.46 (3.69–8.06) | 7.6 (4.91–11.78) | 10.28 (6.66–15.88) |
| Tabasco | 2.81 (2.08–3.78) | 2.48 (1.79–3.45) | 3.96 (2.92–5.37) | 3.35 (2.41–4.65) | 4.88 (2.99–7.98) | 7.54 (5.09–11.16) | 3.21 (2.03–5.08) | 4.47 (2.92–6.84) | 6.96 (4.4–11.02) | 6.19 (3.81–10.06) |
| Tamaulipas | 2.8 (2.14–3.66) | 2.98 (2.25–3.94) | 3.22 (2.41–4.31) | 3.28 (2.44–4.41) | 6.81 (4.45–10.43) | 3.93 (2.61–5.92) | 5.02 (3.45–7.31) | 5.58 (3.84–8.1) | 9.58 (6.35–14.45) | 8.19 (5.31–12.63) |
| Tlaxcala | 0.79 (0.41–1.51) | 1.06 (0.58–1.94) | 0.89 (0.45–1.77) | 0.62 (0.27–1.42) | 1.39 (0.54–3.59) | 1.26 (0.54–2.99) | 0.77 (0.28–2.15) | 1.95 (0.97–3.88) | 1.36 (0.52–3.5) | 0.86 (0.26–2.84) |
| Veracruz | 3.86 (3.13–4.78) | 4.23 (3.38–5.29) | 4.58 (3.62–5.81) | 4.74 (3.72–6.05) | 10.18 (6.97–14.86) | 7.87 (5.62–11.02) | 4.94 (3.52–6.92) | 5.72 (4.08–8.01) | 7.4 (5–10.96) | 9.84 (6.6–14.68) |
| Yucatán | 1.66 (1.14–2.42) | 2.49 (1.77–3.52) | 3.21 (2.29–4.5) | 2.2 (1.49–3.25) | 8.07 (5.12–12.71) | 2.13 (1.2–3.76) | 2.87 (1.75–4.7) | 2.9 (1.76–4.77) | 2.43 (1.3–4.53) | 3.26 (1.82–5.87) |
| Zacatecas | 1.11 (0.69–1.79) | 1.33 (0.83–2.13) | 1.22 (0.73–2.05) | 1.52 (0.93–2.48) | 1.45 (0.64–3.31) | 0.64 (0.23–1.79) | 1.18 (0.56–2.52) | 1.52 (0.76–3.03) | 1.29 (0.53–3.1) | 1.15 (0.44–2.99) |
Mexico City was taken as the reference value for the Poisson regression analysis.
During the study period, no single state showed the lowest strength of association with PTB mortality. States with the lowest risk were Michoacán in 2000 and 2009, with an RR of 1.39 (95% CI: 1.04–1.87 and 2.37 (95% CI: 1.42–3.97), respectively; Jalisco in 2001 and 2002, with an RR of 1.79 (95% CI: 1.38–2.32) and 1.85 (95% CI: 1.4–2.43); Puebla in 2003, 2006 and 2007, with an RR of 1.55 (95% CI: 1.13–2.11), 1.69 (95% CI: 1.11–2.57) and 1.75 (95% CI: 1.15–2.67); Aguascalientes in 2004, with an RR of 2.29 (95% CI: 1.05–4.99); Mexico State in 2005 and 2008, with an RR of 1.68 (95% CI: 1.16–2.42) and 1.55 (95% CI: 1.01–2.37), respectively (Table 3).
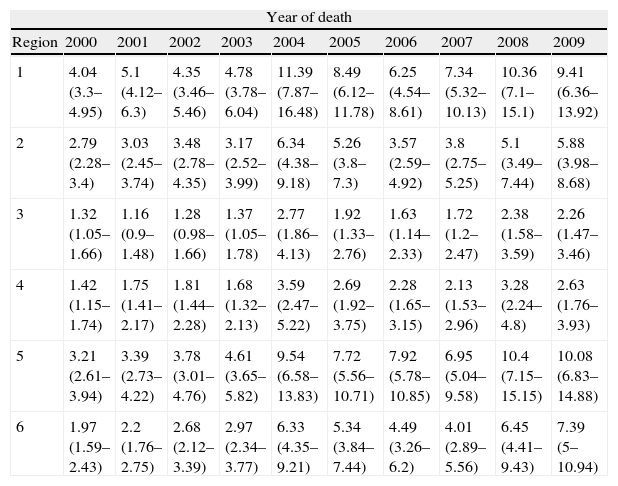
The strength of association was also determined for each socioeconomic region of residence and death from PTB using a Poisson regression, with region 7 as standard. region 1 (2000–2005, 2007) and region 5 (2006, 2008 and 2009) had the greatest strength of association with PTB. In region 1, in 2000 and 2007, RR was 4.04 (95% CI: 3.3–4.95) and 7.34 (95% CI: 5.32–10.13), respectively. In region 5, in 2006 and 2009, RR was 7.92 (95% CI: 5.78–10.85) and 10.08 (95% CI: 6.83–14.88), respectively (Table 4).
Relative Risk of Death From Pulmonary Tuberculosis by Socioeconomic Region and 95% Confidence Interval, Using a Poisson Regression, Mexico, 2000–2009.
| Year of death | ||||||||||
| Region | 2000 | 2001 | 2002 | 2003 | 2004 | 2005 | 2006 | 2007 | 2008 | 2009 |
| 1 | 4.04 (3.3–4.95) | 5.1 (4.12–6.3) | 4.35 (3.46–5.46) | 4.78 (3.78–6.04) | 11.39 (7.87–16.48) | 8.49 (6.12–11.78) | 6.25 (4.54–8.61) | 7.34 (5.32–10.13) | 10.36 (7.1–15.1) | 9.41 (6.36–13.92) |
| 2 | 2.79 (2.28–3.4) | 3.03 (2.45–3.74) | 3.48 (2.78–4.35) | 3.17 (2.52–3.99) | 6.34 (4.38–9.18) | 5.26 (3.8–7.3) | 3.57 (2.59–4.92) | 3.8 (2.75–5.25) | 5.1 (3.49–7.44) | 5.88 (3.98–8.68) |
| 3 | 1.32 (1.05–1.66) | 1.16 (0.9–1.48) | 1.28 (0.98–1.66) | 1.37 (1.05–1.78) | 2.77 (1.86–4.13) | 1.92 (1.33–2.76) | 1.63 (1.14–2.33) | 1.72 (1.2–2.47) | 2.38 (1.58–3.59) | 2.26 (1.47–3.46) |
| 4 | 1.42 (1.15–1.74) | 1.75 (1.41–2.17) | 1.81 (1.44–2.28) | 1.68 (1.32–2.13) | 3.59 (2.47–5.22) | 2.69 (1.92–3.75) | 2.28 (1.65–3.15) | 2.13 (1.53–2.96) | 3.28 (2.24–4.8) | 2.63 (1.76–3.93) |
| 5 | 3.21 (2.61–3.94) | 3.39 (2.73–4.22) | 3.78 (3.01–4.76) | 4.61 (3.65–5.82) | 9.54 (6.58–13.83) | 7.72 (5.56–10.71) | 7.92 (5.78–10.85) | 6.95 (5.04–9.58) | 10.4 (7.15–15.15) | 10.08 (6.83–14.88) |
| 6 | 1.97 (1.59–2.43) | 2.2 (1.76–2.75) | 2.68 (2.12–3.39) | 2.97 (2.34–3.77) | 6.33 (4.35–9.21) | 5.34 (3.84–7.44) | 4.49 (3.26–6.2) | 4.01 (2.89–5.56) | 6.45 (4.41–9.43) | 7.39 (5–10.94) |
Region 7 was taken as the reference value for the Poisson regression analysis.
In the study period, the lowest strength of association with PTB mortality was found in region 3. In 2000 and 2009, RR was 1.32 (95% CI: 1.05–1.66) and 2.26 (95% CI: 1.47–3.46), respectively (Table 4).
DiscussionRates of TB have fallen in Mexico in the last 14 years.22 In 2000, the rate of PTB mortality per 100000 habitants standardized to the world population was 4.1, and in 2009, it was 2 (Fig. 1). PTB death rates will probably continue on this downward trend, since, according to global estimates for 2002–2025, TB will fall each year by 5.4% in men and 5.3% in women.23
Mortality was higher in men than in women. In countries with lower incomes, twice as many TB cases are recorded in men than in women. This difference is generally attributed to biological and epidemiological characteristics, and also to socioeconomic and cultural differences in access to healthcare. Jimenez-Corona et al.24 identified gender-related differences in patients with PTB in the state of Veracruz, Mexico. This study included 623 patients with PTB. The male:female incidence rate ratio for overall, reactivated and recently transmitted disease was 1.58 (95% CI: 1.34–1.86), 1.64 (95% CI: 1.36–1.98) and 1.41 (95% CI: 1.01–1.96), respectively. Treatment failure (adjusted OR 3.30 [95% CI: 1.46–7.43]), re-treatment (RR 3.15 [95% CI: 1.38–7.22]) and death from TB (RR 2.23 [95% CI: 1.25–3.99]) were more likely in men than in women. These results confirm that the higher rates of transmission and reactivated disease and the poorer therapeutic outcomes in men are indicators of gender differences in PTB diagnosis and treatment.
A reverse J-shaped association was found between educational level and PTB (Table 2). This may be because poor education in Mexico has contributed to increased social inequalities and poverty.25 A high educational level is associated with low mortality and a better overall health in the population. Populations with little or no education are generally disadvantaged from a social, geographical or economical point of view,26 factors that all are associated with PTB morbidity and mortality. In the state of Chiapas, individuals with little or no education (0–3 schooling years) had a higher risk of death from PTB (OR 3.3 [95% CI: 1.1–9.6]).8
States with the highest death rates and the greatest strength of association with PTB mortality were Chiapas and Baja California (Fig. 2A and Table 3). Chiapas, Oaxaca and Guerrero are the three states comprising region 1 (Table 1). This is the region with the poorest socioeconomic conditions in the country, a factor that is associated with higher PTB death rates. Other factors associated with high PTB mortality in this region, particularly in Chiapas, are low educational level (OR 3.3 [95% CI: 1.1–9.9]), employment in agriculture (OR 2.2 [95% CI: 1.1–4.4]), life in a rural community (OR 2.7 [95% CI: 1.1–6.8]),8 underuse of monitoring programs, failure to administer antituberculosis treatment based on lack of supervision, and Mycobacterium tuberculosis resistance to the main drugs.27,28
Baja California is the other state with the highest PTB mortality in the country. This state is in socioeconomic region 5, one of the 2 regions with most strength of association with PTB mortality in Mexico (Table 4). Factors associated with high PTB mortality in Baja California are HIV infection,29 migration,30,31 multi-drug resistance32 and intravenous drug abuse.33
TB is a worldwide public health problem that continues to cause high levels of morbidity and mortality, mainly in countries with greater economic inequalities. According to the Pan American Health Organization, the incidence of TB in Mexico began to fall in 1998, and is now at stage 2 of the strategic plan for the control of TB (estimated TB incidence of between 25 and 50 per 100000 inhabitants and directly observed treatment, short course [DOTS] coverage of over 90%).22 However, despite this reduction, TB incidence remains high, suggesting that disease transmission continues to be an important factor. In 2000, between 10% and 13% of TB patients that started treatment did not achieve a cure, suggesting that these subjects remain an active source of disease transmission and development of drug resistance.34
Factors affecting effective control of TB in Mexico are primarily the heterogeneity of the population, wide socioeconomic inequalities, differences in access to health services and poor health education.35
Mexico has a specific control program aimed at reducing the risk of TB morbidity and mortality. This program mainly focuses on early detection and treatment using the DOTS strategy, and has been effective in reducing the incidence of new cases and death from TB.36
Since the DOTS strategy was implemented in Mexico in 1996, detection, diagnosis and treatment of PTB has improved. However, the strategy is far too localized: there are areas in which pro-active, targeted screening is required, and where failure to implement this on a systematic level in healthcare units or among the population is preventing early detection. Similarly, all cases of TB must be treated and followed up on an individual basis.34
Improving TB strategies in Mexico requires not only investment to consolidate TB control, diagnosis and treatment programs, but also action to combat the social determinants of the disease. Key structural factors in the epidemiology of TB include socioeconomic inequalities, a highly mobile population, a rapidly changing urban lifestyle, and population growth. These conditions lead to the uneven distribution of key social factors affecting TB, such as lack of food security and malnutrition, poor housing and environmental conditions, and economic, geographical and cultural barriers to accessing healthcare.6,37
According to the Pan American Health Organization, Mexico is a country with well-documented death records. In the period 2001–2003, mortality from PTB was listed at 9.7%, but the real incidence may be even higher.38
ConclusionsMortality rates per 100000 inhabitants, adjusted for age according to global age distributions, fell from 4.1 to 2 per 100000 inhabitants during the study period. Mortality among men was higher than among women (67.7% vs 32.3%, respectively). Individuals with incomplete primary education had a higher risk of PTB death (RR 1.08 [95% CI: 1.05–1.12]). States and regions of Mexico that presented the greatest strength of association with PTB mortality were Chiapas and Baja California and regions 1 and 5.
Conflict of InterestsThe author states that there is no conflict of interests.
Please cite this article as: Sánchez-Barriga JJ. Tendencias de mortalidad y riesgo de muerte por tuberculosis pulmonar en las 7 regiones socioeconómicas y los 32 estados de México, 2000–2009. Arch Bronconeumol. 2015;51:16–23.


