


Maximal inspiratory and expiratory pressures (PImax/PEmax) reference equations obtained in healthy people are needed to correctly interpret respiratory muscle strength. Currently, no clear cut-off points defining respiratory muscle weakness are available. We aimed to establish sex-specific reference equations for PImax/PEmax in a large sample of healthy adults and to objectively determine cut-off points for respiratory muscle weakness.
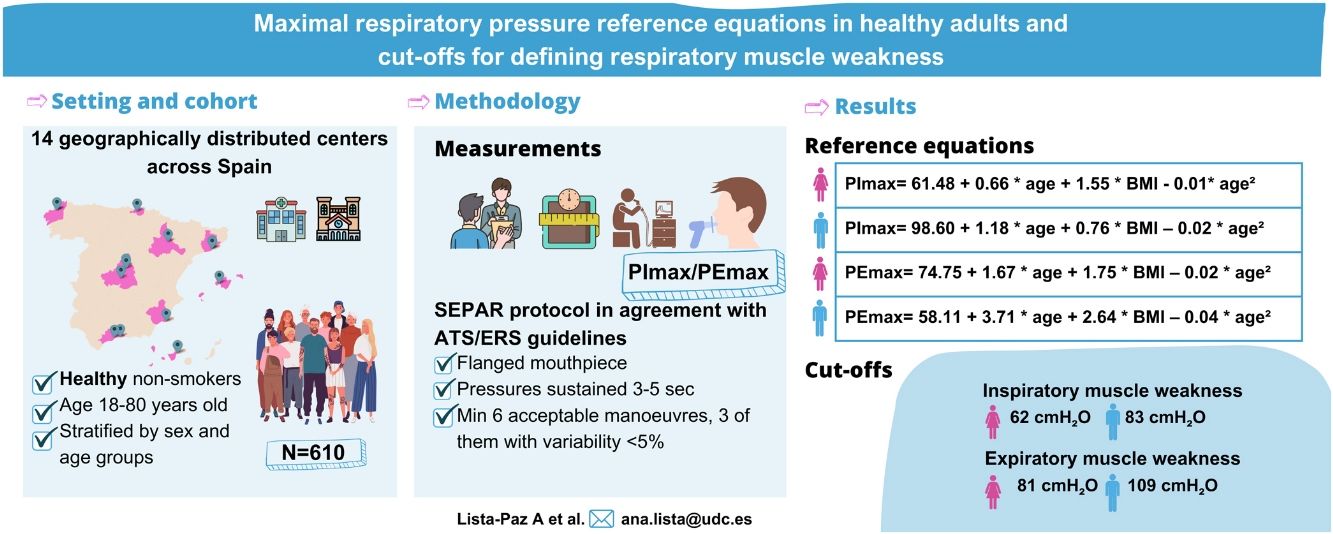
MethodsA multicentre cross-sectional study was conducted across 14 Spanish centres. Healthy non-smoking volunteers aged 18–80 years stratified by sex and age were recruited. PImax/PEmax were assessed using uniform methodology according to international standards. Multiple linear regressions were used to obtain reference equations. Cut-off points for respiratory muscle weakness were established by using T-scores.
ResultsThe final sample consisted of 610 subjects (314 females; 48 [standard deviation, SD: 17] years). Reference equations for PImax/PEmax included body mass index and a squared term of the age as independent variables for both sexes (p<0.01). Cut-off points for respiratory muscle weakness based on T-scores ≥2.5 SD below the peak mean value achieved at a young age were: 62 and 83cmH2O for PImax and 81 and 109cmH2O for PEmax in females and males, respectively.
ConclusionThese reference values, based on the largest dataset collected in a European population to date using uniform methodology, help identify cut-off points for respiratory muscle weakness in females and males. These data will help to better identify the presence of respiratory muscle weakness and to determine indications for interventions to improve respiratory muscle function.
Maximal inspiratory and expiratory pressures (PImax/PEmax) are widely used for the assessment of respiratory muscle strength both in research and clinical practice.1,2 These tests are clinically useful in patients with suspected respiratory muscle weakness and/or cough impairment, unexplained dyspnoea and abnormal lung function tests. They can contribute to diagnosis, prognosis, design and assessment of treatment benefits, and patient follow-up.1,2 Their main advantages are they require low-cost equipment and involve a quick and non-invasive procedure that is well tolerated by patients.1 However, the use of these tests is limited by the lack of: (1) a standardized measurement methodology; (2) representative normative reference values from a large healthy population for comparison with obtained results and (3) objective cut-off points to define respiratory muscle weakness.3
Globally, about 50 reference equations for PImax/Pemax (each involving fewer than 10000 subjects) have been published in healthy adults.4–6 Nevertheless, normative reference values1,7 collected according to standardized methodology endorsed by the American Thoracic Society and European Respiratory Society (ATS/ERS)1,2 are rare, a situation that complicates uniform interpretation. This contrasts sharply with other lung function tests (e.g., spirometry) for which normative reference values are available from large samples collected under a universally standardized protocol.8
The choice of PImax reference equations has also been shown to have a major impact on the diagnosis of weakness, with prevalences ranging from 33% to 67% depending on the reference equations used.3 This wide variability can be attributed mostly to both technical aspects (e.g., differences in protocols and equipment used) and sample characteristics (mainly sex and age but also anthropometry and ethnicity).1,3,7,9 In Spain, the only reference equations currently available are those published by Morales et al. in 1997, obtained from 264 healthy volunteers from the city of Valencia.10 These were established using peak pressure values instead of the internationally recommended PImax/PEmax based on one-second plateau pressure.1,2 Hence, due to the heterogeneity in assessment methods, no universal definition of respiratory muscle weakness is currently available. Eighty centimetres of water (cmH2O) for PImax has previously been put forward as a cut-off point to exclude significant inspiratory muscle weakness.2 PImax ≤60cmH2O was suggested as a threshold for the prescription of inspiratory muscle training in patients with chronic obstructive pulmonary disease (COPD).11 However, since sex is a major determinant of muscle strength, it seems unlikely that these cut-off values would be applicable to both females and males.9 For PEmax, no cut-off points have been proposed to date.1,2
The clinical interpretation of respiratory muscle function tests is another issue to consider. In spirometry, z-scores of ≥1.64 standard deviations (SD) below age and sex-specific averages are increasingly used to define the lower limits of normality (LLN).8 In other clinical conditions, such as osteoporosis12 and sarcopenia, the use of T-scores ≥2.5 SD below the peak mean value at a young age is more common.13 We believe that this latter method could be useful to define cut-off points for respiratory muscle weakness.
The main aims of this study were therefore (1) to generate new sex-specific PImax/PEmax reference equations in healthy Spanish adults and (2) to establish the LLN for respiratory muscle strength by using both z-scores and T-scores.
MethodsA multicentre, cross-sectional study was conducted between 2019 and 2022 in 14 Spanish centres (Supplementary material_Table S1). Healthy adults were included if they met the following inclusion criteria: aged 18–80 years, lived most of the time in Spain in the last 12 months, were non-smokers or former smokers (quit at least one year ago),14 and were willing to participate in the study. Exclusion criteria list included: history of respiratory diseases; cerebrovascular and cardiovascular diseases (heart failure and acute myocardial infarction); neurological diseases; severe thoracic deformities; having had a cold, influenza or severe acute respiratory syndrome coronavirus 2 (SARS-CoV-2) in the previous 30 days; diagnosis of long COVID-19 and/or admission to an intensive care unit because of COVID-19; rhinitis, sinusitis, deviated septum and/or nose surgery; body mass index (BMI) over 30kg/m2; regular use of medication to treat respiratory allergies, oral corticosteroids, central nervous system depressants or barbiturates; pregnancy; athletes and highly-trained subjects (more than 10h of training/week); professional wind musicians and professional submariners. Volunteers unable to understand or perform the manoeuvres required and those who presented contraindications to perform spirometry and/or maximal respiratory pressure procedures were also excluded.
The subjects were randomly recruited from a list of volunteers stratified by geographic region, sex and age groups. Subjects were identified following the same recruitment strategy in all the participating centres: via posters on social media and displayed in the centre facilities and via email sent to healthcare staff and secondary contacts.
All assessments were performed during a single visit. Demographic characteristics, personal history of diseases and smoking status were obtained by interview. Height and weight were measured and BMI was calculated. The Spanish short version of the International Physical Activity Questionnaire (IPAQ) was administered.15 Data are presented both as continuous variables (in MET/min/week) and as categorical variables (low, moderate and high levels of physical activity defined by <600, 600–3000, >3000MET/min/week, respectively).16 Spirometry was performed following international guidelines to confirm normal pulmonary function.17 Forced expiratory volume in one second (FEV1), forced vital capacity (FVC), FEV1/FVC and peak expiratory flow (PEF) were recorded. Values obtained were compared with reference values for the adult Spanish population.18,19
Maximal respiratory pressures were assessed using a MicroRPM® portable digital manometer (Vyaire Medical GmbH, Hoechberg, Germany), connected to PUMA® software (Vyaire Medical GmbH, Hoechberg, Germany), allowing the evaluators to visualize pressure–time curves. PImax/PEmax assessments were performed according to ATS/ERS recommendations1,2 and following the Spanish Society of Pulmonology and Thoracic Surgery (SEPAR) protocol.20 PImax/PEmax were performed using a flanged mouthpiece from residual volume and total lung capacity, respectively. No visual feedback was provided during the tests. Pressures were sustained for 3–5s, and one-second plateau pressure was recorded as PImax/PEmax. A minimum of six acceptable manoeuvres (i.e., without air leaks and with the graph showing a trend to a plateau), three with variability <5% (repeatability criteria), were performed. The highest value of three reproducible manoeuvres was selected. All evaluators underwent a training period before starting the study to ensure standardization of the protocol. Quality control was performed at all centres to ensure consistency. For more detail on PImax/PEmax assessment methodology, training and quality control process, refer to the online Supplementary material.
The study was approved by the Ethics Committee of the coordinating centre (University of A Coruña, CEID-UDC:2018-004) and by the local Ethics Committees of each participating centre. All subjects gave written consent.
Statistical AnalysisThe sample size was calculated based on the Spanish SD of PImax/PEmax reported by Morales et al.10 Thus, aiming for a 95% confidence interval, with an accuracy in measuring maximal respiratory pressures of ±3cmH2O, assuming an SD±25cmH2O10 and estimating a withdrawal rate of 10%, a sample size of 296 participants was needed. Furthermore, to obtain different predictive equations for both sexes,4 we doubled the sample size to recruit at least 296 females and 296 males. Subjects were stratified into six age groups by decades, aiming for four subjects of each sex and each age group in every centre, and inclusion of a minimum overall number of 30 females and 30 males in each decade.
Multiple linear regression models were used to develop sex-specific reference equations. Firstly, the relationship between PImax/PEmax and other relevant variables was determined. For the categorical variables, this dependence analysis was carried out by using the t-test or U-test (ANOVA or Kruskal–Wallis test, respectively) if two or more than two groups for PImax/PEmax were formed. For continuous variables, Pearson correlation coefficients and scatter plots were used to inspect the strength of linear dependence between variables, and outliers were identified.21 Given that different regression models were not affected by the existence of outliers, we developed a more robust model that could contain more variable data but was still valid within the Gaussian structure of the maximal respiratory pressure distributions. Normality of variables in each sex group was verified for all age subgroups. Finally, an ANOVA test between nested models was performed to choose the most suitable equation. In addition, a comparison model was constructed by using cross-validation techniques22; further details on these analyses are presented in the online Supplementary material.
Secondly, we calculated the LLN of PImax/PEmax for females and males per age group as z-scores based on ≥1.645 SD below group means.8 Moreover, we aimed to define an absolute cut-off for respiratory muscle weakness by using T-scores of ≥2.5 SD below average peak pressure achieved at a young age. To that end, a method used by Dodds et al.13 to define weak grip strength was employed, as described in more detail in the online Supplementary material. All data analyses were performed using R 4.1.3 statistical software (R Foundation for Statistical Computing, 2022).
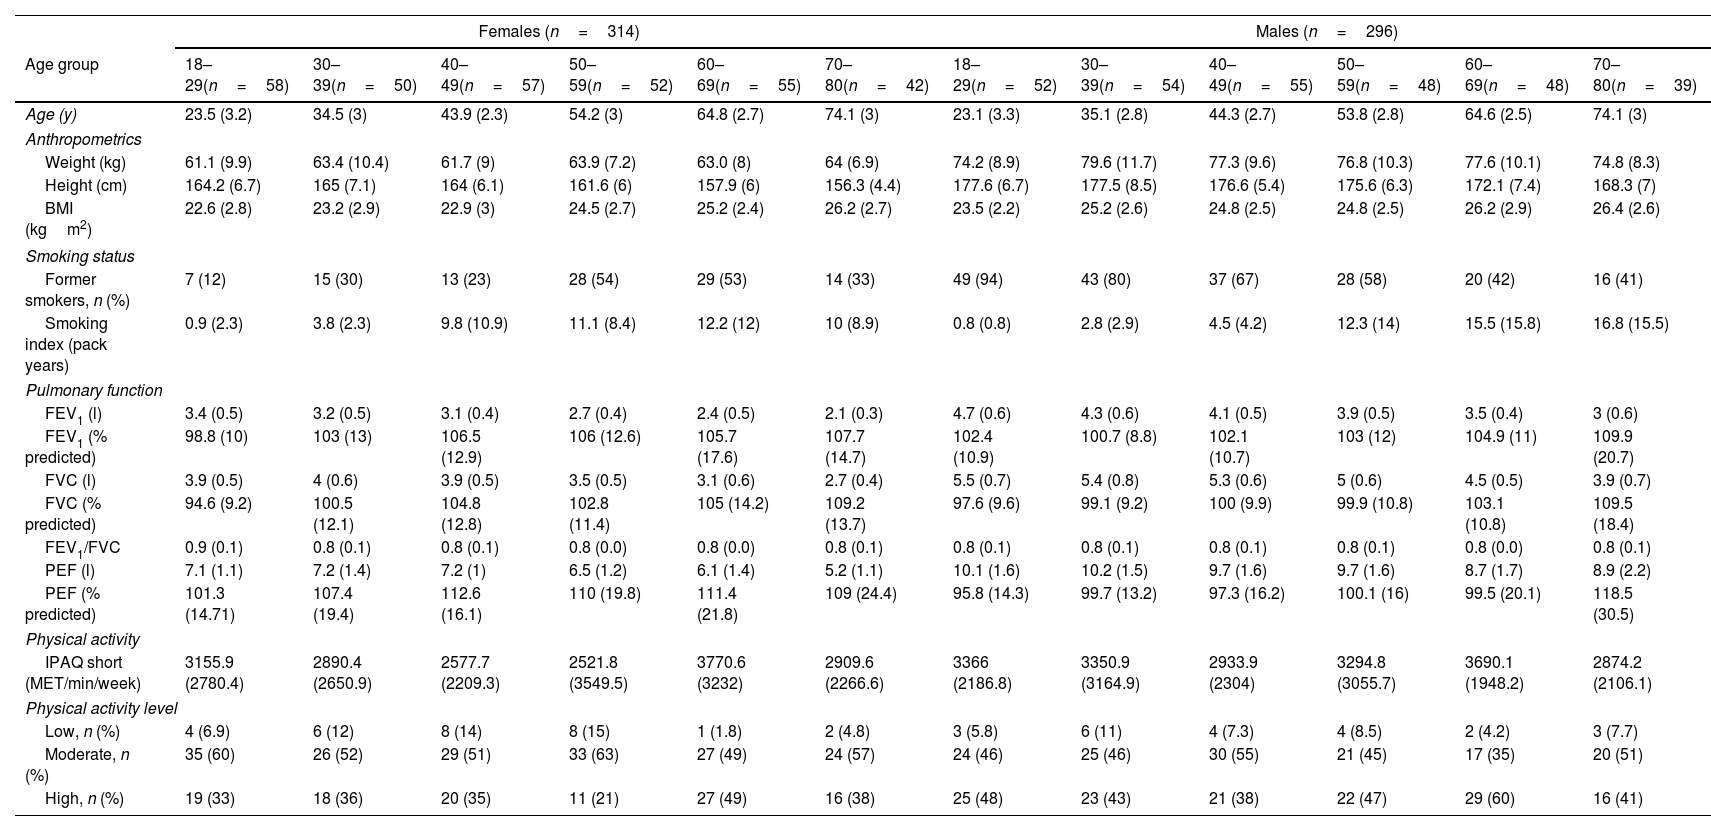
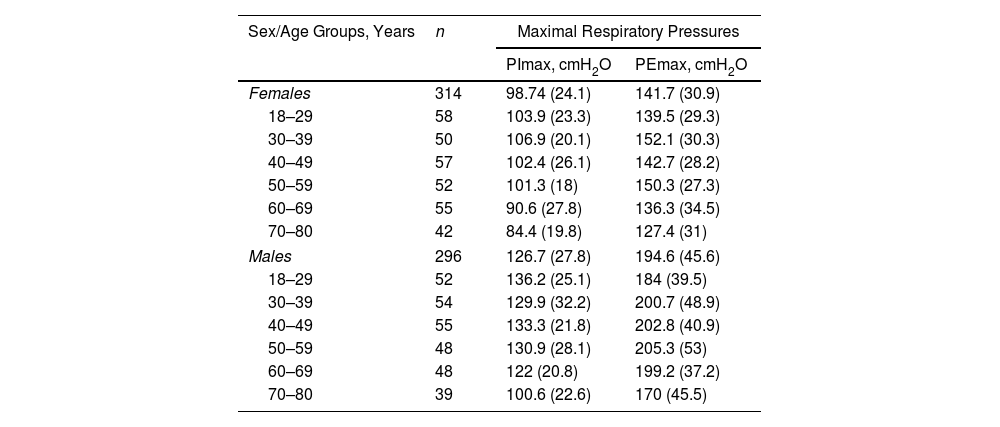
ResultsA total of 718 subjects were recruited and 108 were excluded for reasons detailed in Fig. 1. The final sample consisted of 610 subjects (average age 48 [SD 17] years, 314 females). Physical activity levels were high in 40.5%, moderate in 51.1% and low in 8.4% subjects. Characteristics of the sample are summarized in Table 1. Average (SD) PImax values were 99 (24)cmH2O in females and 127 (28)cmH2O in males; PEmax 142 (31)cmH2O and 195 (46)cmH2O in males (Table 2). No differences in PImax and PEmax were identified between centres when sex and age groups were considered.

Sample Characteristics by Sex and Age Groups.
| Females (n=314) | Males (n=296) | |||||||||||
|---|---|---|---|---|---|---|---|---|---|---|---|---|
| Age group | 18–29(n=58) | 30–39(n=50) | 40–49(n=57) | 50–59(n=52) | 60–69(n=55) | 70–80(n=42) | 18–29(n=52) | 30–39(n=54) | 40–49(n=55) | 50–59(n=48) | 60–69(n=48) | 70–80(n=39) |
| Age (y) | 23.5 (3.2) | 34.5 (3) | 43.9 (2.3) | 54.2 (3) | 64.8 (2.7) | 74.1 (3) | 23.1 (3.3) | 35.1 (2.8) | 44.3 (2.7) | 53.8 (2.8) | 64.6 (2.5) | 74.1 (3) |
| Anthropometrics | ||||||||||||
| Weight (kg) | 61.1 (9.9) | 63.4 (10.4) | 61.7 (9) | 63.9 (7.2) | 63.0 (8) | 64 (6.9) | 74.2 (8.9) | 79.6 (11.7) | 77.3 (9.6) | 76.8 (10.3) | 77.6 (10.1) | 74.8 (8.3) |
| Height (cm) | 164.2 (6.7) | 165 (7.1) | 164 (6.1) | 161.6 (6) | 157.9 (6) | 156.3 (4.4) | 177.6 (6.7) | 177.5 (8.5) | 176.6 (5.4) | 175.6 (6.3) | 172.1 (7.4) | 168.3 (7) |
| BMI (kgm2) | 22.6 (2.8) | 23.2 (2.9) | 22.9 (3) | 24.5 (2.7) | 25.2 (2.4) | 26.2 (2.7) | 23.5 (2.2) | 25.2 (2.6) | 24.8 (2.5) | 24.8 (2.5) | 26.2 (2.9) | 26.4 (2.6) |
| Smoking status | ||||||||||||
| Former smokers, n (%) | 7 (12) | 15 (30) | 13 (23) | 28 (54) | 29 (53) | 14 (33) | 49 (94) | 43 (80) | 37 (67) | 28 (58) | 20 (42) | 16 (41) |
| Smoking index (pack years) | 0.9 (2.3) | 3.8 (2.3) | 9.8 (10.9) | 11.1 (8.4) | 12.2 (12) | 10 (8.9) | 0.8 (0.8) | 2.8 (2.9) | 4.5 (4.2) | 12.3 (14) | 15.5 (15.8) | 16.8 (15.5) |
| Pulmonary function | ||||||||||||
| FEV1 (l) | 3.4 (0.5) | 3.2 (0.5) | 3.1 (0.4) | 2.7 (0.4) | 2.4 (0.5) | 2.1 (0.3) | 4.7 (0.6) | 4.3 (0.6) | 4.1 (0.5) | 3.9 (0.5) | 3.5 (0.4) | 3 (0.6) |
| FEV1 (% predicted) | 98.8 (10) | 103 (13) | 106.5 (12.9) | 106 (12.6) | 105.7 (17.6) | 107.7 (14.7) | 102.4 (10.9) | 100.7 (8.8) | 102.1 (10.7) | 103 (12) | 104.9 (11) | 109.9 (20.7) |
| FVC (l) | 3.9 (0.5) | 4 (0.6) | 3.9 (0.5) | 3.5 (0.5) | 3.1 (0.6) | 2.7 (0.4) | 5.5 (0.7) | 5.4 (0.8) | 5.3 (0.6) | 5 (0.6) | 4.5 (0.5) | 3.9 (0.7) |
| FVC (% predicted) | 94.6 (9.2) | 100.5 (12.1) | 104.8 (12.8) | 102.8 (11.4) | 105 (14.2) | 109.2 (13.7) | 97.6 (9.6) | 99.1 (9.2) | 100 (9.9) | 99.9 (10.8) | 103.1 (10.8) | 109.5 (18.4) |
| FEV1/FVC | 0.9 (0.1) | 0.8 (0.1) | 0.8 (0.1) | 0.8 (0.0) | 0.8 (0.0) | 0.8 (0.1) | 0.8 (0.1) | 0.8 (0.1) | 0.8 (0.1) | 0.8 (0.1) | 0.8 (0.0) | 0.8 (0.1) |
| PEF (l) | 7.1 (1.1) | 7.2 (1.4) | 7.2 (1) | 6.5 (1.2) | 6.1 (1.4) | 5.2 (1.1) | 10.1 (1.6) | 10.2 (1.5) | 9.7 (1.6) | 9.7 (1.6) | 8.7 (1.7) | 8.9 (2.2) |
| PEF (% predicted) | 101.3 (14.71) | 107.4 (19.4) | 112.6 (16.1) | 110 (19.8) | 111.4 (21.8) | 109 (24.4) | 95.8 (14.3) | 99.7 (13.2) | 97.3 (16.2) | 100.1 (16) | 99.5 (20.1) | 118.5 (30.5) |
| Physical activity | ||||||||||||
| IPAQ short (MET/min/week) | 3155.9 (2780.4) | 2890.4 (2650.9) | 2577.7 (2209.3) | 2521.8 (3549.5) | 3770.6 (3232) | 2909.6 (2266.6) | 3366 (2186.8) | 3350.9 (3164.9) | 2933.9 (2304) | 3294.8 (3055.7) | 3690.1 (1948.2) | 2874.2 (2106.1) |
| Physical activity level | ||||||||||||
| Low, n (%) | 4 (6.9) | 6 (12) | 8 (14) | 8 (15) | 1 (1.8) | 2 (4.8) | 3 (5.8) | 6 (11) | 4 (7.3) | 4 (8.5) | 2 (4.2) | 3 (7.7) |
| Moderate, n (%) | 35 (60) | 26 (52) | 29 (51) | 33 (63) | 27 (49) | 24 (57) | 24 (46) | 25 (46) | 30 (55) | 21 (45) | 17 (35) | 20 (51) |
| High, n (%) | 19 (33) | 18 (36) | 20 (35) | 11 (21) | 27 (49) | 16 (38) | 25 (48) | 23 (43) | 21 (38) | 22 (47) | 29 (60) | 16 (41) |
Data are reported as mean (standard deviation) unless otherwise stated.
BMI: body mass index; cm: centimetres; FEV1: forced expiratory volume in one second; FVC: forced vital capacity; IPAQ: International Physical Activity Questionnaire; kg: kilograms; l: litres; MET: metabolic equivalent of task; min: minutes; m: metres; PEF: peak expiratory flow; y: years.
Maximal Respiratory Pressures in Females and Males by Age Groups.
| Sex/Age Groups, Years | n | Maximal Respiratory Pressures | |
|---|---|---|---|
| PImax, cmH2O | PEmax, cmH2O | ||
| Females | 314 | 98.74 (24.1) | 141.7 (30.9) |
| 18–29 | 58 | 103.9 (23.3) | 139.5 (29.3) |
| 30–39 | 50 | 106.9 (20.1) | 152.1 (30.3) |
| 40–49 | 57 | 102.4 (26.1) | 142.7 (28.2) |
| 50–59 | 52 | 101.3 (18) | 150.3 (27.3) |
| 60–69 | 55 | 90.6 (27.8) | 136.3 (34.5) |
| 70–80 | 42 | 84.4 (19.8) | 127.4 (31) |
| Males | 296 | 126.7 (27.8) | 194.6 (45.6) |
| 18–29 | 52 | 136.2 (25.1) | 184 (39.5) |
| 30–39 | 54 | 129.9 (32.2) | 200.7 (48.9) |
| 40–49 | 55 | 133.3 (21.8) | 202.8 (40.9) |
| 50–59 | 48 | 130.9 (28.1) | 205.3 (53) |
| 60–69 | 48 | 122 (20.8) | 199.2 (37.2) |
| 70–80 | 39 | 100.6 (22.6) | 170 (45.5) |
Data are reported as mean (standard deviation) unless otherwise stated.
cmH2O: centimetres of water; PEmax: maximal expiratory pressure; PImax: maximal inspiratory pressure.
Fig. 2 shows the scatter plots with a conditional mean regression curve, in which the association between maximal respiratory pressures and age involves a squared term. In our case, the different regression models were not affected by the existence of outliers. Age and BMI emerged as the predictive variables for both sexes, after using statistical comparisons and cross-validation techniques.22 Reference equations are expressed with the standard error of the estimate (SEE) of each coefficient in brackets. Further details are included in Supplementary material_Table S2:
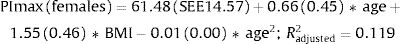
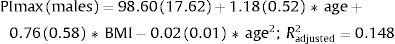
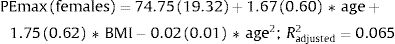
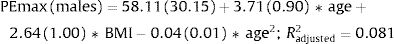

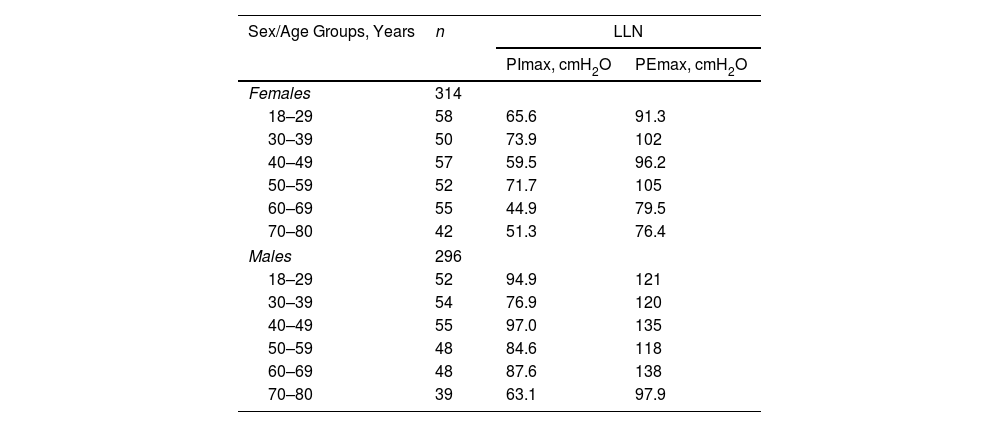
Table 3 shows the LLN of maximal respiratory pressures for females and males by age groups based on z-scores. Peak mean in females [PImax 109 (19); PEmax 158 (31)cmH2O] and males [PImax 138 (22); PEmax 217 (43)cmH2O] were achieved at the age of 30–36 years in females and 38–43 years in males. Cut-off points defining respiratory muscles weakness based on T-scores of ≥2.5 SD below these average peak values in females were 62cmH2O for PImax and 81cmH2O for PEmax. In males, these were 83cmH2O for PImax and 109cmH2O for PEmax (Fig. 3).
Lower Limit of Normal Based on z-Scores of Maximal Respiratory Pressures in Females and Males by Age Groups.
| Sex/Age Groups, Years | n | LLN | |
|---|---|---|---|
| PImax, cmH2O | PEmax, cmH2O | ||
| Females | 314 | ||
| 18–29 | 58 | 65.6 | 91.3 |
| 30–39 | 50 | 73.9 | 102 |
| 40–49 | 57 | 59.5 | 96.2 |
| 50–59 | 52 | 71.7 | 105 |
| 60–69 | 55 | 44.9 | 79.5 |
| 70–80 | 42 | 51.3 | 76.4 |
| Males | 296 | ||
| 18–29 | 52 | 94.9 | 121 |
| 30–39 | 54 | 76.9 | 120 |
| 40–49 | 55 | 97.0 | 135 |
| 50–59 | 48 | 84.6 | 118 |
| 60–69 | 48 | 87.6 | 138 |
| 70–80 | 39 | 63.1 | 97.9 |
Data are reported as mean values.
Age-specific LLN was calculated by using z-scores with the formula LLN=age-range specific mean−1.645 SD.
cmH2O: centimetres of water; LLN: lower limit of normal; PEmax: maximal expiratory pressure; PImax: maximal inspiratory pressure.

This is the first study that provides sex-specific reference equations for PImax and PEmax in a large sample of Spanish healthy volunteers using a standardized methodology according to ATS/ERS guidelines.1,2 Age and BMI were the explanatory variables in both sexes. Furthermore, for the first time we established cut-off limits for identifying respiratory muscle weakness in females and males based on LLN.
We proposed new sex-specific reference equations for PImax/PEmax. In line with previous PImax/PEmax predictive equations,4–6 we confirmed that age was an important determinant of maximal respiratory pressures for both sexes. Moreover, we observed that associations with age were best described by adding a quadratic term, as previously reported by other authors.23,24 We further identified BMI as a predictor of PImax/PEmax in both sexes, in line with previous equations for European,25,26 South American27,28 and Middle Eastern Asian5 populations.
Our equations explained a relatively low proportion of variability in maximal respiratory pressures (R2 adjusted 12% and 15% for PImax and 7% and 8% for PEmax in females and males, respectively), which is in accordance with previous studies evaluating PImax/PEmax separately for both sexes.4 In equations that include sex as an independent variable, the explained variance was higher with R2 values ranging from 25 to 51%.29,30
Our new reference values are quite similar to those from Morales et al.,10 however the methodology used in our study was more robust, using one-second plateau pressures in line with the ATS/ERS guidelines1,2 instead of peak pressures.10 Moreover, our sample was larger and well-distributed across Spain, while Morales et al.10 selected people only from the city of Valencia. Differences between both studies were observed in maximal respiratory pressures in females and males over 60 years, in whom we generally obtained higher values. Since more than 20 years have passed, we may be seeing the phenomenon of a cohort effect.17
To better interpret the LLN of PImax/PEmax, both sex and age-specific z-scores and T-scores were calculated. It has been argued that z-scores may be most suitable for the interpretation of lung function,8 due to the natural decline with age. However, this might not be the case for respiratory muscle function. While average reductions in both respiratory and peripheral muscle strength are observed with increasing age,13 muscle strength can be maintained with specific conditioning exercises.31 Therefore, we believe that T-scores provide an ideal method to establish a cut-off value to define (together with the patient's symptoms) respiratory muscle weakness, similarly to methods that have previously been applied for handgrip strength.13 Our newly established cut-off points highlight the importance of taking sex into account when defining cut-off values for both inspiratory (62 and 83cmH2O for females and males) and expiratory (81 and 109cmH2O for females and males) muscle weakness. These new definitions of inspiratory muscle weakness contrast with global cut-off limits (i.e., PImax≤60cmH2O) that have previously been used to stratify subgroup analyses in systematic reviews of inspiratory muscle training studies.32,33
According to our results, differences in z-scores and T-scores impact on LLN especially in old age, when z-scores always yield lower values. However, despite lower PImax being common, it should not be assumed to be normal in older people, since with ageing, respiratory muscles have to cope with increased rather than decreased loads for a given ventilatory effort. Furthermore, when ventilatory demands are increased, symptoms (e.g., breathlessness) will also increase.34 In order to maintain the balance between respiratory muscle load and capacity, PImax therefore needs to be maintained to a minimum level.35 Expiratory muscle weakness has been defined in this study for the first time. This is a highly relevant clinical finding, given that in some populations (e.g., after a stroke),36 the combination of both expiratory and inspiratory muscle conditioning has offered significant benefits.
This study has some limitations. Firstly, in line with most previous studies, access to a completely random population was not possible due to ethical reasons. It is known that maximal respiratory pressures are effort-dependent manoeuvres that could be influenced by the individual's own motivation.28 However, to minimize this potential volunteer bias, we randomly selected our final sample from a global database of volunteers with a wide geographical distribution. Secondly, visual feedback during PImax/PEmax manoeuvres could improve performance parameters,14 although this was permitted by only three authors.14,37,38 In our study, visual feedback was not provided since one of the participating centres recruited mainly participants with visual impairments. This should be taken into account when performing these tests in clinical practice.
This study also has several strengths. Firstly, we recruited a large sample that was well-balanced between sexes and representative of age groups and geographical distribution in Spain. Strict selection criteria were established, all characteristics that could influence maximal respiratory pressures were excluded (e.g., overweight, smokers, etc.),14 and physical activity level was controlled. Secondly, our methodology was rigorous. The SEPAR protocol was selected to measure PImax/PEmax,20 since it is the most widely used in Spain. The protocol follows internationally agreed standards (i.e., performing assessments from residual and total lung capacity using flanged mouthpieces, registering one-second plateau pressures and providing maximal encouragement).1,2 Furthermore, the SEPAR protocol is considerably stricter in some respects than the ATS/ERS standards (i.e., it requires a minimum of six [instead of five] technically correct manoeuvres, maximal respiratory pressures must be sustained for 3–5 [instead of at least 1.5] seconds, and the maximal variability permitted between the three best attempts is 5% [instead of 10%]).20 Standardized training for all evaluators and strict quality control were also implemented. Thirdly, for the first time, different methods were established to define the LLN of PImax/PEmax, and the LLN based on T-scores was proposed as the most promising method.
Both new reference equations and cut-off points based on T-scores are immediately transferable to clinical practice and will help improve the interpretation of maximal respiratory pressures, avoid misdiagnosis of respiratory muscle weakness and, as such, select more suitable candidates for respiratory muscle conditioning interventions. These equations could also, after validation, be useful for other European populations with similar anthropometric characteristics that do not possess their own reference equations, e.g., Portugal, Belgium, France or Greece and, in European countries where equations were obtained many years ago (e.g., United Kingdom, Italy or Germany25,29,39). To facilitate their practical use, these new reference equations need to be incorporated into commercially available equipment and distributed among lung function laboratories. To that end, an informative campaign will be organized by the authors for dissemination among scientific societies and on social media. Future studies are needed to validate: (1) our new reference equations in European populations with anthropometric characteristics similar to those of Spaniards and (2) proposed cut-off points in different populations, such as patients with COPD and neuromuscular diseases, among others.
ConclusionsWe present the largest dataset of maximal respiratory pressures collected in a European population performed under standardized methodology complying with international standards. Cut-off points have been established for the first time to define respiratory muscle weakness based on empirical data by using T-scores. These will impact on worldwide clinical practice to identify respiratory muscle weakness and select candidates for respiratory muscle conditioning interventions and clinical follow-up. These results have immediate transferability and clinical applicability, and can be used to compare PImax/PEmax values obtained in patients with reference values that could be potentially used in different European populations.
FundingThis work was funded by a research grant from the Spanish Society of Pulmonology and Thoracic Surgery (SEPAR), project 615/2018 and from The Official College of Physiotherapists from Galicia (CoFiGa). Margarita Barral-Fernández was awarded a grant by SEPAR to work full-time on this project for 12 months. Funding for open access charge: Universidade da Coruña/CISUG.
Conflict of InterestsNone declared.
We are grateful to all the volunteers all over Spain who made this study possible. We also wish to thank colleagues who collaborated in the data collection: Mª del Pilar Jorge Cordero (Paraplegics National Hospital of Toledo); Paula San José Herranz (University Hospital of Canarias); Margalida Barceló Bobillo (University Hospital of Son Espases); Saúl Alejandro Caicedo Trujillo and Sebastian Nazar (Blanquerna School of Health Sciences, Ramon Llull University); and Ángeles Fernández Cadenas (General University Hospital Santa Lucía). Finally, we thank to Professor María Amalia Jácome Pumar (University of A Coruña) who provided support to the authors during the review process of this paper.
The following are the supplementary data to this article:


www.publicationethics.org.


Archivos de Bronconeumología follows the Recommendations for the Conduct, Reporting, Editing and Publication of Scholarly Work in Medical Journals