

This report shows the results of a nation-wide survey on spirometry to assess regional differences.
MethodsObservational cross-sectional study conducted by means of a telephone survey in 805 primary care (PC) and specialized centers (SC) in all regions. The survey was carried out among technicians in charge of spirometry and consisted of 36 questions related to the test.
ResultsThe results showed major differences between regions. Most centers had 1–2 spirometers. The number of spirometry tests per week ranged from 2 to 8.9 in PC and between 34.3 and 98.3 in SC. Some training had been given in most centers (63.6%–100% in PC and 60.0%–100% in SC) but not on a regular basis. Most centers used several short-acting bronchodilators for the bronchodilation test, but with insufficient inhalations (2.0–3.8 in PC and 2.0–3.3 in SC) and frequently incorrect waiting time (29.4%–83.3% in PC and 33.3%–87.5% in SC). Daily calibration was not performed in all centers (0%–100% in PC and 66.7%–100% in SC). Significant inter-regional differences in spirometry quality criteria were observed, with 6 or more criteria met in 9.1%–84.6% of PC centers and 37.5%–100% in SC.
ConclusionsOur results show the current situation of spirometry in primary and specialized care in Spain, highlighting considerable variability and areas for improvement. This information should be considered by health officials to improve the quality and accessibility of such tests.
El presente trabajo muestra los resultados de una encuesta nacional sobre espirometría con el objetivo de que sirva para evaluar diferencias territoriales en España.
MétodoEstudio observacional transversal mediante encuesta telefónica de 805 centros de atención primaria (AP) y atención especializada (AE) en todas las comunidades autónomas en España. La encuesta iba dirigida al técnico encargado de la realización de espirometrías y constaba de 36 preguntas sobre el uso del espirómetro.
ResultadosLos resultados presentaban una amplia variabilidad entre comunidades autónomas. La mayoría de los centros tenían 1-2 espirómetros. El número de espirometrías por semana oscilaba entre 2 y 8,9 en AP y entre 34,3 y 98,3 en AE. La mayoría de los centros habían recibido algún tipo de formación (63,6-100% en AP y 60,0-100% en AE), pero no solía ser periódica. La mayoría de los centros emplean varios broncodilatadores de acción corta para la prueba broncodilatadora, pero con un número de inhalaciones insuficiente (2,0-3,8 en AP y 2,0-3,3 en AE) y un tiempo de espera frecuentemente incorrecto (29,4-83,3% en AP y 33,3-87,5% en AE). No todos los centros calibraban el espirómetro a diario (0-100% en AP y 66,7-100% en AE). Se observaron notables diferencias en los criterios de calidad de la espirometría entre comunidades autónomas, con 6 o más criterios cumplidos en 9,1-84,6% de AP y 37,5-100% en AE.
ConclusionesNuestros resultados retratan la situación actual de la espirometría en España en AP y AE, mostrando una considerable variabilidad y áreas de mejora. Esta información debería ser tenida en cuenta por los responsables sanitarios para mejorar su calidad y accesibilidad.
Spirometry is required for the diagnosis of numerous chronic respiratory diseases, and consists of measuring dynamic volumes and expiratory flow rates. The Global Initiative for Asthma (GINA)1 recommends spirometry for measuring airflow limitation and its reversibility, and to confirm a diagnosis of asthma. According to the Global Initiative for the Diagnosis, Management and Prevention of Chronic Obstructive Pulmonary Disease (GOLD COPD), spirometry is a requirement for diagnosis and an essential tool for establishing the best possible treatment.2 Similarly, Spanish COPD guidelines (GesEPOC) recommend that healthcare staff treating patients with COPD should be competent in its early diagnosis and in performing and interpreting forced spirometry, and that this should used as a confirmatory test when COPD is suspected in an active or former smoker with chronic respiratory symptoms.3 In fact, the prevention as well as an early detection of COPD is 1 of the 6 key strategies in the Spanish National Health System's Strategy on COPD, which recommends developing initiatives to extend the use of spirometry, or setting up screening programs.4 The use of spirometry in the assessment of restrictive ventilatory impairment is equally important, as in the case of interstitial lung diseases and rib cage abnormalities.5,6
The implementation of spirometry in the Spanish National Health System is known to vary greatly depending on the region and care setting. A recent study in Spain (Spirometry in Spain: 3E Study) evaluated the use of spirometry in primary care (PC) and specialized care (SC) centers, revealing major differences in the use, training and maintenance of spirometers.7 This study consisted of a telephone interview with the technician in charge of spirometry testing in a randomized sample of 805 Spanish PC and SC centers. Although the overall results of the project have been published,7 the differences between regions (known as autonomous communities or ACs) were not reported. This study analyzes the data in more depth to distribute the results of the 3E study by AC, and enable the situation in the different regions to be evaluated. This will reveal the real status in each AC and provide information that can be used to create specific strategies to strengthen regional weaknesses.
MethodsThe methodology used in the 3E study has previously been described in detail.7 Briefly, this was a cross-sectional observational study consisting of a telephone survey of 805 PC and SC centers in Spain selected randomly from among those routinely assessing adult patients with chronic respiratory disease.
The survey was completed by the technician in charge of performing spirometry in each center, and the questionnaire consisted of 36 items dealing with human and material resources, training received, use of the spirometer, aspects of the bronchodilator test (BDT), and calibration and maintenance of the equipment. The survey was carried out between January and March 2012 by means of a semi-structured, computer-based interview that took, on average, 20min.
The centers surveyed were randomly selected within each AC in order to include 20% of all PC centers and 25% of all SC centers in each region. If a particular center stated that they did not have a spirometer, did not perform spirometry, or declined the invitation to participate in the survey, it was replaced by another until the target sample size was reached.
The quality of spirometry testing was evaluated using 8 criteria: conducted in a specific location, conducted according to a specific schedule, regular spirometry training given, patients given recommendations before performing the test, weather station available, equipment calibrated daily, person in charge of maintenance, and a different filter used for each patient. As the study was a survey and not a spirometry audit, information on spirometry quality could not be collected.
BDT performance was compared against current guidelines, and 5 quality criteria were identified: inhalation therapy suspended prior to the test, bronchodilator used, dose administered, wait time according to the drug used, and criteria used to identify a positive test. In accordance with current BDT guidelines,8,9 the following criteria were taken to be correct: salbutamol, terbutaline and ipratropium were considered the correct drugs for the test; correct doses were 400mg (4 puffs of salbutamol using a measured dose inhaler [MDI]), 1000mg of terbutaline (2 puffs using the turbuhaler), and 80μg of ipratropium bromide (4 puffs using the MDI); acceptable wait time was ≥10min, up to 15min after a short-acting β2-agonist, and 30min after a short-acting anti-muscarinic; a correct positive result was an increase in FEV1 of at least 200ml and 12% with respect to the baseline.
Data AnalysisData analysis was performed using Statistical Package for Social Sciences (SPSS) version 18.0 (IBM Corporation, Somers, NY, USA). Absolute and relative frequencies were used to describe categorical variables, and mean and standard deviation to describe quantitative variables. Inferential studies were performed by comparing the PC and SC data from each AC with the mean of the other ACs using the Chi-square test with Fisher's correction when necessary. The Student's t-test was used for independent data after applying the Levene test to check the equality of variances. To distribute BDT criteria the analysis focused on criteria met: if no data were available in a particular case, criteria were considered not met. Using this information, maps were constructed showing the mean values for each AC. The alpha error was set at 0.05.
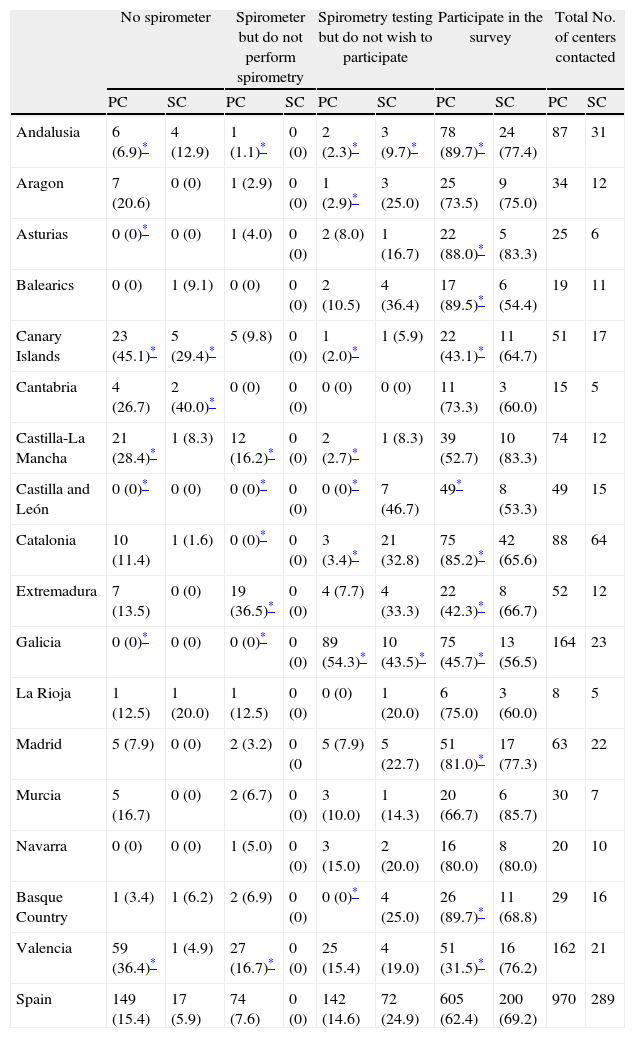
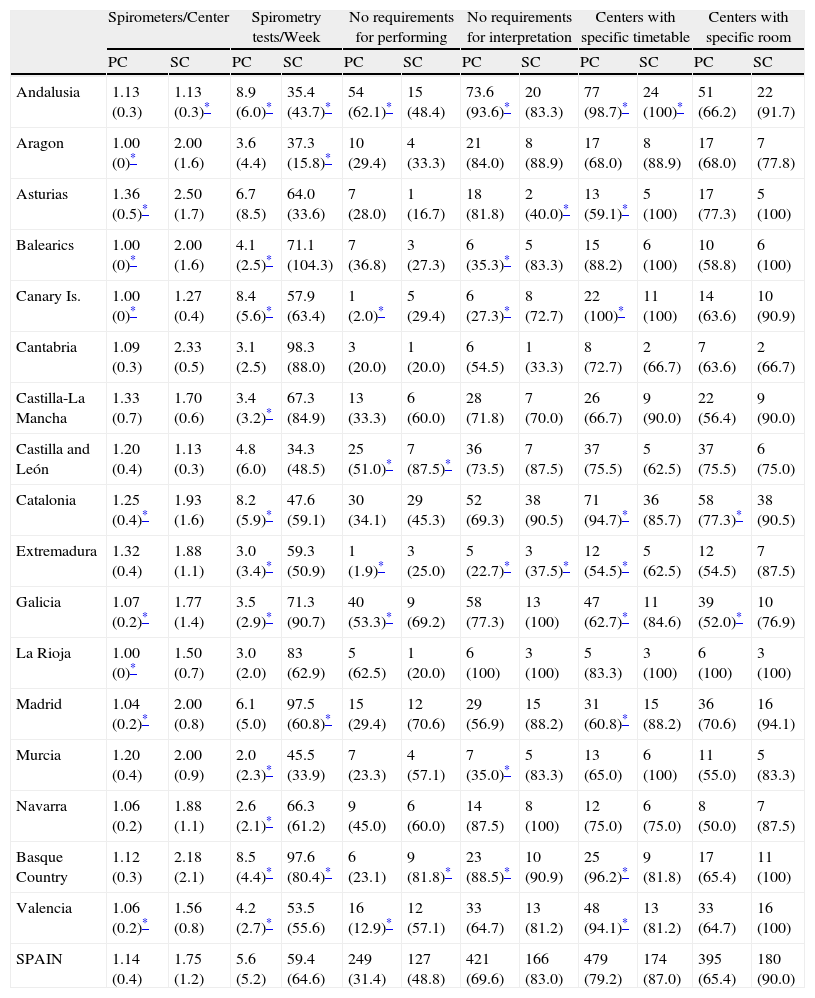
ResultsA total of 1259 PC and SC centers were contacted, of which 805 eventually participated. Distribution of participating centers by AC is shown in Table 1. Information on spirometer use between ACs is shown in Table 2. Most PC and SC centers had between 1 and 2 spirometers. However, significantly fewer spirometries were performed each week in PC vs SC (P<.05). Geographical distribution of the number of tests per week by AC is shown in Fig. 1. When asked about their needs in terms of the performance and interpretation of spirometry tests, a large number of centers indicated no such needs (Table 2). In others, meanwhile, the most common demands were better training and a proper room, while in terms of test interpretation most centers expressed a need for good training followed by the availability of staff qualified to interpret test results. There was a considerable variability in the availability of specific areas and timetables for performing spirometry tests between ACs, although there was little difference with respect to the national average (Table 2).
Participating and Non-Participating Centers, According to Healthcare Setting and Autonomous Community.
| No spirometer | Spirometer but do not perform spirometry | Spirometry testing but do not wish to participate | Participate in the survey | Total No. of centers contacted | ||||||
| PC | SC | PC | SC | PC | SC | PC | SC | PC | SC | |
| Andalusia | 6 (6.9)* | 4 (12.9) | 1 (1.1)* | 0 (0) | 2 (2.3)* | 3 (9.7)* | 78 (89.7)* | 24 (77.4) | 87 | 31 |
| Aragon | 7 (20.6) | 0 (0) | 1 (2.9) | 0 (0) | 1 (2.9)* | 3 (25.0) | 25 (73.5) | 9 (75.0) | 34 | 12 |
| Asturias | 0 (0)* | 0 (0) | 1 (4.0) | 0 (0) | 2 (8.0) | 1 (16.7) | 22 (88.0)* | 5 (83.3) | 25 | 6 |
| Balearics | 0 (0) | 1 (9.1) | 0 (0) | 0 (0) | 2 (10.5) | 4 (36.4) | 17 (89.5)* | 6 (54.4) | 19 | 11 |
| Canary Islands | 23 (45.1)* | 5 (29.4)* | 5 (9.8) | 0 (0) | 1 (2.0)* | 1 (5.9) | 22 (43.1)* | 11 (64.7) | 51 | 17 |
| Cantabria | 4 (26.7) | 2 (40.0)* | 0 (0) | 0 (0) | 0 (0) | 0 (0) | 11 (73.3) | 3 (60.0) | 15 | 5 |
| Castilla-La Mancha | 21 (28.4)* | 1 (8.3) | 12 (16.2)* | 0 (0) | 2 (2.7)* | 1 (8.3) | 39 (52.7) | 10 (83.3) | 74 | 12 |
| Castilla and León | 0 (0)* | 0 (0) | 0 (0)* | 0 (0) | 0 (0)* | 7 (46.7) | 49* | 8 (53.3) | 49 | 15 |
| Catalonia | 10 (11.4) | 1 (1.6) | 0 (0)* | 0 (0) | 3 (3.4)* | 21 (32.8) | 75 (85.2)* | 42 (65.6) | 88 | 64 |
| Extremadura | 7 (13.5) | 0 (0) | 19 (36.5)* | 0 (0) | 4 (7.7) | 4 (33.3) | 22 (42.3)* | 8 (66.7) | 52 | 12 |
| Galicia | 0 (0)* | 0 (0) | 0 (0)* | 0 (0) | 89 (54.3)* | 10 (43.5)* | 75 (45.7)* | 13 (56.5) | 164 | 23 |
| La Rioja | 1 (12.5) | 1 (20.0) | 1 (12.5) | 0 (0) | 0 (0) | 1 (20.0) | 6 (75.0) | 3 (60.0) | 8 | 5 |
| Madrid | 5 (7.9) | 0 (0) | 2 (3.2) | 0 (0 | 5 (7.9) | 5 (22.7) | 51 (81.0)* | 17 (77.3) | 63 | 22 |
| Murcia | 5 (16.7) | 0 (0) | 2 (6.7) | 0 (0) | 3 (10.0) | 1 (14.3) | 20 (66.7) | 6 (85.7) | 30 | 7 |
| Navarra | 0 (0) | 0 (0) | 1 (5.0) | 0 (0) | 3 (15.0) | 2 (20.0) | 16 (80.0) | 8 (80.0) | 20 | 10 |
| Basque Country | 1 (3.4) | 1 (6.2) | 2 (6.9) | 0 (0) | 0 (0)* | 4 (25.0) | 26 (89.7)* | 11 (68.8) | 29 | 16 |
| Valencia | 59 (36.4)* | 1 (4.9) | 27 (16.7)* | 0 (0) | 25 (15.4) | 4 (19.0) | 51 (31.5)* | 16 (76.2) | 162 | 21 |
| Spain | 149 (15.4) | 17 (5.9) | 74 (7.6) | 0 (0) | 142 (14.6) | 72 (24.9) | 605 (62.4) | 200 (69.2) | 970 | 289 |
Data expressed in absolute values (%) based on all centers contacted in each healthcare setting within each autonomous community.
Resources Available in Each Center, According to Healthcare Setting and Autonomous Community.
| Spirometers/Center | Spirometry tests/Week | No requirements for performing | No requirements for interpretation | Centers with specific timetable | Centers with specific room | |||||||
| PC | SC | PC | SC | PC | SC | PC | SC | PC | SC | PC | SC | |
| Andalusia | 1.13 (0.3) | 1.13 (0.3)* | 8.9 (6.0)* | 35.4 (43.7)* | 54 (62.1)* | 15 (48.4) | 73.6 (93.6)* | 20 (83.3) | 77 (98.7)* | 24 (100)* | 51 (66.2) | 22 (91.7) |
| Aragon | 1.00 (0)* | 2.00 (1.6) | 3.6 (4.4) | 37.3 (15.8)* | 10 (29.4) | 4 (33.3) | 21 (84.0) | 8 (88.9) | 17 (68.0) | 8 (88.9) | 17 (68.0) | 7 (77.8) |
| Asturias | 1.36 (0.5)* | 2.50 (1.7) | 6.7 (8.5) | 64.0 (33.6) | 7 (28.0) | 1 (16.7) | 18 (81.8) | 2 (40.0)* | 13 (59.1)* | 5 (100) | 17 (77.3) | 5 (100) |
| Balearics | 1.00 (0)* | 2.00 (1.6) | 4.1 (2.5)* | 71.1 (104.3) | 7 (36.8) | 3 (27.3) | 6 (35.3)* | 5 (83.3) | 15 (88.2) | 6 (100) | 10 (58.8) | 6 (100) |
| Canary Is. | 1.00 (0)* | 1.27 (0.4) | 8.4 (5.6)* | 57.9 (63.4) | 1 (2.0)* | 5 (29.4) | 6 (27.3)* | 8 (72.7) | 22 (100)* | 11 (100) | 14 (63.6) | 10 (90.9) |
| Cantabria | 1.09 (0.3) | 2.33 (0.5) | 3.1 (2.5) | 98.3 (88.0) | 3 (20.0) | 1 (20.0) | 6 (54.5) | 1 (33.3) | 8 (72.7) | 2 (66.7) | 7 (63.6) | 2 (66.7) |
| Castilla-La Mancha | 1.33 (0.7) | 1.70 (0.6) | 3.4 (3.2)* | 67.3 (84.9) | 13 (33.3) | 6 (60.0) | 28 (71.8) | 7 (70.0) | 26 (66.7) | 9 (90.0) | 22 (56.4) | 9 (90.0) |
| Castilla and León | 1.20 (0.4) | 1.13 (0.3) | 4.8 (6.0) | 34.3 (48.5) | 25 (51.0)* | 7 (87.5)* | 36 (73.5) | 7 (87.5) | 37 (75.5) | 5 (62.5) | 37 (75.5) | 6 (75.0) |
| Catalonia | 1.25 (0.4)* | 1.93 (1.6) | 8.2 (5.9)* | 47.6 (59.1) | 30 (34.1) | 29 (45.3) | 52 (69.3) | 38 (90.5) | 71 (94.7)* | 36 (85.7) | 58 (77.3)* | 38 (90.5) |
| Extremadura | 1.32 (0.4) | 1.88 (1.1) | 3.0 (3.4)* | 59.3 (50.9) | 1 (1.9)* | 3 (25.0) | 5 (22.7)* | 3 (37.5)* | 12 (54.5)* | 5 (62.5) | 12 (54.5) | 7 (87.5) |
| Galicia | 1.07 (0.2)* | 1.77 (1.4) | 3.5 (2.9)* | 71.3 (90.7) | 40 (53.3)* | 9 (69.2) | 58 (77.3) | 13 (100) | 47 (62.7)* | 11 (84.6) | 39 (52.0)* | 10 (76.9) |
| La Rioja | 1.00 (0)* | 1.50 (0.7) | 3.0 (2.0) | 83 (62.9) | 5 (62.5) | 1 (20.0) | 6 (100) | 3 (100) | 5 (83.3) | 3 (100) | 6 (100) | 3 (100) |
| Madrid | 1.04 (0.2)* | 2.00 (0.8) | 6.1 (5.0) | 97.5 (60.8)* | 15 (29.4) | 12 (70.6) | 29 (56.9) | 15 (88.2) | 31 (60.8)* | 15 (88.2) | 36 (70.6) | 16 (94.1) |
| Murcia | 1.20 (0.4) | 2.00 (0.9) | 2.0 (2.3)* | 45.5 (33.9) | 7 (23.3) | 4 (57.1) | 7 (35.0)* | 5 (83.3) | 13 (65.0) | 6 (100) | 11 (55.0) | 5 (83.3) |
| Navarra | 1.06 (0.2) | 1.88 (1.1) | 2.6 (2.1)* | 66.3 (61.2) | 9 (45.0) | 6 (60.0) | 14 (87.5) | 8 (100) | 12 (75.0) | 6 (75.0) | 8 (50.0) | 7 (87.5) |
| Basque Country | 1.12 (0.3) | 2.18 (2.1) | 8.5 (4.4)* | 97.6 (80.4)* | 6 (23.1) | 9 (81.8)* | 23 (88.5)* | 10 (90.9) | 25 (96.2)* | 9 (81.8) | 17 (65.4) | 11 (100) |
| Valencia | 1.06 (0.2)* | 1.56 (0.8) | 4.2 (2.7)* | 53.5 (55.6) | 16 (12.9)* | 12 (57.1) | 33 (64.7) | 13 (81.2) | 48 (94.1)* | 13 (81.2) | 33 (64.7) | 16 (100) |
| SPAIN | 1.14 (0.4) | 1.75 (1.2) | 5.6 (5.2) | 59.4 (64.6) | 249 (31.4) | 127 (48.8) | 421 (69.6) | 166 (83.0) | 479 (79.2) | 174 (87.0) | 395 (65.4) | 180 (90.0) |
Data expressed as mean (standard deviation) or absolute frequencies (%) based on all centers in each healthcare setting within each autonomous community, as applicable.
 and compliance with quality criteria (C and D) in PC (A–C) and SC (B–D).")
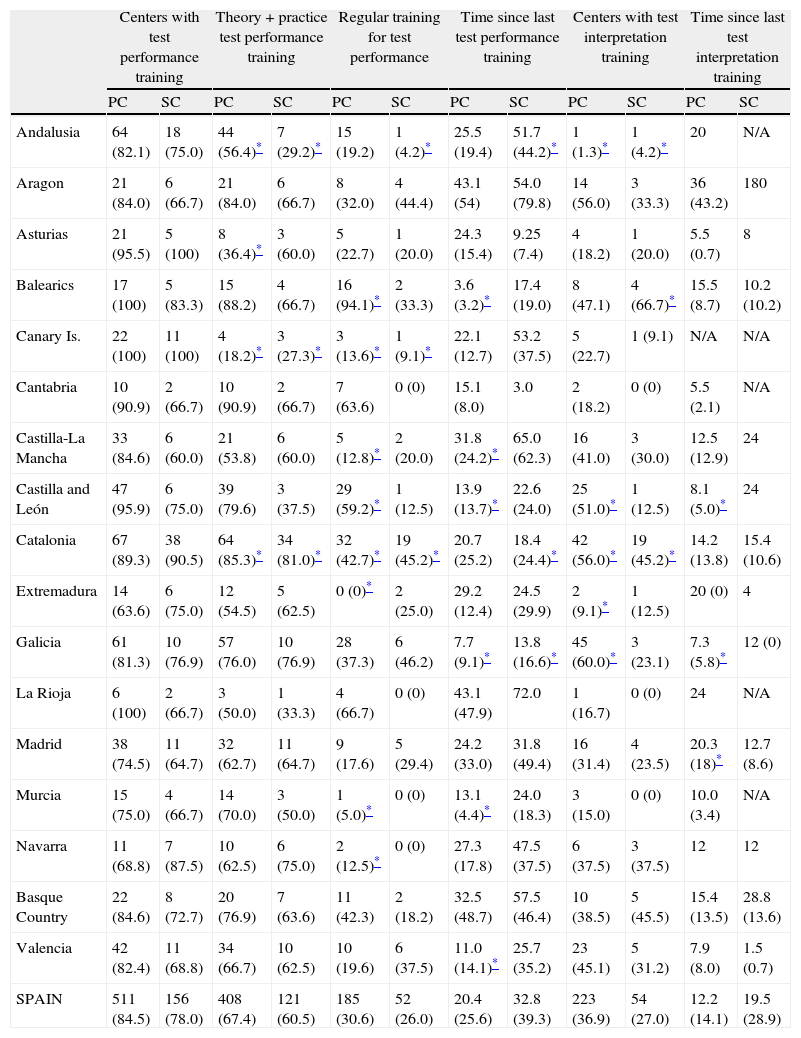
Most centers had received some type of spirometry training (Table 3). This was both theoretical and practical in most, but training was generally sporadic, with a mean of 20.4 months (PC) and 32.8 months (SC) from the last training session, which was not repeated at a later date. Training in interpreting results was less frequent, with notable differences between ACs.
Training in Centers, According to Healthcare Setting and Autonomous Community.
| Centers with test performance training | Theory+practice test performance training | Regular training for test performance | Time since last test performance training | Centers with test interpretation training | Time since last test interpretation training | |||||||
| PC | SC | PC | SC | PC | SC | PC | SC | PC | SC | PC | SC | |
| Andalusia | 64 (82.1) | 18 (75.0) | 44 (56.4)* | 7 (29.2)* | 15 (19.2) | 1 (4.2)* | 25.5 (19.4) | 51.7 (44.2)* | 1 (1.3)* | 1 (4.2)* | 20 | N/A |
| Aragon | 21 (84.0) | 6 (66.7) | 21 (84.0) | 6 (66.7) | 8 (32.0) | 4 (44.4) | 43.1 (54) | 54.0 (79.8) | 14 (56.0) | 3 (33.3) | 36 (43.2) | 180 |
| Asturias | 21 (95.5) | 5 (100) | 8 (36.4)* | 3 (60.0) | 5 (22.7) | 1 (20.0) | 24.3 (15.4) | 9.25 (7.4) | 4 (18.2) | 1 (20.0) | 5.5 (0.7) | 8 |
| Balearics | 17 (100) | 5 (83.3) | 15 (88.2) | 4 (66.7) | 16 (94.1)* | 2 (33.3) | 3.6 (3.2)* | 17.4 (19.0) | 8 (47.1) | 4 (66.7)* | 15.5 (8.7) | 10.2 (10.2) |
| Canary Is. | 22 (100) | 11 (100) | 4 (18.2)* | 3 (27.3)* | 3 (13.6)* | 1 (9.1)* | 22.1 (12.7) | 53.2 (37.5) | 5 (22.7) | 1 (9.1) | N/A | N/A |
| Cantabria | 10 (90.9) | 2 (66.7) | 10 (90.9) | 2 (66.7) | 7 (63.6) | 0 (0) | 15.1 (8.0) | 3.0 | 2 (18.2) | 0 (0) | 5.5 (2.1) | N/A |
| Castilla-La Mancha | 33 (84.6) | 6 (60.0) | 21 (53.8) | 6 (60.0) | 5 (12.8)* | 2 (20.0) | 31.8 (24.2)* | 65.0 (62.3) | 16 (41.0) | 3 (30.0) | 12.5 (12.9) | 24 |
| Castilla and León | 47 (95.9) | 6 (75.0) | 39 (79.6) | 3 (37.5) | 29 (59.2)* | 1 (12.5) | 13.9 (13.7)* | 22.6 (24.0) | 25 (51.0)* | 1 (12.5) | 8.1 (5.0)* | 24 |
| Catalonia | 67 (89.3) | 38 (90.5) | 64 (85.3)* | 34 (81.0)* | 32 (42.7)* | 19 (45.2)* | 20.7 (25.2) | 18.4 (24.4)* | 42 (56.0)* | 19 (45.2)* | 14.2 (13.8) | 15.4 (10.6) |
| Extremadura | 14 (63.6) | 6 (75.0) | 12 (54.5) | 5 (62.5) | 0 (0)* | 2 (25.0) | 29.2 (12.4) | 24.5 (29.9) | 2 (9.1)* | 1 (12.5) | 20 (0) | 4 |
| Galicia | 61 (81.3) | 10 (76.9) | 57 (76.0) | 10 (76.9) | 28 (37.3) | 6 (46.2) | 7.7 (9.1)* | 13.8 (16.6)* | 45 (60.0)* | 3 (23.1) | 7.3 (5.8)* | 12 (0) |
| La Rioja | 6 (100) | 2 (66.7) | 3 (50.0) | 1 (33.3) | 4 (66.7) | 0 (0) | 43.1 (47.9) | 72.0 | 1 (16.7) | 0 (0) | 24 | N/A |
| Madrid | 38 (74.5) | 11 (64.7) | 32 (62.7) | 11 (64.7) | 9 (17.6) | 5 (29.4) | 24.2 (33.0) | 31.8 (49.4) | 16 (31.4) | 4 (23.5) | 20.3 (18)* | 12.7 (8.6) |
| Murcia | 15 (75.0) | 4 (66.7) | 14 (70.0) | 3 (50.0) | 1 (5.0)* | 0 (0) | 13.1 (4.4)* | 24.0 (18.3) | 3 (15.0) | 0 (0) | 10.0 (3.4) | N/A |
| Navarra | 11 (68.8) | 7 (87.5) | 10 (62.5) | 6 (75.0) | 2 (12.5)* | 0 (0) | 27.3 (17.8) | 47.5 (37.5) | 6 (37.5) | 3 (37.5) | 12 | 12 |
| Basque Country | 22 (84.6) | 8 (72.7) | 20 (76.9) | 7 (63.6) | 11 (42.3) | 2 (18.2) | 32.5 (48.7) | 57.5 (46.4) | 10 (38.5) | 5 (45.5) | 15.4 (13.5) | 28.8 (13.6) |
| Valencia | 42 (82.4) | 11 (68.8) | 34 (66.7) | 10 (62.5) | 10 (19.6) | 6 (37.5) | 11.0 (14.1)* | 25.7 (35.2) | 23 (45.1) | 5 (31.2) | 7.9 (8.0) | 1.5 (0.7) |
| SPAIN | 511 (84.5) | 156 (78.0) | 408 (67.4) | 121 (60.5) | 185 (30.6) | 52 (26.0) | 20.4 (25.6) | 32.8 (39.3) | 223 (36.9) | 54 (27.0) | 12.2 (14.1) | 19.5 (28.9) |
N/A: not available.
Data expressed as mean (standard deviation) or absolute frequencies (%) based on all centers in each healthcare setting within each autonomous community, as applicable.
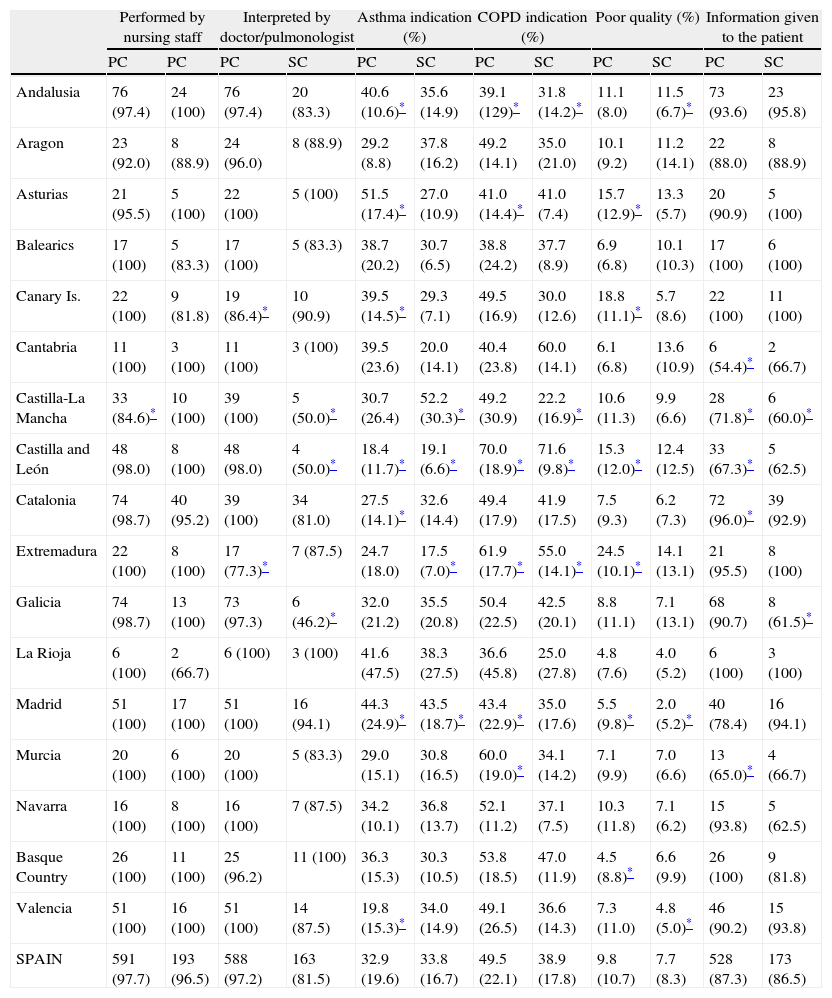
In terms of use (Table 4), in most centers the test was performed by nursing staff and interpreted by the family doctor or a pulmonologist at each healthcare level. Most of the indications were for asthma or COPD studies, with an estimated <15% of tests considered invalid.
Use of the Spirometer in Centers, According to Healthcare Setting and Autonomous Community.
| Performed by nursing staff | Interpreted by doctor/pulmonologist | Asthma indication (%) | COPD indication (%) | Poor quality (%) | Information given to the patient | |||||||
| PC | PC | PC | SC | PC | SC | PC | SC | PC | SC | PC | SC | |
| Andalusia | 76 (97.4) | 24 (100) | 76 (97.4) | 20 (83.3) | 40.6 (10.6)* | 35.6 (14.9) | 39.1 (129)* | 31.8 (14.2)* | 11.1 (8.0) | 11.5 (6.7)* | 73 (93.6) | 23 (95.8) |
| Aragon | 23 (92.0) | 8 (88.9) | 24 (96.0) | 8 (88.9) | 29.2 (8.8) | 37.8 (16.2) | 49.2 (14.1) | 35.0 (21.0) | 10.1 (9.2) | 11.2 (14.1) | 22 (88.0) | 8 (88.9) |
| Asturias | 21 (95.5) | 5 (100) | 22 (100) | 5 (100) | 51.5 (17.4)* | 27.0 (10.9) | 41.0 (14.4)* | 41.0 (7.4) | 15.7 (12.9)* | 13.3 (5.7) | 20 (90.9) | 5 (100) |
| Balearics | 17 (100) | 5 (83.3) | 17 (100) | 5 (83.3) | 38.7 (20.2) | 30.7 (6.5) | 38.8 (24.2) | 37.7 (8.9) | 6.9 (6.8) | 10.1 (10.3) | 17 (100) | 6 (100) |
| Canary Is. | 22 (100) | 9 (81.8) | 19 (86.4)* | 10 (90.9) | 39.5 (14.5)* | 29.3 (7.1) | 49.5 (16.9) | 30.0 (12.6) | 18.8 (11.1)* | 5.7 (8.6) | 22 (100) | 11 (100) |
| Cantabria | 11 (100) | 3 (100) | 11 (100) | 3 (100) | 39.5 (23.6) | 20.0 (14.1) | 40.4 (23.8) | 60.0 (14.1) | 6.1 (6.8) | 13.6 (10.9) | 6 (54.4)* | 2 (66.7) |
| Castilla-La Mancha | 33 (84.6)* | 10 (100) | 39 (100) | 5 (50.0)* | 30.7 (26.4) | 52.2 (30.3)* | 49.2 (30.9) | 22.2 (16.9)* | 10.6 (11.3) | 9.9 (6.6) | 28 (71.8)* | 6 (60.0)* |
| Castilla and León | 48 (98.0) | 8 (100) | 48 (98.0) | 4 (50.0)* | 18.4 (11.7)* | 19.1 (6.6)* | 70.0 (18.9)* | 71.6 (9.8)* | 15.3 (12.0)* | 12.4 (12.5) | 33 (67.3)* | 5 (62.5) |
| Catalonia | 74 (98.7) | 40 (95.2) | 39 (100) | 34 (81.0) | 27.5 (14.1)* | 32.6 (14.4) | 49.4 (17.9) | 41.9 (17.5) | 7.5 (9.3) | 6.2 (7.3) | 72 (96.0)* | 39 (92.9) |
| Extremadura | 22 (100) | 8 (100) | 17 (77.3)* | 7 (87.5) | 24.7 (18.0) | 17.5 (7.0)* | 61.9 (17.7)* | 55.0 (14.1)* | 24.5 (10.1)* | 14.1 (13.1) | 21 (95.5) | 8 (100) |
| Galicia | 74 (98.7) | 13 (100) | 73 (97.3) | 6 (46.2)* | 32.0 (21.2) | 35.5 (20.8) | 50.4 (22.5) | 42.5 (20.1) | 8.8 (11.1) | 7.1 (13.1) | 68 (90.7) | 8 (61.5)* |
| La Rioja | 6 (100) | 2 (66.7) | 6 (100) | 3 (100) | 41.6 (47.5) | 38.3 (27.5) | 36.6 (45.8) | 25.0 (27.8) | 4.8 (7.6) | 4.0 (5.2) | 6 (100) | 3 (100) |
| Madrid | 51 (100) | 17 (100) | 51 (100) | 16 (94.1) | 44.3 (24.9)* | 43.5 (18.7)* | 43.4 (22.9)* | 35.0 (17.6) | 5.5 (9.8)* | 2.0 (5.2)* | 40 (78.4) | 16 (94.1) |
| Murcia | 20 (100) | 6 (100) | 20 (100) | 5 (83.3) | 29.0 (15.1) | 30.8 (16.5) | 60.0 (19.0)* | 34.1 (14.2) | 7.1 (9.9) | 7.0 (6.6) | 13 (65.0)* | 4 (66.7) |
| Navarra | 16 (100) | 8 (100) | 16 (100) | 7 (87.5) | 34.2 (10.1) | 36.8 (13.7) | 52.1 (11.2) | 37.1 (7.5) | 10.3 (11.8) | 7.1 (6.2) | 15 (93.8) | 5 (62.5) |
| Basque Country | 26 (100) | 11 (100) | 25 (96.2) | 11 (100) | 36.3 (15.3) | 30.3 (10.5) | 53.8 (18.5) | 47.0 (11.9) | 4.5 (8.8)* | 6.6 (9.9) | 26 (100) | 9 (81.8) |
| Valencia | 51 (100) | 16 (100) | 51 (100) | 14 (87.5) | 19.8 (15.3)* | 34.0 (14.9) | 49.1 (26.5) | 36.6 (14.3) | 7.3 (11.0) | 4.8 (5.0)* | 46 (90.2) | 15 (93.8) |
| SPAIN | 591 (97.7) | 193 (96.5) | 588 (97.2) | 163 (81.5) | 32.9 (19.6) | 33.8 (16.7) | 49.5 (22.1) | 38.9 (17.8) | 9.8 (10.7) | 7.7 (8.3) | 528 (87.3) | 173 (86.5) |
Data expressed as mean (standard deviation) or absolute frequencies (%) based on all centers in each healthcare setting within each autonomous community, as applicable.
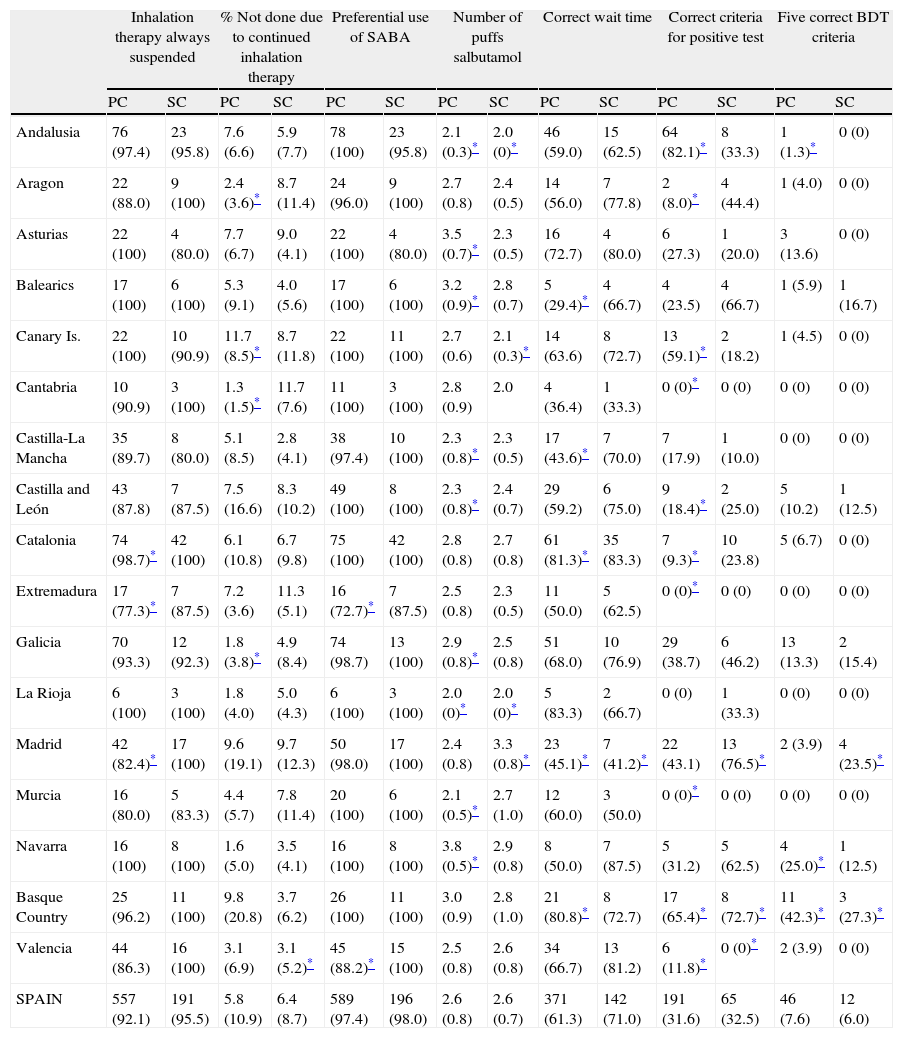
There was significant variability in the different BDT aspects measured (Table 5). Most centers used short-acting β2 agonists, but the number of puffs was insufficient and the wait time was often incorrect. The criteria to be met for a positive BDT result varied significantly, being correct in less than one third of centers surveyed. In general, very few centers met the 5 quality criteria.
Bronchodilator Test in Centers, According to Healthcare Setting and Autonomous Community.
| Inhalation therapy always suspended | % Not done due to continued inhalation therapy | Preferential use of SABA | Number of puffs salbutamol | Correct wait time | Correct criteria for positive test | Five correct BDT criteria | ||||||||
| PC | SC | PC | SC | PC | SC | PC | SC | PC | SC | PC | SC | PC | SC | |
| Andalusia | 76 (97.4) | 23 (95.8) | 7.6 (6.6) | 5.9 (7.7) | 78 (100) | 23 (95.8) | 2.1 (0.3)* | 2.0 (0)* | 46 (59.0) | 15 (62.5) | 64 (82.1)* | 8 (33.3) | 1 (1.3)* | 0 (0) |
| Aragon | 22 (88.0) | 9 (100) | 2.4 (3.6)* | 8.7 (11.4) | 24 (96.0) | 9 (100) | 2.7 (0.8) | 2.4 (0.5) | 14 (56.0) | 7 (77.8) | 2 (8.0)* | 4 (44.4) | 1 (4.0) | 0 (0) |
| Asturias | 22 (100) | 4 (80.0) | 7.7 (6.7) | 9.0 (4.1) | 22 (100) | 4 (80.0) | 3.5 (0.7)* | 2.3 (0.5) | 16 (72.7) | 4 (80.0) | 6 (27.3) | 1 (20.0) | 3 (13.6) | 0 (0) |
| Balearics | 17 (100) | 6 (100) | 5.3 (9.1) | 4.0 (5.6) | 17 (100) | 6 (100) | 3.2 (0.9)* | 2.8 (0.7) | 5 (29.4)* | 4 (66.7) | 4 (23.5) | 4 (66.7) | 1 (5.9) | 1 (16.7) |
| Canary Is. | 22 (100) | 10 (90.9) | 11.7 (8.5)* | 8.7 (11.8) | 22 (100) | 11 (100) | 2.7 (0.6) | 2.1 (0.3)* | 14 (63.6) | 8 (72.7) | 13 (59.1)* | 2 (18.2) | 1 (4.5) | 0 (0) |
| Cantabria | 10 (90.9) | 3 (100) | 1.3 (1.5)* | 11.7 (7.6) | 11 (100) | 3 (100) | 2.8 (0.9) | 2.0 | 4 (36.4) | 1 (33.3) | 0 (0)* | 0 (0) | 0 (0) | 0 (0) |
| Castilla-La Mancha | 35 (89.7) | 8 (80.0) | 5.1 (8.5) | 2.8 (4.1) | 38 (97.4) | 10 (100) | 2.3 (0.8)* | 2.3 (0.5) | 17 (43.6)* | 7 (70.0) | 7 (17.9) | 1 (10.0) | 0 (0) | 0 (0) |
| Castilla and León | 43 (87.8) | 7 (87.5) | 7.5 (16.6) | 8.3 (10.2) | 49 (100) | 8 (100) | 2.3 (0.8)* | 2.4 (0.7) | 29 (59.2) | 6 (75.0) | 9 (18.4)* | 2 (25.0) | 5 (10.2) | 1 (12.5) |
| Catalonia | 74 (98.7)* | 42 (100) | 6.1 (10.8) | 6.7 (9.8) | 75 (100) | 42 (100) | 2.8 (0.8) | 2.7 (0.8) | 61 (81.3)* | 35 (83.3) | 7 (9.3)* | 10 (23.8) | 5 (6.7) | 0 (0) |
| Extremadura | 17 (77.3)* | 7 (87.5) | 7.2 (3.6) | 11.3 (5.1) | 16 (72.7)* | 7 (87.5) | 2.5 (0.8) | 2.3 (0.5) | 11 (50.0) | 5 (62.5) | 0 (0)* | 0 (0) | 0 (0) | 0 (0) |
| Galicia | 70 (93.3) | 12 (92.3) | 1.8 (3.8)* | 4.9 (8.4) | 74 (98.7) | 13 (100) | 2.9 (0.8)* | 2.5 (0.8) | 51 (68.0) | 10 (76.9) | 29 (38.7) | 6 (46.2) | 13 (13.3) | 2 (15.4) |
| La Rioja | 6 (100) | 3 (100) | 1.8 (4.0) | 5.0 (4.3) | 6 (100) | 3 (100) | 2.0 (0)* | 2.0 (0)* | 5 (83.3) | 2 (66.7) | 0 (0) | 1 (33.3) | 0 (0) | 0 (0) |
| Madrid | 42 (82.4)* | 17 (100) | 9.6 (19.1) | 9.7 (12.3) | 50 (98.0) | 17 (100) | 2.4 (0.8) | 3.3 (0.8)* | 23 (45.1)* | 7 (41.2)* | 22 (43.1) | 13 (76.5)* | 2 (3.9) | 4 (23.5)* |
| Murcia | 16 (80.0) | 5 (83.3) | 4.4 (5.7) | 7.8 (11.4) | 20 (100) | 6 (100) | 2.1 (0.5)* | 2.7 (1.0) | 12 (60.0) | 3 (50.0) | 0 (0)* | 0 (0) | 0 (0) | 0 (0) |
| Navarra | 16 (100) | 8 (100) | 1.6 (5.0) | 3.5 (4.1) | 16 (100) | 8 (100) | 3.8 (0.5)* | 2.9 (0.8) | 8 (50.0) | 7 (87.5) | 5 (31.2) | 5 (62.5) | 4 (25.0)* | 1 (12.5) |
| Basque Country | 25 (96.2) | 11 (100) | 9.8 (20.8) | 3.7 (6.2) | 26 (100) | 11 (100) | 3.0 (0.9) | 2.8 (1.0) | 21 (80.8)* | 8 (72.7) | 17 (65.4)* | 8 (72.7)* | 11 (42.3)* | 3 (27.3)* |
| Valencia | 44 (86.3) | 16 (100) | 3.1 (6.9) | 3.1 (5.2)* | 45 (88.2)* | 15 (100) | 2.5 (0.8) | 2.6 (0.8) | 34 (66.7) | 13 (81.2) | 6 (11.8)* | 0 (0)* | 2 (3.9) | 0 (0) |
| SPAIN | 557 (92.1) | 191 (95.5) | 5.8 (10.9) | 6.4 (8.7) | 589 (97.4) | 196 (98.0) | 2.6 (0.8) | 2.6 (0.7) | 371 (61.3) | 142 (71.0) | 191 (31.6) | 65 (32.5) | 46 (7.6) | 12 (6.0) |
SABA: short-acting β2 agonists. BDT: bronchodilator test.
Data expressed as mean (standard deviation) or absolute frequencies (%) based on all centers in each healthcare setting within each autonomous community, as applicable.
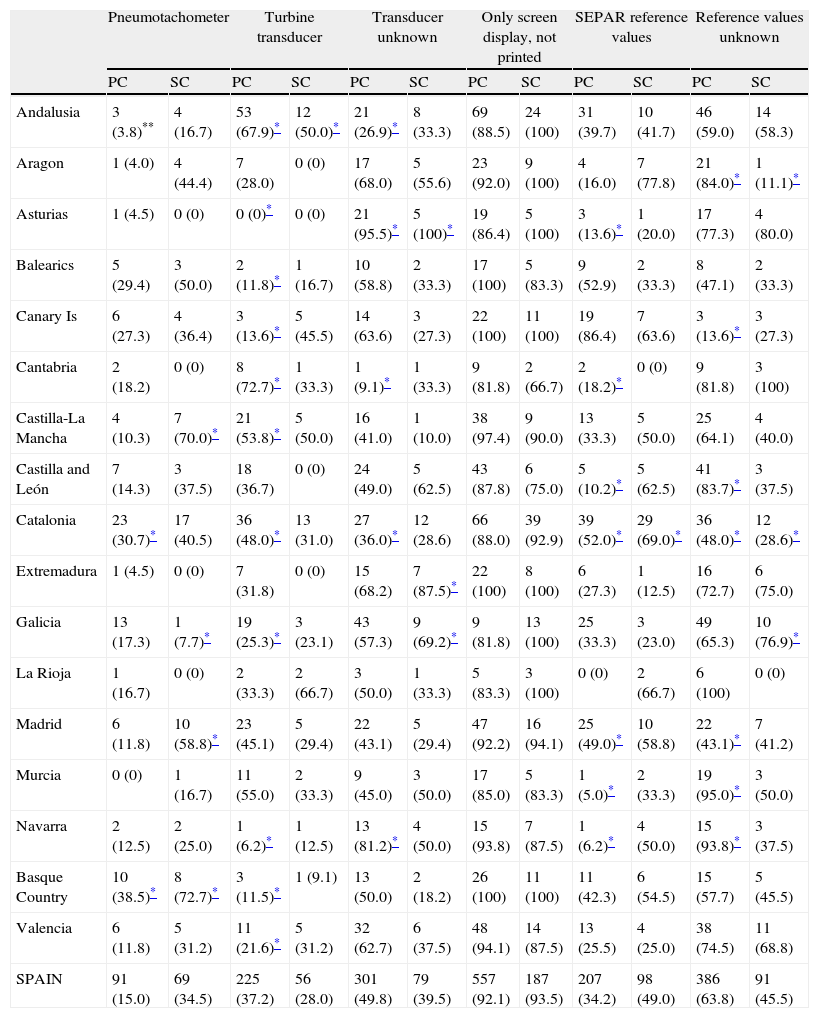
Most technicians surveyed were unaware of the relationship between spirometer type and reference values (Table 6). Most centers stated that spirometer curves were displayed on a screen, but were not printed out.
Type of Spirometer in Centers, According to Healthcare Setting and Autonomous Community.
| Pneumotachometer | Turbine transducer | Transducer unknown | Only screen display, not printed | SEPAR reference values | Reference values unknown | |||||||
| PC | SC | PC | SC | PC | SC | PC | SC | PC | SC | PC | SC | |
| Andalusia | 3 (3.8)** | 4 (16.7) | 53 (67.9)* | 12 (50.0)* | 21 (26.9)* | 8 (33.3) | 69 (88.5) | 24 (100) | 31 (39.7) | 10 (41.7) | 46 (59.0) | 14 (58.3) |
| Aragon | 1 (4.0) | 4 (44.4) | 7 (28.0) | 0 (0) | 17 (68.0) | 5 (55.6) | 23 (92.0) | 9 (100) | 4 (16.0) | 7 (77.8) | 21 (84.0)* | 1 (11.1)* |
| Asturias | 1 (4.5) | 0 (0) | 0 (0)* | 0 (0) | 21 (95.5)* | 5 (100)* | 19 (86.4) | 5 (100) | 3 (13.6)* | 1 (20.0) | 17 (77.3) | 4 (80.0) |
| Balearics | 5 (29.4) | 3 (50.0) | 2 (11.8)* | 1 (16.7) | 10 (58.8) | 2 (33.3) | 17 (100) | 5 (83.3) | 9 (52.9) | 2 (33.3) | 8 (47.1) | 2 (33.3) |
| Canary Is | 6 (27.3) | 4 (36.4) | 3 (13.6)* | 5 (45.5) | 14 (63.6) | 3 (27.3) | 22 (100) | 11 (100) | 19 (86.4) | 7 (63.6) | 3 (13.6)* | 3 (27.3) |
| Cantabria | 2 (18.2) | 0 (0) | 8 (72.7)* | 1 (33.3) | 1 (9.1)* | 1 (33.3) | 9 (81.8) | 2 (66.7) | 2 (18.2)* | 0 (0) | 9 (81.8) | 3 (100) |
| Castilla-La Mancha | 4 (10.3) | 7 (70.0)* | 21 (53.8)* | 5 (50.0) | 16 (41.0) | 1 (10.0) | 38 (97.4) | 9 (90.0) | 13 (33.3) | 5 (50.0) | 25 (64.1) | 4 (40.0) |
| Castilla and León | 7 (14.3) | 3 (37.5) | 18 (36.7) | 0 (0) | 24 (49.0) | 5 (62.5) | 43 (87.8) | 6 (75.0) | 5 (10.2)* | 5 (62.5) | 41 (83.7)* | 3 (37.5) |
| Catalonia | 23 (30.7)* | 17 (40.5) | 36 (48.0)* | 13 (31.0) | 27 (36.0)* | 12 (28.6) | 66 (88.0) | 39 (92.9) | 39 (52.0)* | 29 (69.0)* | 36 (48.0)* | 12 (28.6)* |
| Extremadura | 1 (4.5) | 0 (0) | 7 (31.8) | 0 (0) | 15 (68.2) | 7 (87.5)* | 22 (100) | 8 (100) | 6 (27.3) | 1 (12.5) | 16 (72.7) | 6 (75.0) |
| Galicia | 13 (17.3) | 1 (7.7)* | 19 (25.3)* | 3 (23.1) | 43 (57.3) | 9 (69.2)* | 9 (81.8) | 13 (100) | 25 (33.3) | 3 (23.0) | 49 (65.3) | 10 (76.9)* |
| La Rioja | 1 (16.7) | 0 (0) | 2 (33.3) | 2 (66.7) | 3 (50.0) | 1 (33.3) | 5 (83.3) | 3 (100) | 0 (0) | 2 (66.7) | 6 (100) | 0 (0) |
| Madrid | 6 (11.8) | 10 (58.8)* | 23 (45.1) | 5 (29.4) | 22 (43.1) | 5 (29.4) | 47 (92.2) | 16 (94.1) | 25 (49.0)* | 10 (58.8) | 22 (43.1)* | 7 (41.2) |
| Murcia | 0 (0) | 1 (16.7) | 11 (55.0) | 2 (33.3) | 9 (45.0) | 3 (50.0) | 17 (85.0) | 5 (83.3) | 1 (5.0)* | 2 (33.3) | 19 (95.0)* | 3 (50.0) |
| Navarra | 2 (12.5) | 2 (25.0) | 1 (6.2)* | 1 (12.5) | 13 (81.2)* | 4 (50.0) | 15 (93.8) | 7 (87.5) | 1 (6.2)* | 4 (50.0) | 15 (93.8)* | 3 (37.5) |
| Basque Country | 10 (38.5)* | 8 (72.7)* | 3 (11.5)* | 1 (9.1) | 13 (50.0) | 2 (18.2) | 26 (100) | 11 (100) | 11 (42.3) | 6 (54.5) | 15 (57.7) | 5 (45.5) |
| Valencia | 6 (11.8) | 5 (31.2) | 11 (21.6)* | 5 (31.2) | 32 (62.7) | 6 (37.5) | 48 (94.1) | 14 (87.5) | 13 (25.5) | 4 (25.0) | 38 (74.5) | 11 (68.8) |
| SPAIN | 91 (15.0) | 69 (34.5) | 225 (37.2) | 56 (28.0) | 301 (49.8) | 79 (39.5) | 557 (92.1) | 187 (93.5) | 207 (34.2) | 98 (49.0) | 386 (63.8) | 91 (45.5) |
Data expressed in absolute values (%) based on all centers in each healthcare setting within each autonomous community.
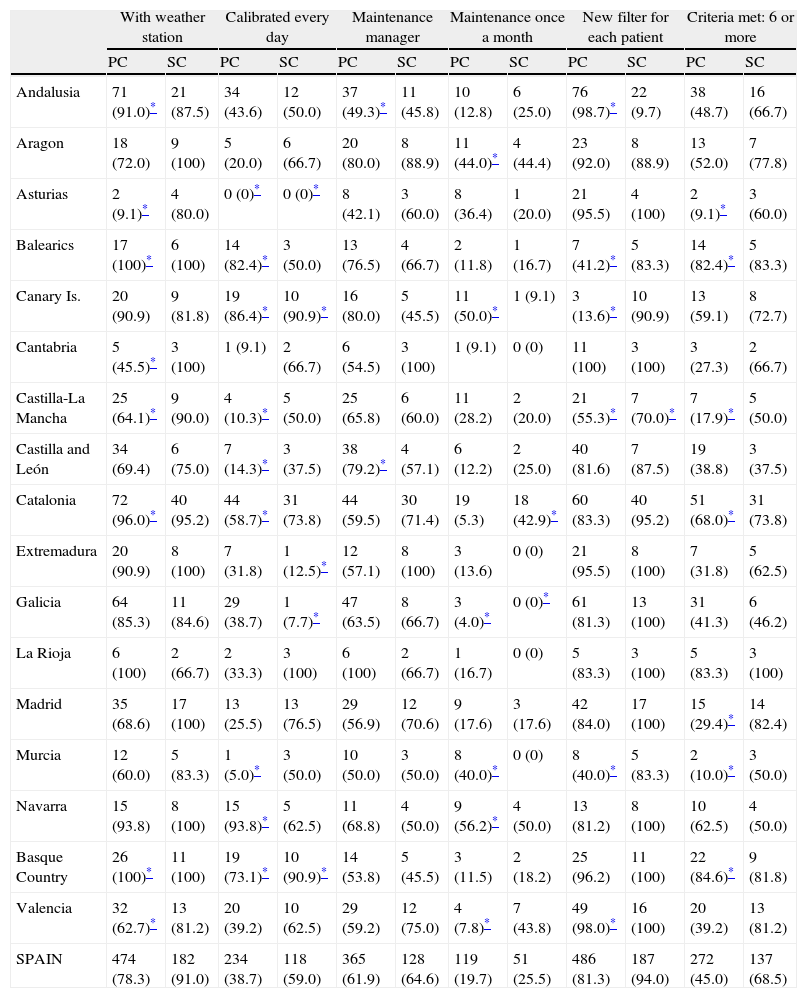
Finally, information on spirometer maintenance is summarized in Table 7. Not all centers calibrated the equipment daily. When asked the reason for not doing so, the most common answers were lack of a calibration syringe, the spirometer did not require calibration, or lack of a weather station. The level of compliance with the 8 spirometry quality criteria was very variable, and is shown in Table 7 and Fig. 1.
Spirometer Maintenance in Centers and Baseline Spirometry Quality Criteria, According to Care Setting and Autonomous Community.
| With weather station | Calibrated every day | Maintenance manager | Maintenance once a month | New filter for each patient | Criteria met: 6 or more | |||||||
| PC | SC | PC | SC | PC | SC | PC | SC | PC | SC | PC | SC | |
| Andalusia | 71 (91.0)* | 21 (87.5) | 34 (43.6) | 12 (50.0) | 37 (49.3)* | 11 (45.8) | 10 (12.8) | 6 (25.0) | 76 (98.7)* | 22 (9.7) | 38 (48.7) | 16 (66.7) |
| Aragon | 18 (72.0) | 9 (100) | 5 (20.0) | 6 (66.7) | 20 (80.0) | 8 (88.9) | 11 (44.0)* | 4 (44.4) | 23 (92.0) | 8 (88.9) | 13 (52.0) | 7 (77.8) |
| Asturias | 2 (9.1)* | 4 (80.0) | 0 (0)* | 0 (0)* | 8 (42.1) | 3 (60.0) | 8 (36.4) | 1 (20.0) | 21 (95.5) | 4 (100) | 2 (9.1)* | 3 (60.0) |
| Balearics | 17 (100)* | 6 (100) | 14 (82.4)* | 3 (50.0) | 13 (76.5) | 4 (66.7) | 2 (11.8) | 1 (16.7) | 7 (41.2)* | 5 (83.3) | 14 (82.4)* | 5 (83.3) |
| Canary Is. | 20 (90.9) | 9 (81.8) | 19 (86.4)* | 10 (90.9)* | 16 (80.0) | 5 (45.5) | 11 (50.0)* | 1 (9.1) | 3 (13.6)* | 10 (90.9) | 13 (59.1) | 8 (72.7) |
| Cantabria | 5 (45.5)* | 3 (100) | 1 (9.1) | 2 (66.7) | 6 (54.5) | 3 (100) | 1 (9.1) | 0 (0) | 11 (100) | 3 (100) | 3 (27.3) | 2 (66.7) |
| Castilla-La Mancha | 25 (64.1)* | 9 (90.0) | 4 (10.3)* | 5 (50.0) | 25 (65.8) | 6 (60.0) | 11 (28.2) | 2 (20.0) | 21 (55.3)* | 7 (70.0)* | 7 (17.9)* | 5 (50.0) |
| Castilla and León | 34 (69.4) | 6 (75.0) | 7 (14.3)* | 3 (37.5) | 38 (79.2)* | 4 (57.1) | 6 (12.2) | 2 (25.0) | 40 (81.6) | 7 (87.5) | 19 (38.8) | 3 (37.5) |
| Catalonia | 72 (96.0)* | 40 (95.2) | 44 (58.7)* | 31 (73.8) | 44 (59.5) | 30 (71.4) | 19 (5.3) | 18 (42.9)* | 60 (83.3) | 40 (95.2) | 51 (68.0)* | 31 (73.8) |
| Extremadura | 20 (90.9) | 8 (100) | 7 (31.8) | 1 (12.5)* | 12 (57.1) | 8 (100) | 3 (13.6) | 0 (0) | 21 (95.5) | 8 (100) | 7 (31.8) | 5 (62.5) |
| Galicia | 64 (85.3) | 11 (84.6) | 29 (38.7) | 1 (7.7)* | 47 (63.5) | 8 (66.7) | 3 (4.0)* | 0 (0)* | 61 (81.3) | 13 (100) | 31 (41.3) | 6 (46.2) |
| La Rioja | 6 (100) | 2 (66.7) | 2 (33.3) | 3 (100) | 6 (100) | 2 (66.7) | 1 (16.7) | 0 (0) | 5 (83.3) | 3 (100) | 5 (83.3) | 3 (100) |
| Madrid | 35 (68.6) | 17 (100) | 13 (25.5) | 13 (76.5) | 29 (56.9) | 12 (70.6) | 9 (17.6) | 3 (17.6) | 42 (84.0) | 17 (100) | 15 (29.4)* | 14 (82.4) |
| Murcia | 12 (60.0) | 5 (83.3) | 1 (5.0)* | 3 (50.0) | 10 (50.0) | 3 (50.0) | 8 (40.0)* | 0 (0) | 8 (40.0)* | 5 (83.3) | 2 (10.0)* | 3 (50.0) |
| Navarra | 15 (93.8) | 8 (100) | 15 (93.8)* | 5 (62.5) | 11 (68.8) | 4 (50.0) | 9 (56.2)* | 4 (50.0) | 13 (81.2) | 8 (100) | 10 (62.5) | 4 (50.0) |
| Basque Country | 26 (100)* | 11 (100) | 19 (73.1)* | 10 (90.9)* | 14 (53.8) | 5 (45.5) | 3 (11.5) | 2 (18.2) | 25 (96.2) | 11 (100) | 22 (84.6)* | 9 (81.8) |
| Valencia | 32 (62.7)* | 13 (81.2) | 20 (39.2) | 10 (62.5) | 29 (59.2) | 12 (75.0) | 4 (7.8)* | 7 (43.8) | 49 (98.0)* | 16 (100) | 20 (39.2) | 13 (81.2) |
| SPAIN | 474 (78.3) | 182 (91.0) | 234 (38.7) | 118 (59.0) | 365 (61.9) | 128 (64.6) | 119 (19.7) | 51 (25.5) | 486 (81.3) | 187 (94.0) | 272 (45.0) | 137 (68.5) |
Data expressed in absolute values (%) based on all centers in each healthcare setting within each autonomous community.
This study describes the current situation of spirometry in Spain by AC, based on the answers given by the technicians who perform this test in PC and SC centers that treat adult respiratory patients. The main findings of the survey were considerable variability between ACs, and poor compliance with quality criteria established by national and international spirometry guidelines.9
This is the first national survey of its kind carried out in Spain, and the overall results, with more detailed information at AC level, have recently been published.7 Although Spain has a National Health System, responsibility for healthcare has been transferred to each AC. For this reason, within the framework of the General Healthcare Act, each AC has the ability to regulate healthcare services based on local needs.10 Consequently, the more regionally specific results of this survey may be very valuable for AC healthcare managers.
Some methodological considerations must be taken into account. Firstly, the validity of the survey stems from the fact that the questions, being related to day-to-day spirometer management, were answered directly by the technician in charge of performing spirometry. Some, however, such as criteria for positive BDT test results or theoretical values used, were related more to the interpretation of results than performance of the test, and the answers should be viewed with caution. For example, a Spanish study reported that spirometry FEV1 reproducibility criteria were not met in 76% of cases, and that the same was true of vital capacity in 39.7% of cases.11 In our study, however, perceived quality rates differ considerably (Table 4). Telephone surveys, meanwhile, such as those used in this project, enable researchers to survey a large number of centers, although some will decline, and the results depend on the veracity of the respondent's answers. Nevertheless, it is important to note that telephone or telemonitoring strategies applied to quality of life questionnaires have been shown to be useful.12–14 In our study, non-response was 14.6% (PC) and 24.9% (SC), which can be considered acceptable, although rates in some ACs differed considerably. Although no similar spirometry evaluation studies have been conducted, we believe that the sample used is representative of countrywide testing.
From the point of view of resources, the most significant finding is probably the low number of spirometries performed weekly in PC. It is notable that, although most centers have a spirometer as well as a specific room and timetable for performing the tests, the number of spirometries performed in PC is extremely low. Considering the high prevalence of COPD and asthma (the 2 main respiratory diseases for which spirometry is requested) in Spain,15,16 the number of under-diagnosed cases, and the fact that functional evaluation is essential to determine comorbidity,17 5.6 spirometries per week in PC (range 2.0–8.9) is inadequate. This finding is consistent with that of previous studies in Spain.11,18 Although an analysis of the reasons why spirometry is so significantly underused in PCs throughout Spain is beyond the scope of this study, we would suggest 2 possible explanations: first, due to patient referral patterns between PC and SC centers, tests are performed preferably at a single care level; second, the number of human resources available. Whatever the reason, healthcare managers should heed the warning signs and consider spirometry a priority area for improvement in their respective healthcare areas.
Spirometry training is another aspect that must be improved in Spain. While it is a non-invasive and relatively simple diagnostic technique, sufficient training is required in order to perform and subsequently interpret a spirometry test correctly (Table 3). In this respect, our data show centers in which most staff have received some training at some time, but not usually on a regular basis. Regular training is important for maintaining good spirometry test skills, especially in PC, where the low number of tests may undermine the technicians’ proficiency. Furthermore, periodic training ensures that new technicians joining the staff will receive training that would otherwise not be available. Such a training is feasible, and skills can be maintained over time. A recent study conducted in Galicia in the northwest of Spain evaluating a theory+practice training program with supervised follow-up showed that this approach significantly improved the quality of PC spirometry testing.19 Similarly, another Spanish study in the Basque Country described the efficacy of a telemedicine spirometry training program, with significant results.14 At present, the European Respiratory Society has implemented a spirometry “driving license”, an initiative aimed at promoting and standardizing spirometry training across Europe.20
BDTs varied considerably between ACs (Table 5). For example, most centers used various short-acting bronchodilators for BDTs, but with an insufficient number of puffs (2.0 in La Rioja and 3.8 in Navarra for PC; 2.0 in Andalusia, Cantabria and La Rioja, and 3.3 in Madrid for SC), often with an incorrect wait time (between 29.4% [Balearics] and 83.3% [La Rioja] in PC and between 33.3% [Cantabria] and 87.5% [Navarra] in SC). The usefulness of BDT in the diagnosis and treatment of asthma and COPD has been, and continues to be, controversial. Despite its simplicity, results are still difficult to interpret and translate into specific therapeutic strategies, especially in COPD.21 In this regard, it is important to remember that studies on the impact of BDT in patients with chronic bronchial diseases involve the administration of 1 or several bronchodilators at the correct dosage and wait time for each drug used.8 Furthermore, adherence to international BDT guidelines varies greatly in Spain. In the Basque Country, compliance with the 5 BDT diagnostic criteria ranged from 0% to 42.3% for PC and 0% to 27.3% for SC. This lack of adherence to recommendations is another area for improvement in Spanish centers that perform spirometry. In this respect, it is important to take into account that in this study technicians were asked about the reversibility of FEV1; however, reversibility of forced vital capacity can also indicate a positive result.8
Finally, maintenance and calibration are other critical points in spirometry testing in Spain. As shown in our results (Table 7), the device is not always adequately maintained or calibrated daily, and weather stations are not always available. Nevertheless, spirometers must be correctly calibrated and maintained if study results are to be considered clinically relevant.
Spain is currently undergoing a demographic transformation, and population stabilization is associated with a relative increase in the number of women and elderly individuals. In this setting, monitoring trends in chronic diseases must be a priority, particularly those linked to aging and smoking, such as COPD, in which not only underdiagnosis but also lack of awareness is widespread.22 Therefore, the rational use of measurement tools such as spirometry, key for identifying these populations, must be a priority, and corrective measures and procedures for maximizing good practices must be introduced. Although some ACs meet more criteria than others, this heterogeneity also varies from one AC to another, and each AC is strong in some aspects while being weaker in others. In this respect, this study is intended to help healthcare managers analyze the differences observed in some ACs, and to evaluate how they have overcome the limitations found in order to apply this to the rest of the country.
In summary, this project presents a picture of the current state of spirometry in the PC and SC setting in Spain, by AC, showing notable regional differences. The conclusions of the 3E study reflect the tremendous variability of results between ACs and highlights several areas for improvement, including the small number of spirometries performed weekly in PC, and insufficient regular education and training at both levels, shortcomings in BDT performance, and problems in the calibration and maintenance of spirometers. This study is only the first step. An in-person spirometry audit should be conducted in Spain to define the strengths and weaknesses of the test in clinical practice, and the resulting information could be taken into consideration by healthcare officials and managers in each AC for the purpose of bringing in changes that can correct these deficiencies in the future, and thus achieve nationwide quality spirometry.
FundingThis study was funded by Novartis España.
Conflict of InterestThe authors declare that they have no conflict of interests.
The authors would like to thank Amber Marketing Research & Consulting for their excellent field work.
AIRE: Borja García Cosío, Isabel Mir.
ASTURPAR: Cristina Martínez González.
NEUMOCAN: Ana Velázquez.
NEUMOMADRID: José Miguel Rodríguez González-Moro.
NEUMOSUR: Aurelio Arnedillo.
SADAR: Luis Borderias Clau.
SEAR: Juan Antonio Riesco Miranda.
SEPAR: Juan Ruiz Manzano (Chairperson), German Peces Barba.
SOCALPAR: José Luis Viejo Bañuelos.
SOCAMPAR: Encarnación López Gabaldón (chairperson).
SOCAP: Eduard Monsó Molas (Presidente).
SOGAPAR: Marina Blanco Aparicio.
SOMUPAR: Juan Luis de la Torre Álvaro (Chairperson).
SVNEUMO: María Cruz González Villaescusa.
SVNPR: Juan Bautista Galdiz.
Please cite this article as: López-Campos JL, Soriano JB, Calle M, en representación del Proyecto 3E. Cambios interregionales en la realización e interpretación de las espirometrías en España: estudio 3E. Arch Bronconeumol. 2014;50:475–483.
3E Project. Steering Committee: Myriam Street, Joan B. Soriano, José Luis López-Campos. Members of Task 3E Project are listed in Annex 1.


www.publicationethics.org.


Archivos de Bronconeumología follows the Recommendations for the Conduct, Reporting, Editing and Publication of Scholarly Work in Medical Journals