


To determine the impact of implementing clinical practice guidelines (CPGs) in the treatment of community-acquired pneumonia (CAP) in the emergency department (ED) by analyzing case management decisions (admission or discharge, appropriateness and timeliness of antibiotic therapy, complementary tests) and the consequent results (clinical stabilization time, length of hospital stay, re-admission to ED and mortality).
MethodsA prospective, observational, descriptive, comparative study carried out from 1st January 2008 to 1st August 2009 in two phases: before and after the implementation of the “Management of CAP in ED” SEMES-SEPAR (Spanish Society of Emergency Medicine – Spanish Society of Pneumology and Thoracic Surgery) clinical practice guidelines from 2008. Two hundred adult patients treated in the ED with a diagnosis of CAP were included in the study, both in the pre-intervention and post-intervention groups.
ResultsThe application of the guidelines increased the administration of early and appropriate antibiotic therapy (P<.001) and shortened both the total antibiotic therapy (P<.001) and the intravenous antibiotic therapy (P=.042) times. Time to clinical stabilization (P=.027), length of hospital stay (1.14 days, P=.01), intra-hospital mortality (P=.004) and total 30-day mortality (P=.044) were all reduced. Assessment with the Pneumonia Severity Index (PSI) and biomarkers aided in appropriate decision-making concerning admission/discharge (P<.001).
ConclusionsThe implementation of the SEMES-SEPAR 2008 guidelines, along with the use of PSI and biomarkers, significantly improved the entire treatment process of CAP. This benefitted both patients and the system by reducing mortality and improving the results of other patient management factors.
Determinar el impacto de la implementación de una guía de práctica clínica (GPC) en el proceso asistencial de la neumonía adquirida en la comunidad (NAC) en un servicio de urgencias (SU), analizando los indicadores de manejo (decisión de alta o ingreso, adecuación y precocidad de la antibioterapia, solicitud de estudios complementarios) y de resultados (tiempo de estabilización clínica, tiempo de estancia hospitalaria, reconsultas en el SU y mortalidad).
MétodosEstudio prospectivo, observacional, descriptivo y comparativo realizado desde el 1 enero de 2008 al 1 agosto de 2009 en 2fases, antes y después de la implantación de la GPC «Manejo de la NAC en los SU» SEMES-SEPAR 2008. Se incluyó a 200pacientes adultos atendidos en el SU con el diagnóstico de NAC tanto en el grupo preintervención como en el postintervención.
ResultadosEl uso de la GPC consiguió aumentar la administración precoz adecuada del antibiótico (p<0,001) y disminuir el tiempo de tratamiento antibiótico total (p<0,001) e intravenoso (p=0,042), así como reducir el tiempo hasta la estabilización clínica (p=0,027), la estancia hospitalaria (1,14 días, p=0,01) y la mortalidad intrahospitalaria (p=0,004) y global a los 30días (p=0,044). El uso del Pneumonia Severity Index (PSI) y los biomarcadores ayudaron a mejorar la adecuación de la decisión: alta o ingreso (p<0,001).
ConclusionesLa implementación de la GPC SEMES-SEPAR 2008 con el uso del PSI y los biomarcadores mejoró de forma significativa todo el proceso asistencial de la NAC, siendo beneficiosa para los enfermos y para el sistema al lograr disminuir la mortalidad y el resto de indicadores de resultados y de manejo.
Community-acquired pneumonia (CAP) is the leading cause of death due to infectious disease in the West (from 10% to 14%, depending on age and associated risk factors) and produces a large proportion of the cases of sepsis (S), severe sepsis (SS) and septic shock (SSh) seen in Emergency Departments (EDs).1 In Spain, it occurs at a rate of about 2–5 cases/1000 inhabitants/year and can rise to 15–35 cases/1000 inhabitants/year at times of viral epidemics, in the over-65s and in patients with chronic disease or toxic habits.2 The diagnostic and therapeutic approach and management of CAP patients are known to vary widely between different centers and between clinicians in a single center.3–5 This is one of the reasons that explain the very different admission rates, ranging from 22% to 61% depending on the center, different specialists and the time of year. The request for complementary tests, choice of antimicrobials, intensity of the care offered and use of resources vary greatly between centers, and are often determined by the characteristics, resources, location and experience of the physicians working in the EDs.6 However, this variability means that the prognosis and disease course of patients with CAP are also different.7 It is estimated that 75% of patients with CAP are seen in EDs, revealing the importance of the role of the emergency physician (EP) in the initial management and, consequently, the subsequent progress, morbidity and mortality of the disease.1,2,6 Determining the need for admission of the CAP patient (when), the appropriate location (where) and the care required by the patient (how) are the most important decisions that the EP must take, and will impact on the patient's prognosis (morbidity and mortality), requests for laboratory tests and microbiology studies, choice of the initial antimicrobial regimen, intensity of the clinical observation and use of socio-sanitary resources.8 All these affect the final cost, which increases 8 to 25-fold if the patient is admitted compared to being treated at home.9 Along with the decision regarding where the patient should be treated, early administration of the appropriate antimicrobial regimen and the necessary hemodynamic and respiratory support are the factors that most closely determine the progress and mortality of patients with CAP.10 For this reason, many authors in recent years have been calling for a “CAP/Pneumonia Code Zero” protocol or clinical practice guideline (CPG),10 such as those available for acute coronary syndrome or stroke,11 which would allow the immediate prioritization and treatment by objectives of the CAP patient in the ED, particularly those with SS or SSh, which in turn could lead to a reduction in clinical variability and mortality.10,12 Many studies have shown the usefulness and efficacy of CPG in CAP,13–16 although most were carried out by pneumology specialists and only analyzed hospitalized patients. Recently, however, others have been published which include discharged patients who represent 35%–50% of the CAP patients seen in the ED.17,18 Although the efficacy and efficiency of CPGs is recognized, clinicians generally adhere poorly to these guidelines and up to 35%–65% admit to not using them at all.4,19,20
The implementation of a CPG for EDs which has been agreed upon with other specialists and is adapted to the center is probably the best tool for reducing clinical variability and improving case management.15–18 In our hospital, during 2008, clinical variability was wide and adherence to the reference CPG was very poor (less than 40%).21 That same year, the document “Management of CAP in the ED”1,22 was published by TIR-SEPAR (Tuberculosis and Respiratory Infections Area of the Spanish Society of Pneumology and Thoracic Surgery) and INFURG-SEMES (Infections in Emergency Study Group of the Spanish Society of Emergency Medicine) to serve as an instrument for reducing clinical variability and improving the overall management of CAP in EDs.1 The aim of our study was to determine the impact of implementing the SEMES-SEPAR 2008 CPG in our ED on the care of CAP, comparing management indicators (discharge or admission, appropriateness and timeliness of antibiotic therapy, complementary tests) and the results (length of hospital stay, clinical stabilization time, re-admission to ED and mortality) before and after implementation of this CPG.
Patients and MethodsStudy SiteThe study was conducted in the Complejo Hospitalario de Toledo. This is a tertiary level 800-bed hospital belonging to SESCAM (Castilla La Mancha Health Service) with a referral area of 435 000 inhabitants. The ED has an internal medicine area attended by a staff EP and resident physicians from various medical specialties. During 2008 and 2009, an average of 416 and 430 emergencies/day, respectively, were evaluated and the incidence of CAP in patients ≥18 years of age was 0.92% and 0.98% of the patients seen in the ED (3.21 and 3.56 cases/1000 inhabitants/year, respectively). Patients with CAP may be discharged from the ED (including those who remain under observation for up to 24h) or admitted to the intensive care unit (ICU) or to the SSU (short stay unit) of the pneumology, internal medicine or geriatric wards or, to a lesser extent (<3%) may be admitted to other departments with their own 24-h duty specialists (nephrology and hematology). The EP takes the decision regarding admission and the department to which the patient is initially admitted, except in the case of the ICU, where the duty intensive medicine specialist is consulted.
Study DesignThis was an observational, single-blind study with prospective follow-up of patients in two phases: before and after intervention consisting of implementation of the “Management of CAP in EDs” (SEMES-SEPAR 2008) CPG1,22 along with training sessions for all EPs and residents of the center on the CPG, as described below.
Study Periods and Study PopulationTwo independent collaborators unknown to the rest of the EPs throughout the study evaluated the initial eligibility of the subjects who attended the ED between 1 January 2008 and 1 August 2009, until 200 patients were consecutively included in the pre-intervention phase (1 January 2008–30 September 2008) and another 200 in the post-intervention phase (4 October 2008–1 August 2009). To be included, patients had to meet the following criteria: adult patients (≥18 years of age), diagnosed with CAP in the ED by the treating physicians. Immunosuppressed patients (human immunodeficiency virus infection, solid organ transplant, splenectomy, more than 30 days treatment with 10mg or more prednisone per day or equivalent, or treatment with other immunosuppressive drugs) and patients hospitalized during the previous 14 days were excluded. The two collaborators were also responsible for making an evaluation (blinded for the rest of the EPs) of the definitive eligibility, and patients were withdrawn if the final diagnosis of CAP was not maintained by the treating physician after 30 days [codes 481, 482, 483, 485, 486 and 507 of the International Classification of Diseases, Ninth Revision, Clinical Modification (ICD-9-CM)], if they had a final diagnosis of tuberculosis or a diagnosis of viral etiology, influenza, mycosis or lung abscess (ICD-9-MC codes 480, 487, 484 and 513). Patients diagnosed with a second episode of CAP during the study period were also excluded. The study met the ethical requirements of our hospital and was approved by the Clinical Research Ethics Committee of the site. All patients were followed up via the computerized medical records of the ED, hospital and primary care center.
Study Intervention. Implementation and Evaluation of Adherence to the Clinical Practice GuidelinesBetween 1 and 3 October 2008, both the full text and a brochure of the “Management of CAP in EDs” (SEMES-SEPAR 2008) CPG1,22 were distributed to all the EPs and resident physicians of the center, training sessions were given, and the physicians were asked to systematically apply the recommendations from then on. The two independent collaborators unknown to the other EPs were responsible for applying the patient evaluation criteria. To evaluate and analyze the actions of the EPs, “appropriate management” was defined as each case in which the measures and treatments applied by the physicians coincided with the SEMES-SEPAR 20081,22 recommendations, and “inappropriate management” was when they did not. This evaluation was carried out independently for the request for complementary tests in the ED (clinical laboratory, microbiology and biomarkers), the evaluation of prognosis and decision regarding the destination of the patient according to the Pneumonia Severity Index (PSI) and choice and administration of treatment in the ED. When there was discrepancy between the two evaluators, the case was excluded. CAP was defined by the presence of acute symptoms consistent with CAP (cough, dyspnea, fever, pleuritic chest pain, altered level of consciousness, etc.) and radiological findings (presence of new pulmonary infiltrates on X-ray). It was defined as severe and requiring evaluation by the ICU specialist when patients met one major or three minor criteria of the American Thoracic Society-Infectious Diseases Society of America (ATS/IDSA 2007).6
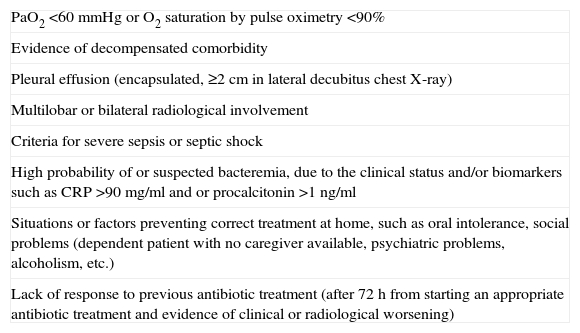
The PSI was used to evaluate the severity and prognosis of patients with CAP and the decision regarding admission, according to the risk categories created by the original authors,23 but with the inclusion of some additional criteria (also explained and communicated in the training sessions), in accordance with the 2008 SEMES and SEPAR recommendations. Accordingly, patients in PSI risk categories IV–V and those in risk categories I–III presenting one or more of the additional risk factors or criteria listed in Table 1 had to be hospitalized.
Additional Criteria and Risk Factors Determining Patient Admission.
| PaO2 <60mmHg or O2 saturation by pulse oximetry <90% |
| Evidence of decompensated comorbidity |
| Pleural effusion (encapsulated, ≥2cm in lateral decubitus chest X-ray) |
| Multilobar or bilateral radiological involvement |
| Criteria for severe sepsis or septic shock |
| High probability of or suspected bacteremia, due to the clinical status and/or biomarkers such as CRP >90mg/ml and or procalcitonin >1ng/ml |
| Situations or factors preventing correct treatment at home, such as oral intolerance, social problems (dependent patient with no caregiver available, psychiatric problems, alcoholism, etc.) |
| Lack of response to previous antibiotic treatment (after 72h from starting an appropriate antibiotic treatment and evidence of clinical or radiological worsening) |
The patients were divided into two groups: pre-intervention (preG) and post-intervention (postG). All sociodemographic, clinical, exploratory, clinical laboratory and radiological variables included in the PSI,23 the ATS/IDSA ICU admission criteria (2007)6 and the 2001 International Sepsis Definitions Conference24 criteria for the definition of S, SS and SSh were collected. The PSI value and grade, and the Charlson index,25 both original and weighted for age and presence of S, SS, SSh and severe CAP, were evaluated. In addition to these variables, the following were determined: prior antimicrobial treatment (during the 72h prior to consultation in the ED), the profile of the treating EP (resident, ED staff, another specialist), presence of diabetes or chronic obstructive pulmonary disease (COPD), number of comorbidities (including those recorded for the PSI, plus diabetes and COPD), request for laboratory tests as indicated by the CPG (including, per protocol, complete blood count, coagulation, biochemistry and blood gases), request for appropriate microbiological studies according to the CPG (blood cultures, antigens in urine, sputum culture), pulse oximetry (O2 saturation), C-reactive protein (CRP) and procalcitonin (PCT) requests and values, administration and timeliness of starting antibiotics (within the first 4h), appropriate choice of antibiotic regimen and dosing, change in antibiotic regimen in hospitalized patients within the first 48h or in patients treated at home within 72h after discharge, overall and intravenous treatment duration and side effects and complications. Finally, outcome variables included re-admission to the ED and hospital re-admission within 30 days, times to clinical stabilization and lengths of hospital stays, microbiological diagnosis, initial destination of patient (discharge, observation, short stay unit, ward, ICU or death in ED) and its appropriateness, re-evaluation of discharged patients after 24–72h, confirmation of clinical and radiological resolution after 3–6 weeks and mortality in patients who were discharged, admitted to the ward and to the ICU, and overall 30-day mortality.
Sample SizeIt was calculated that with 200 patients per study phase, a precision of not less than ±10% would be obtained in the 95% confidence estimate for the percentage difference between both phases. Moreover, the statistical power of a 5% two-tailed comparison of the proportions would be at least 80%, in the case of population differences from 14%. With this sample size, the probability that the 95% confidence interval of the mean difference between the periods would not include the zero value would be equal to or greater than 0.8 for a Cohen effect size of at least 0.2.
Statistical AnalysisMeans and standard deviations (SD), ranges, medians and percentages were used as appropriate for describing the demographic, clinical, progress and treatment characteristics of the patients in both phases. In addition, for the estimation of population values, the 95% confidence interval (95% CI) limits were calculated for means and percentages. Comparison of percentages between study phases (pre and post-CPG implementation) was carried out using the Chi-squared test or Fisher's exact test, as appropriate. Comparison of scale and ordinal variables was performed using the Student's t-test and the Mann–Whitney U test, as applicable. Furthermore, in order to control for any confounding bias as far as possible, an unconditional logistic regression model was applied, using in-hospital mortality and 30-day mortality as dependent variables, and as independent variables, the study phase (pre and post-CPG implementation) and the clinical, demographic and treatment characteristics which could influence mortality and be distributed heterogeneously between the phases; in this way, the adjusted odds ratio (OR) of the association between mortality and phase and their 95% CIs were calculated. Similarly to control for confounding factors, a multiple linear regression model was used to investigate whether the possible association between treatment duration and group was maintained after controlling for the patient's destination (discharge, observation, short-stay unit, ward or ICU). Finally, the cumulative proportion of patients who remained hospitalized throughout the period was calculated using the Kaplan–Meier method and compared between phases using the log rank test; this analysis was repeated, stratifying for group according to PSI and destination of the patient. The same procedure was used to analyze time to clinical stabilization. The statistical analysis was carried out using SPSS 11 software for Windows, and significance was considered as a P-value <.05; all comparisons were two-tailed.
ResultsTwo hundred (200) patients were finally included, both in the pre-intervention (preG) and post-intervention group (postG), after 52 and 37 patients were excluded respectively, as the diagnosis of CAP was not confirmed during follow-up according to the specified codes. Similarly, five and three patients, respectively, were not included due to discrepancies between the collaborators in evaluating the actions undertaken in the ED.
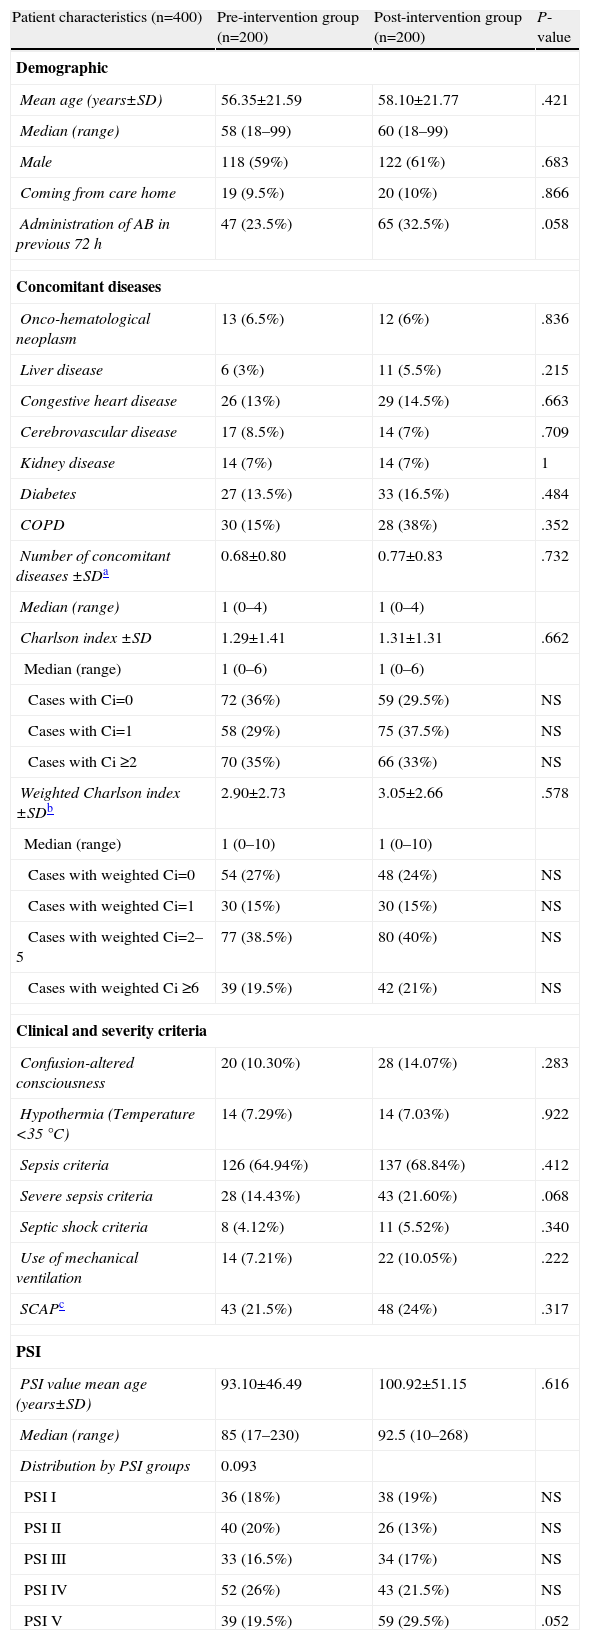
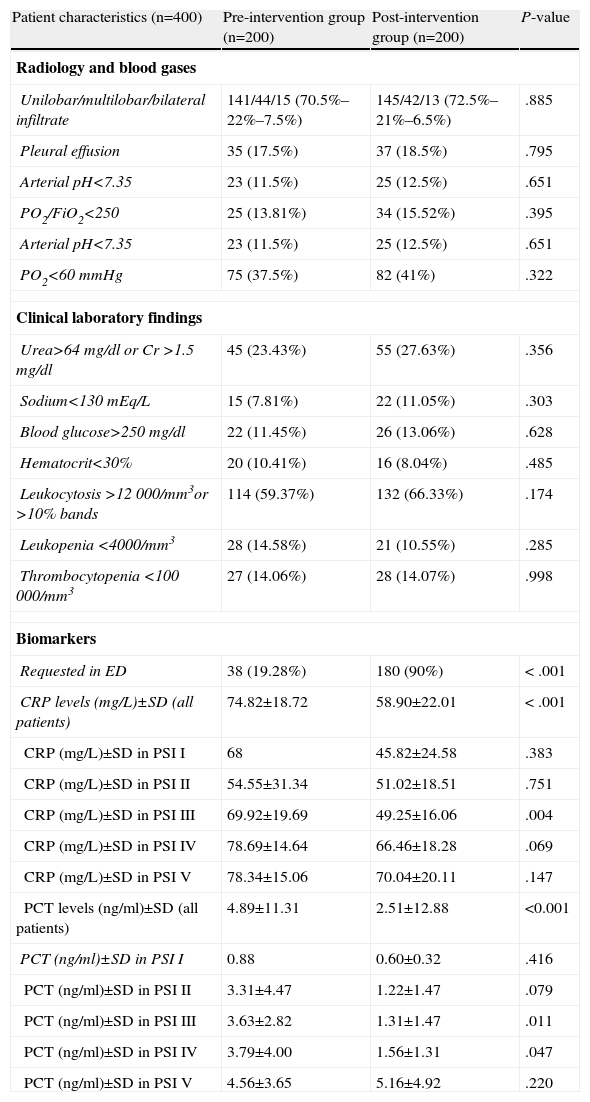
Group ComparabilityThe sociodemographic, clinical and severity characteristics, comorbidities (and original and weighted Charlson index) and the distribution of the patients according to the PSI classification of all study patients are presented in Table 2. Differences between groups did not reach the nominal level of significance for any of the variables, and moreover, their magnitudes did not seem to be relevant, except in the case of use of antibiotics within the previous 72h and the criteria for severe sepsis, which were 9% and 7.2% more common, respectively, in the postG group. There were no significant or important differences between the preG and the postG in radiological findings (incidence of multilobar or bilateral CAP and pleural effusion), or in the clinical laboratory or blood gas parameters (Table 3). Although there were significant differences in obtaining the final microbiological diagnosis (12% vs 40.5%, P<.001), the distribution of the pathogens identified (Fig. 1) was proportional and no significant differences were shown (P=.22).
Sociodemographic and Clinical Characteristics of Patients Treated for CAP in the ED.
| Patient characteristics (n=400) | Pre-intervention group (n=200) | Post-intervention group (n=200) | P-value |
| Demographic | |||
| Mean age (years±SD) | 56.35±21.59 | 58.10±21.77 | .421 |
| Median (range) | 58 (18–99) | 60 (18–99) | |
| Male | 118 (59%) | 122 (61%) | .683 |
| Coming from care home | 19 (9.5%) | 20 (10%) | .866 |
| Administration of AB in previous 72h | 47 (23.5%) | 65 (32.5%) | .058 |
| Concomitant diseases | |||
| Onco-hematological neoplasm | 13 (6.5%) | 12 (6%) | .836 |
| Liver disease | 6 (3%) | 11 (5.5%) | .215 |
| Congestive heart disease | 26 (13%) | 29 (14.5%) | .663 |
| Cerebrovascular disease | 17 (8.5%) | 14 (7%) | .709 |
| Kidney disease | 14 (7%) | 14 (7%) | 1 |
| Diabetes | 27 (13.5%) | 33 (16.5%) | .484 |
| COPD | 30 (15%) | 28 (38%) | .352 |
| Number of concomitant diseases ±SDa | 0.68±0.80 | 0.77±0.83 | .732 |
| Median (range) | 1 (0–4) | 1 (0–4) | |
| Charlson index ±SD | 1.29±1.41 | 1.31±1.31 | .662 |
| Median (range) | 1 (0–6) | 1 (0–6) | |
| Cases with Ci=0 | 72 (36%) | 59 (29.5%) | NS |
| Cases with Ci=1 | 58 (29%) | 75 (37.5%) | NS |
| Cases with Ci ≥2 | 70 (35%) | 66 (33%) | NS |
| Weighted Charlson index ±SDb | 2.90±2.73 | 3.05±2.66 | .578 |
| Median (range) | 1 (0–10) | 1 (0–10) | |
| Cases with weighted Ci=0 | 54 (27%) | 48 (24%) | NS |
| Cases with weighted Ci=1 | 30 (15%) | 30 (15%) | NS |
| Cases with weighted Ci=2–5 | 77 (38.5%) | 80 (40%) | NS |
| Cases with weighted Ci ≥6 | 39 (19.5%) | 42 (21%) | NS |
| Clinical and severity criteria | |||
| Confusion-altered consciousness | 20 (10.30%) | 28 (14.07%) | .283 |
| Hypothermia (Temperature <35°C) | 14 (7.29%) | 14 (7.03%) | .922 |
| Sepsis criteria | 126 (64.94%) | 137 (68.84%) | .412 |
| Severe sepsis criteria | 28 (14.43%) | 43 (21.60%) | .068 |
| Septic shock criteria | 8 (4.12%) | 11 (5.52%) | .340 |
| Use of mechanical ventilation | 14 (7.21%) | 22 (10.05%) | .222 |
| SCAPc | 43 (21.5%) | 48 (24%) | .317 |
| PSI | |||
| PSI value mean age (years±SD) | 93.10±46.49 | 100.92±51.15 | .616 |
| Median (range) | 85 (17–230) | 92.5 (10–268) | |
| Distribution by PSI groups | 0.093 | ||
| PSI I | 36 (18%) | 38 (19%) | NS |
| PSI II | 40 (20%) | 26 (13%) | NS |
| PSI III | 33 (16.5%) | 34 (17%) | NS |
| PSI IV | 52 (26%) | 43 (21.5%) | NS |
| PSI V | 39 (19.5%) | 59 (29.5%) | .052 |
Percentages exclude missing data, if applicable.
ED: emergency department; CAP: community-acquired pneumonia; SD: standard deviation; AB: antibiotic; COPD: chronic obstructive pulmonary disease; PSI: Pneumonia Severity Index; NS: not significant or insufficient sample; Ci: Charlson index
Radiology, Blood Gas and Clinical laboratory Characteristics of Patients With a Diagnosis of CAP Treated in the ED.
| Patient characteristics (n=400) | Pre-intervention group (n=200) | Post-intervention group (n=200) | P-value |
| Radiology and blood gases | |||
| Unilobar/multilobar/bilateral infiltrate | 141/44/15 (70.5%–22%–7.5%) | 145/42/13 (72.5%–21%–6.5%) | .885 |
| Pleural effusion | 35 (17.5%) | 37 (18.5%) | .795 |
| Arterial pH<7.35 | 23 (11.5%) | 25 (12.5%) | .651 |
| PO2/FiO2<250 | 25 (13.81%) | 34 (15.52%) | .395 |
| Arterial pH<7.35 | 23 (11.5%) | 25 (12.5%) | .651 |
| PO2<60mmHg | 75 (37.5%) | 82 (41%) | .322 |
| Clinical laboratory findings | |||
| Urea>64mg/dl or Cr >1.5mg/dl | 45 (23.43%) | 55 (27.63%) | .356 |
| Sodium<130mEq/L | 15 (7.81%) | 22 (11.05%) | .303 |
| Blood glucose>250mg/dl | 22 (11.45%) | 26 (13.06%) | .628 |
| Hematocrit<30% | 20 (10.41%) | 16 (8.04%) | .485 |
| Leukocytosis >12 000/mm3or >10% bands | 114 (59.37%) | 132 (66.33%) | .174 |
| Leukopenia <4000/mm3 | 28 (14.58%) | 21 (10.55%) | .285 |
| Thrombocytopenia <100 000/mm3 | 27 (14.06%) | 28 (14.07%) | .998 |
| Biomarkers | |||
| Requested in ED | 38 (19.28%) | 180 (90%) | < .001 |
| CRP levels (mg/L)±SD (all patients) | 74.82±18.72 | 58.90±22.01 | < .001 |
| CRP (mg/L)±SD in PSI I | 68 | 45.82±24.58 | .383 |
| CRP (mg/L)±SD in PSI II | 54.55±31.34 | 51.02±18.51 | .751 |
| CRP (mg/L)±SD in PSI III | 69.92±19.69 | 49.25±16.06 | .004 |
| CRP (mg/L)±SD in PSI IV | 78.69±14.64 | 66.46±18.28 | .069 |
| CRP (mg/L)±SD in PSI V | 78.34±15.06 | 70.04±20.11 | .147 |
| PCT levels (ng/ml)±SD (all patients) | 4.89±11.31 | 2.51±12.88 | <0.001 |
| PCT (ng/ml)±SD in PSI I | 0.88 | 0.60±0.32 | .416 |
| PCT (ng/ml)±SD in PSI II | 3.31±4.47 | 1.22±1.47 | .079 |
| PCT (ng/ml)±SD in PSI III | 3.63±2.82 | 1.31±1.47 | .011 |
| PCT (ng/ml)±SD in PSI IV | 3.79±4.00 | 1.56±1.31 | .047 |
| PCT (ng/ml)±SD in PSI V | 4.56±3.65 | 5.16±4.92 | .220 |
Percentages exclude missing data, if applicable.
ED: emergency department; CAP: community-acquired pneumonia; SD: standard deviation; PSI: Pneumonia Severity Index; CRP: C-reactive protein; PCT: procalcitonin.

There were no significant differences between the preG and postG in the profile of the ED treating physician (resident/ED staff/other specialists), with proportions of 52.52%–41.41%–6.06% vs 54.5%–42.5%–3%, respectively (P=.339).
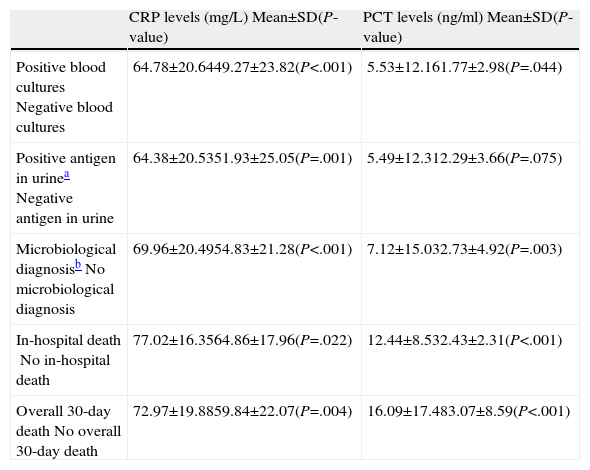
As can be seen in Table 3, there were significant differences between the preG and the postG in requesting CRP and/or PCT in the ED (19.28% vs 90% respectively; P<.001). However (and perhaps as a consequence of greater use in the postG), CRP and PCT levels were lower in the postG (74.82±18.72 vs 58.90±22.01mg/dl, for CRP and 4.89±11.31 vs 2.51±12.88ng/ml, for PCT; P<.001 in both cases). It can also be seen in Table 3 how differences of a greater magnitude appear in the concentration of both markers in the intermediate groups (PSI II-IV). When the mean CRPs of all the study patients were compared by clinical severity subgroups, a significant difference (P<.05) was found between patients without S and patients with S (P=.028), SS (P<.001) and SSh (P=.024), and between patients with S and patients with SS (P=.011), but no statistical difference was found between patients with SSh and patients with S and SS (P>.05). Similarly, when the mean PCT levels were evaluated, differences (P<.05) were found between patients without S and those with SS (P=.042) and SSh (P<.001), between patients with S and those in the SS (P=.017) and SSh (P<.001) subgroups, and between patients with SS and those with SSh (P<.001). In addition, in the patient set an association (P<.05) was shown between requesting biomarkers and early administration (<4h) of antimicrobials in the ED (82.6% vs 48.2%), the appropriate choice of antibiotic (66.5% vs 88.5%), the correct decision regarding the destination of the patient (89.3% vs 69.8%), requesting the appropriate clinical laboratory tests (92.2% vs 63.5%) and the correct request for microbiological testing (86.2% vs 61.2%). Table 4 shows the associations between biomarker levels and obtaining a microbiological diagnosis and in-hospital and overall 30-day mortality.
Relationship Between Biomarker Levels and Microbiological Diagnosis and Mortality.
| CRP levels (mg/L) Mean±SD(P-value) | PCT levels (ng/ml) Mean±SD(P-value) | |
| Positive blood culturesNegative blood cultures | 64.78±20.6449.27±23.82(P<.001) | 5.53±12.161.77±2.98(P=.044) |
| Positive antigen in urineaNegative antigen in urine | 64.38±20.5351.93±25.05(P=.001) | 5.49±12.312.29±3.66(P=.075) |
| Microbiological diagnosisbNo microbiological diagnosis | 69.96±20.4954.83±21.28(P<.001) | 7.12±15.032.73±4.92(P=.003) |
| In-hospital deathNo in-hospital death | 77.02±16.3564.86±17.96(P=.022) | 12.44±8.532.43±2.31(P<.001) |
| Overall 30-day deathNo overall 30-day death | 72.97±19.8859.84±22.07(P=.004) | 16.09±17.483.07±8.59(P<.001) |
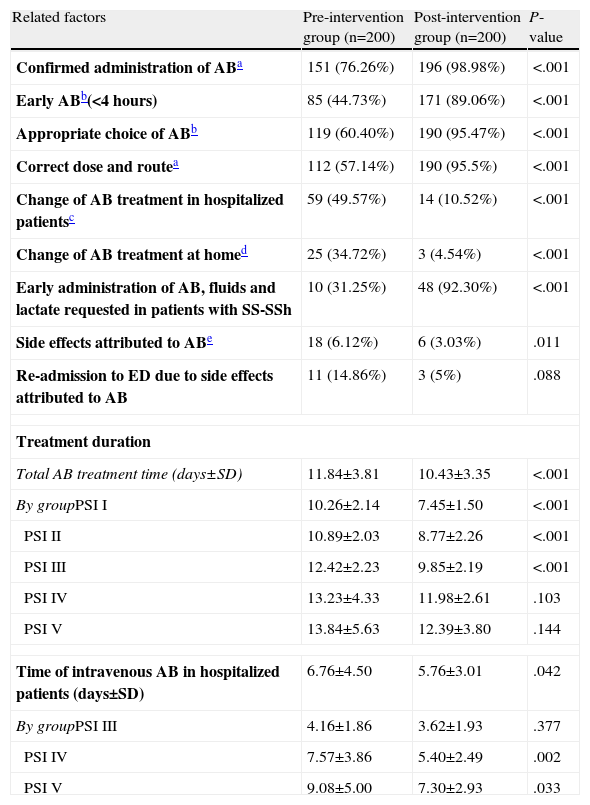
There is an obvious difference between the preG and the postG (in all cases with P<.001 and differences between 22% and 60%) in performance variables with the antibiotic in the ED that may change or influence the progress, disease course and prognosis of patients with CAP (Table 5). The administration of antibiotics in the ED, early administration during the first 4h, the appropriate choice of regimen and dosing, early administration of antibiotics and intravenous fluids for SS and SSh in the ED were greater in the postG. In contrast, the number of patients in whom the initial antibiotic regimen was changed, either on the ward or in the ICU, or for patients who were discharged, was significantly lower in the postG (see number of cases and percentages in Table 5). The total duration of antibiotic treatment in hospitalized patients was longer in the preG, both overall (11.84±3.81 vs 10.43±3.35 days; P<.001) and in each of the PSI groups (Table 5). This was also the case for the duration of intravenous antibiotic treatment in the overall patient set (6.76±4.50 days in the preG vs 5.76±3.01 days in the postG; P=.042) and in the PSI subgroups (Table 5). After adjusting for patient destination (discharge, observation, short-stay unit, ward, ICU or death) and PSI group, the mean difference continued to be higher in the preG for the total duration of antibiotic treatment (mean=1.6; 95% CI: 1.0–2.3 days) and for the time of intravenous administration (mean=1.4; 95% CI: 0.6–2.2 days).
Related Factors and Management of Antibiotics in CAP Patients Seen in the ED.
| Related factors | Pre-intervention group (n=200) | Post-intervention group (n=200) | P-value |
| Confirmed administration of ABa | 151 (76.26%) | 196 (98.98%) | <.001 |
| Early ABb(<4 hours) | 85 (44.73%) | 171 (89.06%) | <.001 |
| Appropriate choice of ABb | 119 (60.40%) | 190 (95.47%) | <.001 |
| Correct dose and routea | 112 (57.14%) | 190 (95.5%) | <.001 |
| Change of AB treatment in hospitalized patientsc | 59 (49.57%) | 14 (10.52%) | <.001 |
| Change of AB treatment at homed | 25 (34.72%) | 3 (4.54%) | <.001 |
| Early administration of AB, fluids and lactate requested in patients with SS-SSh | 10 (31.25%) | 48 (92.30%) | <.001 |
| Side effects attributed to ABe | 18 (6.12%) | 6 (3.03%) | .011 |
| Re-admission to ED due to side effects attributed to AB | 11 (14.86%) | 3 (5%) | .088 |
| Treatment duration | |||
| Total AB treatment time (days±SD) | 11.84±3.81 | 10.43±3.35 | <.001 |
| By groupPSI I | 10.26±2.14 | 7.45±1.50 | <.001 |
| PSI II | 10.89±2.03 | 8.77±2.26 | <.001 |
| PSI III | 12.42±2.23 | 9.85±2.19 | <.001 |
| PSI IV | 13.23±4.33 | 11.98±2.61 | .103 |
| PSI V | 13.84±5.63 | 12.39±3.80 | .144 |
| Time of intravenous AB in hospitalized patients (days±SD) | 6.76±4.50 | 5.76±3.01 | .042 |
| By groupPSI III | 4.16±1.86 | 3.62±1.93 | .377 |
| PSI IV | 7.57±3.86 | 5.40±2.49 | .002 |
| PSI V | 9.08±5.00 | 7.30±2.93 | .033 |
Percentages exclude missing data.
AB: antibiotic; ED: emergency department; COPD: chronic obstructive pulmonary disease; SS: severe sepsis; SSh: septic shock; iv: intravenous; OR: Odds ratio; CI: confidence interval.
Differences (P<.05) were also found in subgroups between the preG and the postG depending on PSI grade.
Differences (P<.05) were also found in subgroups between the preG and the postG depending on PSI grade and clinical severity grade (patients with sepsis, severe sepsis and septic shock).
Includes any change in type of antimicrobial agent and/or dosing in the first 48h after admission to the short-stay unit, the hospital ward or the intensive care unit. This difference is more significant (P<.05) between preG and postG in groups with PSI IV and V.
Includes any change in type of antimicrobial agent and/or dosing by the primary care physician, emergency department or in outpatients in the first 72h in patients discharged directly or after remaining under observation. This difference is significant (P<.05) between preG and postG in groups with PSI I.
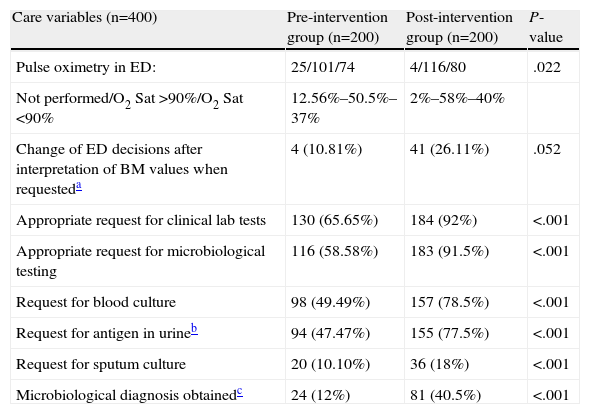
There were significant and relevant differences (P<.001 and differences greater than 25% in all cases) in favor of the postG in the decisions of the EP on specific actions concerning care (Table 6) with respect to the appropriate request for clinical laboratory and microbiology testing (blood cultures, antigen in urine, sputum culture). Moreover, while a microbiological diagnosis was achieved in 12% of the preG cases, the corresponding figure in the postG was 45.5% (P<.001). There was also a greater number of changes in decisions (regimens or patient destination) after biomarkers were interpreted in postG (10.81% vs 26.11%; P=.052). Finally, it is worth remarking that 12.56% of patients in the preG did not have measurement of O2 saturation, compared to 2% in the postG (P=.022); this difference is most obvious in the PSI I subgroup (27.8% vs 2.6%; P=.010).
Factors Related With the Appropriateness of Care in CAP Patients in the ED.
| Care variables (n=400) | Pre-intervention group (n=200) | Post-intervention group (n=200) | P-value |
| Pulse oximetry in ED: | 25/101/74 | 4/116/80 | .022 |
| Not performed/O2 Sat >90%/O2 Sat <90% | 12.56%–50.5%–37% | 2%–58%–40% | |
| Change of ED decisions after interpretation of BM values when requesteda | 4 (10.81%) | 41 (26.11%) | .052 |
| Appropriate request for clinical lab tests | 130 (65.65%) | 184 (92%) | <.001 |
| Appropriate request for microbiological testing | 116 (58.58%) | 183 (91.5%) | <.001 |
| Request for blood culture | 98 (49.49%) | 157 (78.5%) | <.001 |
| Request for antigen in urineb | 94 (47.47%) | 155 (77.5%) | <.001 |
| Request for sputum culture | 20 (10.10%) | 36 (18%) | <.001 |
| Microbiological diagnosis obtainedc | 24 (12%) | 81 (40.5%) | <.001 |
Percentages exclude missing data.
ED: emergency department; CAP: community-acquired pneumonia; BM: biomarkers.
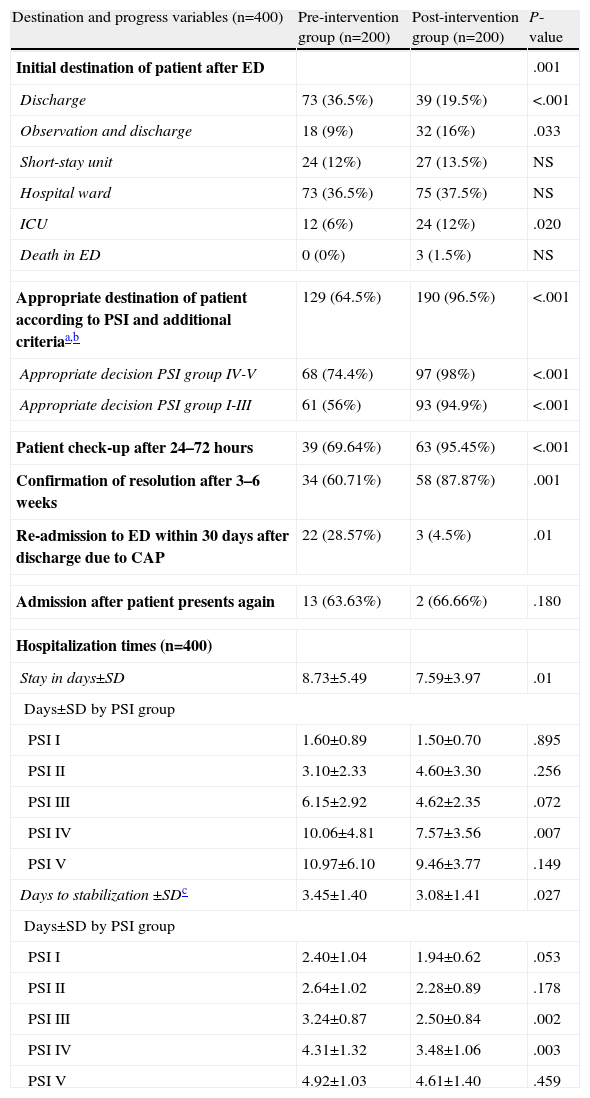
Discharge directly from the ED was more common in the preG, while in the postG, the decision was more frequently taken to keep the patient under observation and there was a higher rate of ICU admissions from the ED (values are shown in Table 7). In the preG, 35% of patients had an initially inappropriate destination (inappropriate discharge or admission) compared to 3.6% of the postG (P<.001) (Table 7). The appropriateness of the destination of the patient from the ED according to the PSI recommendations and the additional criteria indicated in Table 1 was also improved in the postG (64.5% vs 96.5%; P<.001). Specifically, “inappropriate discharges” in the PSI IV–V groups fell from 35.5% (preG) to 2% (postG) (P<.001) and inappropriate admissions or discharges in the PSI I–III groups fell from 44% to 5.1% (P<.001). Both the check-up of the patient 24–72h after discharge and the confirmation of clinical and radiological resolution 3–6 weeks later was significantly greater in the postG (P<.01), while the number of re-admissions to the ED after initial discharge was lower in the postG (P=.01).
Indicator Factors for Progress and Destination of Patients Diagnosed With CAP in the ED.
| Destination and progress variables (n=400) | Pre-intervention group (n=200) | Post-intervention group (n=200) | P-value |
| Initial destination of patient after ED | .001 | ||
| Discharge | 73 (36.5%) | 39 (19.5%) | <.001 |
| Observation and discharge | 18 (9%) | 32 (16%) | .033 |
| Short-stay unit | 24 (12%) | 27 (13.5%) | NS |
| Hospital ward | 73 (36.5%) | 75 (37.5%) | NS |
| ICU | 12 (6%) | 24 (12%) | .020 |
| Death in ED | 0 (0%) | 3 (1.5%) | NS |
| Appropriate destination of patient according to PSI and additional criteriaa,b | 129 (64.5%) | 190 (96.5%) | <.001 |
| Appropriate decision PSI group IV-V | 68 (74.4%) | 97 (98%) | <.001 |
| Appropriate decision PSI group I-III | 61 (56%) | 93 (94.9%) | <.001 |
| Patient check-up after 24–72 hours | 39 (69.64%) | 63 (95.45%) | <.001 |
| Confirmation of resolution after 3–6 weeks | 34 (60.71%) | 58 (87.87%) | .001 |
| Re-admission to ED within 30 days after discharge due to CAP | 22 (28.57%) | 3 (4.5%) | .01 |
| Admission after patient presents again | 13 (63.63%) | 2 (66.66%) | .180 |
| Hospitalization times (n=400) | |||
| Stay in days±SD | 8.73±5.49 | 7.59±3.97 | .01 |
| Days±SD by PSI group | |||
| PSI I | 1.60±0.89 | 1.50±0.70 | .895 |
| PSI II | 3.10±2.33 | 4.60±3.30 | .256 |
| PSI III | 6.15±2.92 | 4.62±2.35 | .072 |
| PSI IV | 10.06±4.81 | 7.57±3.56 | .007 |
| PSI V | 10.97±6.10 | 9.46±3.77 | .149 |
| Days to stabilization ±SDc | 3.45±1.40 | 3.08±1.41 | .027 |
| Days±SD by PSI group | |||
| PSI I | 2.40±1.04 | 1.94±0.62 | .053 |
| PSI II | 2.64±1.02 | 2.28±0.89 | .178 |
| PSI III | 3.24±0.87 | 2.50±0.84 | .002 |
| PSI IV | 4.31±1.32 | 3.48±1.06 | .003 |
| PSI V | 4.92±1.03 | 4.61±1.40 | .459 |
Percentages exclude missing data.
CAP: community-acquired pneumonia; AB: antibiotic; ED: emergency department; SS: severe sepsis; SSh: septic shock; iv: intravenous; OR: Odds ratio; CI: confidence interval; NS: not significant or not applicable.
In addition to the PSI and the additional criteria specified in Table 1, the clinical assessment or judgment of the EP is taken into account.
According to the criteria of Halm et al26: heart rate <100bpm, respiratory rate <24rpm, temperature <37.2°C, systolic blood pressure >90mmHg, O2 saturation >90%, good level of consciousness and oral route tolerated.
Duration of hospitalization and the time to achieve clinical stabilization according to the criteria of Halm et al.26 are shown in Table 7. Mean time to clinical stabilization in patients admitted to the short-stay unit and the ward or under observation was significantly higher in the preG (4 days; 95% CI: 3.6–4.4 days) than in the postG (3 days; 95% CI: 2.7–3.3 days). This result was maintained after adjusting by group for PSI or destination (discharge, observation, short-stay unit, ward or ICU). Differences were found between the preG and the postG, with the overall duration of hospital stay being greater in the preG (8.73±5.49 vs 7.59±3.97 days, P=.01). The difference was maintained after adjusting for PSI category and for patient destination (discharge, observation, short-stay unit, ward or ICU) (P=.011). Regarding the hospital stay data (Fig. 2), it is worth pointing out that while in the first phase, the time needed for 50% of the patients to be discharged from the ward or the short-stay unit was 9 days (95% CI: 8–10 days), in the postG the corresponding figure was 7 days (95% CI: 6–8 days); moreover, 8 days (95% CI: 7–9 days) were required in the preG and 11 days in the postG (95% CI: 9–13 days) for 75% of patients to be discharged. After controlling for PSI group and for place of admission, there was no appreciable change in these differences.
.")
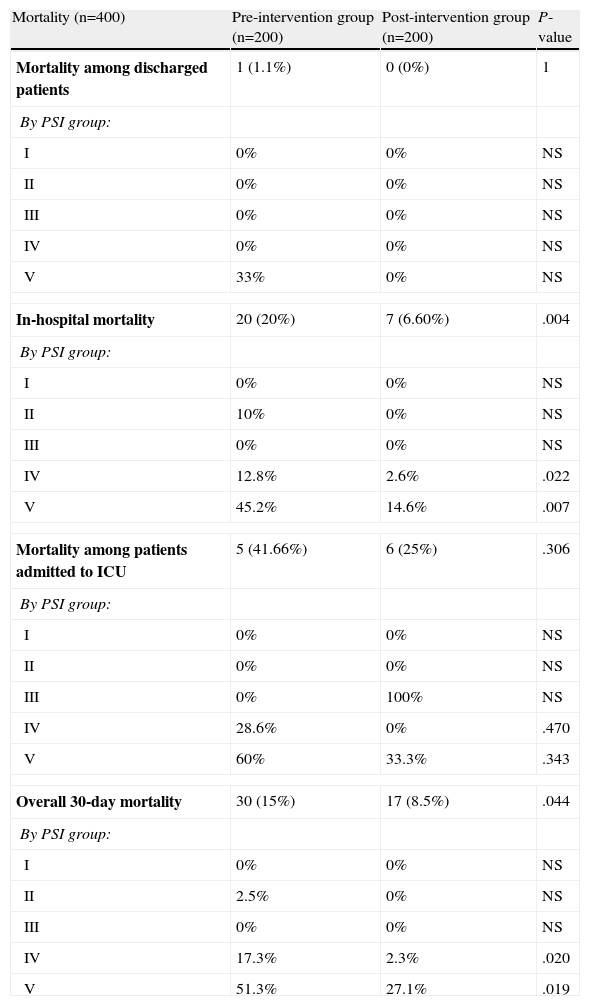
Raw mortality data are shown in Table 8. No significant differences were found between preG and postG for mortality in discharged patients (1.1% vs 0%, P=1) or in patients admitted to the ICU, although this was higher in the preG cases compared to the postG cases (41.66% vs 25%, P=.306). However, there were differences in in-hospital mortality (20% vs 6.60%, P=.004) and in overall 30-day mortality (15% vs 8.5%, P=.044). The results by PSI group are presented in Table 8. In addition, it was found that selecting the wrong antibiotic regimen in the ED compared to the correct choice was related with both in-hospital mortality (P=.004) and overall 30-day mortality (P=.008). Early administration of antibiotics in the ED was related with lower overall 30-day mortality (31.7% vs 15.3%, P=.068). Finally, when in-hospital mortality adjusted for related covariates (age, number of comorbidities, Charlson index, PSI group and presence of S, SS or SSh criteria) was compared between the preG and the postG, the difference remained significant at P=.002 and OR: 0.191 (95% CI: 0.067–0.545). The situation was similar for overall 30-day mortality adjusted for related covariates (age, number of comorbidities, Charlson index, PSI group and presence of S, SS or SSh), with the differences being maintained (OR: 0.270; 95% CI: 0.123–0.590, P=.001).
Mortality in CAP Patients After Being Seen in the ED.
| Mortality (n=400) | Pre-intervention group (n=200) | Post-intervention group (n=200) | P-value |
| Mortality among discharged patients | 1 (1.1%) | 0 (0%) | 1 |
| By PSI group: | |||
| I | 0% | 0% | NS |
| II | 0% | 0% | NS |
| III | 0% | 0% | NS |
| IV | 0% | 0% | NS |
| V | 33% | 0% | NS |
| In-hospital mortality | 20 (20%) | 7 (6.60%) | .004 |
| By PSI group: | |||
| I | 0% | 0% | NS |
| II | 10% | 0% | NS |
| III | 0% | 0% | NS |
| IV | 12.8% | 2.6% | .022 |
| V | 45.2% | 14.6% | .007 |
| Mortality among patients admitted to ICU | 5 (41.66%) | 6 (25%) | .306 |
| By PSI group: | |||
| I | 0% | 0% | NS |
| II | 0% | 0% | NS |
| III | 0% | 100% | NS |
| IV | 28.6% | 0% | .470 |
| V | 60% | 33.3% | .343 |
| Overall 30-day mortality | 30 (15%) | 17 (8.5%) | .044 |
| By PSI group: | |||
| I | 0% | 0% | NS |
| II | 2.5% | 0% | NS |
| III | 0% | 0% | NS |
| IV | 17.3% | 2.3% | .020 |
| V | 51.3% | 27.1% | .019 |
CAP: community-acquired pneumonia; ED: emergency department; PSI: Pneumonia Severity Index; NS: not significant or not applicable due to lack of sample.
The implementation of a CPG in an ED which includes biomarkers of inflammation and infection may become an effective tool for, firstly, reducing the variability in the most important decisions which must be made by the physician in the management of a patient with CAP, such as requesting clinical laboratory and microbiological tests, the early administration of appropriate treatment and the decision to admit or discharge (when), and the appropriate destination of the patient (where). Secondly, it can reduce the overall mortality of the disease, reduce the incidence of inappropriate discharges and admissions and the consequences of this, and reduce the time necessary for achieving clinical stabilization and, as a result, reduce the length of hospital stay. We can confirm that our intervention was effective for the patient and efficient for the system, as a significant positive change between the preG and the postG was found for all the indicators mentioned, supporting earlier publications.17 In this respect, we agree with Capelastegui et al.13 who, in a pioneering study published after implementation of a CPG in their hospital, reported a reduction of antibiotic treatment times (overall 1.5 days and intravenous 1.3 days), hospital stay (1.8 days) and inappropriateness of the antibiotic regimen selected (from 28.6% to 11.8%). They also found a reduction in in-hospital mortality (OR 2.46; 95% CI: 1.37–4.41) and overall 30-day mortality (OR 2.14; 95% CI: 1.23–3.72). These results are very similar to ours, although two fundamental differences in the study of Capelastegui et al. must be pointed out: they had an external control group derived from other centers and only included hospitalized patients. Blasi et al.,14 in an Italian study of hospitalized patients with percentages and values very similar to ours, showed that, although the CPG for CAP was not closely followed by their physicians (33%), as was the case in our ED, its efficacy in reducing mortality (OR 0.77; 95% CI:0.51–0.98) and in increasing the appropriate choice of antibiotic regimen (9.1%–5.7%), identified as one of the most relevant factors in the reduction of mortality, was obvious. We also found in our study that the wrong choice of antibiotic regimen in the ED was associated both with in-hospital mortality (P=.004) and overall 30-day mortality (P=.008). In contrast, early administration of antibiotics in the ED, although associated with lower mortality, both in-hospital and overall 30-day mortality (31.7% vs 15.3%), did not reach statistical significance, although there was a marked effect. In a study of 780 patients hospitalized with CAP, Dambrada et al.27 confirmed that there were differences in mortality depending on whether or not there was adherence to the antibiotic recommended by the CPG used in their center (3% vs 10.6%). This reduction is proportionally comparable to the reduction observed by us (8.5% vs 15%). These data reaffirm the importance of the early administration of the appropriate antibiotic in the prognosis of CAP, as indicated by CPG.1,2,6,12 Beyond these affirmations, Dean et al.16 managed to “quantify” the impact of the implementation of a CPG in the management of CAP and reported that a 10% increase in the use of the CPG by physicians was associated with a reduction in mortality (OR 0.92; 95% CI: 0.87–0.98, P=.007), so even if only some of the physicians subscribe to following the CPG, its impact will still be noted and the effort of making the intervention will be rewarded. The positive effect of the application of the CPG on long-term mortality remains to be clarified, since it is known that 1–5 years after admission for CAP, patients present higher than expected mortality and frequent severe cardiovascular complications,28 and that several biomarkers for inflammation and vascular disease are elevated in CAP patients with poorer short and long-term prognoses.29–33 Indeed, the inclusion of biomarkers (CRP and PCT) to complement the CAP prognostic severity scales (PSI and/or CURB-65)8,30 as predictors of bacteremia34 and mortality30–32 and even bacterial etiology35 is becoming increasingly common in EDs. In our study we included an arbitrary value of PCT >1ng/ml as an additional criterion for requiring admission (or at least follow-up under observation), blood cultures and early administration of antibiotics, in view of the probability of bacteremia and progression to SS or SSh presented by the patients, according to the recommendations of various authors.29,34 The results of our study confirm that high biomarker values, particularly PCT, are associated with bacteremia, positive antigen in urine and/or confirmed microbiological diagnosis and mortality; these were significantly greater (P<.05) when PCT was higher than 2ng/ml. For this reason, in accordance with other authors,29,34 we believe that obtaining blood cultures and early administration of antibiotics are indicated in a patient with CAP and PCT >0.5ng/ml, and that this parameter should be taken into account when making a prognostic evaluation with PSI or CURB-65.
The decision whether to admit the patient or not and the appropriateness of this decision will affect both the requests for complementary tests and the type of treatment, and as such, the patient's prognosis and progress. For this reason, inappropriate discharges and unjustified admissions must be reduced. Routine implementation in an ED of a CPG which incorporates the PSI is known to reduce unjustified admissions, and lead to a better choice of place of treatment (outpatients or hospital) and the appropriateness and timeliness of antibiotic treatment.18,36 Variability in the percentage of admissions between different centers and different physicians is very wide3,4 when no CPG is followed, and even when adherence is high, if there are criteria present that are not covered by the PSI. In a study carried out in 12 EDs which closely followed a CPG with the PSI scale, Aujesky et al.20 found that 37.4% of the patients with PSI I-III were admitted and 3.2% of the PSI IV–V cases were discharged. In this respect, Laberere et al.37 also observed that 44.7% of low risk patients (PSI I–III) were admitted and of these, 20% lacked any justification or criteria for admission. In another recent study38 evaluating the appropriateness of hospital admissions due to CAP, a lower proportion of inappropriate admissions (6.07%) was observed in the low risk group (PSI I-III), but there was a high proportion of inappropriate discharges (according to the PSI and additional criteria), reaching 32.89%. In our study, the inappropriate choice of initial destination was significantly reduced in the postG (from 35.5% to 3.5%, P<.001). For PSI I–III patients, we observed, as in the study of Hinojosa et al.,38 that inappropriateness was due in large part to inappropriate discharges (because some of the additional criteria listed in Table 1 were not taken into consideration), rather than due to inappropriate admissions of PSI I–III patients. In other words, the need for admission from the ED was underestimated. We think that the improvement in appropriateness of the decision to admit or discharge in our study is due to several factors: direct discharge from the ED was more frequent in the preG (36.5% vs 19.5%, P<.001), the decision to keep the patient under observation was taken on more occasions in the postG (9% vs 16%, P=.033) and PCT >1ng/ml was the criterion that changed the discharge/admission decision in 26% of the PSI I–II patients, assuming a significant inflammatory response, the high probability of bacteremia or the presence of criteria for sepsis.
Implementing a CPG also has implications for the system. In addition to avoiding unnecessary admissions and the associated costs,9 a reduction in length of hospital stay and duration of antibiotic treatment is achieved,13 as we also found in our study (1.14 and 1.41 days, respectively). Other information provided by our study is the reduction in time to clinical stabilization (0.37 days), which as we have seen is associated with early administration of antibiotics in the ED and with the faster freeing-up of hospital beds, which will also benefit new CAP patients awaiting admission in our frequently overloaded EDs.39
Although our study has several weaknesses, we believe that it is a true reflection of the change in management and improvement in the overall care of the CAP patient in our ED. However, the limitations of our study include that it was carried out in a single center with no external comparative group, and the sample size in some of the comparisons carried out was small, particularly when we tried to establish comparisons between PSI or clinical severity (S, SS, SSh) subgroups. It must also be taken into account that the EPs in both pre and post-intervention groups were different (the turnaround among resident physicians and the ED staff itself was estimated to be about 40%) so there may have been a bias in the experience and adherence to CPGs between the groups. The case collection period was not a calendar year for each group (which would eliminate any possible seasonal variation in etiology), although, as we have observed, there were no significant differences in the diagnoses determined. Although the CPG had the same criteria for all, the evaluation of all the points by two external, independent collaborators (in spite of the exclusion of cases for which there were discrepancies) may also introduce a subjective component. The time of evolution of the CAP was not recorded in the study, although this may a factor that could alter some values and the interpretation of the biomarkers. In spite of these limitations, we believe that this study may serve as a reference and example of how to improve the care of the population of patients presenting in the ED with CAP, and perhaps encourage those clinicians who do not use CPGs to overcome their resistance.40,41 For future studies, the question remains whether the positive effect after implementation of the CPG will last or if new interventions or other reinforcing initiatives will be necessary.15
In conclusion, the implementation of the 2008 SEMES-SEPAR CPG, recommending the use of PSI and biomarkers, significantly improved the management of CAP care in our ED, and was beneficial both for patients and for the system, leading to a reduction of in-hospital and overall 30-day mortality and more appropriate decision-making regarding the destination of the patient, requests for studies indicated and the early administration of appropriate antibiotic treatment, along with reduction of the time to clinical stabilization of the patient and of the duration of hospital stay.
Conflict of InterestThe authors declare that there were no conflicts of interest.
We thank Sancho Rodríguez Villar and the Departments of Admission, Documentation and Microbiology of the Complejo Hospitalario de Toledo for their help in data collection and writing this manuscript. Our thanks also go to all the physicians who, with their voluntary adherence to the CPGs, made this study possible.
Please cite this article as: Julián-Jiménez A, et al. Mejora del manejo de la neumonía adquirida en la comunidad en el servicio de urgencias. Arch Bronconeumol. 2013;49:230–40.


