


The EPI-SCAN study (Epidemiologic Study of COPD in Spain), conducted from May 2006 to July 2007, determined that the prevalence of COPD in Spain according to the GOLD criteria was 10.2% of the 40 to 80 years population. Little is known about the current geographical variation of COPD in Spain.
ObjectivesWe studied the prevalence of COPD, its under-diagnosis and under-treatment, smoking and mortality in the eleven areas participating in EPI-SCAN. COPD was defined as a post-bronchodilator FEV1/FVC ratio <0.70 or as the lower limit of normal (LLN).
ResultsThe ratio of prevalences of COPD among the EPI-SCAN areas was 2.7-fold, with a peak in Asturias (16.9%) and a minimum in Burgos (6.2 %) (P<.05). The prevalence of COPD according to LLN was 5.6% (95% CI 4.9–6.4) and the ratio of COPD prevalence using LLN was 3.1-fold, but with a peak in Madrid-La Princesa (10.1%) and a minimum in Burgos (3.2%) (P<.05). The ranking of prevalences of COPD was not maintained in both sexes or age groups in each area. Variations in under-diagnosis (58.6% to 72.8%) and under-treatment by areas (24.1% to 72.5%) were substantial (P<.05). The prevalence of smokers and former smokers, and cumulative exposure as measured by pack-years, and the age structure of each of the areas did not explain much of the variability by geographic areas. Nor is there any relation with mortality rates published by Autonomous Communities.
ConclusionThere are significant variations in the distribution of COPD in Spain, either in prevalence or in under-diagnosis and under-treatment.
El estudio EPI-SCAN (Epidemiologie Study of COPD in Spain), realizado entre mayo de 2006 y julio de 2007, ha determinado que la prevalencia de la EPOC en España según los criterios GOLD es del 10,2% (IC 95% 9,2–11,1) de la población de 40 a 80 años. Se desconoce la variabilidad geográfica actual de la EPOC en España.
ObjetivosDescribir la prevalencia de EPOC, su infradiagnóstico e infratratamiento, y los datos de tabaquismo y mortalidad en las once áreas participantes en el estudio EPI-SCAN. Se definió EPOC como un cociente FEV,/FVC posbroncodilatador < 0,70 o menor del límite inferior de la normalidad (LIN).
ResultadosLa razón de prevalencias de EPOC según criterios GOLD entre áreas fue de 2,7 veces, con un máximo en Asturias (16,9%) y un mínimo en Burgos (6,2%) (p < 0,05). La prevalencia de EPOC según el LIN fue del 5,6% (IC 95% 4,9–6,4) y la razón de prevalencias utilizando el LIN fue de 3,1 veces, pero con un máximo en Madrid-La Princesa (10,1%) y un mínimo en Burgos (3,2%) (p < 0,05). El orden de prevalencias de EPOC por áreas no se mantuvo en ambos sexos ni por edades en cada área. Las variaciones en infradiagnóstico (58,6% a 72,8%) e infratratamiento por áreas (24,1% a 72,5%) fueron sustanciales (p < 0,05). La prevalencia de fumadores y ex-fumadores, y la exposición acumulada medida por paquetes-año, así como la estructura de edad de cada una de las áreas, no explican la variabilidad por áreas geográficas. Tampoco existe relación con las tasas de mortalidad publicadas por comunidad autónoma.
ConclusiónExisten importantes variaciones en la distribución de la EPOC en España, tanto en prevalencia como en infradiagnóstico e infratratamiento.
The latest report by the World Health Organization on the situation of smoking in the world shows that Spain, with 44.5 million inhabitants, 26% of whom are regular smokers and 3% occasional smokers, is still in phase III of the smoking epidemic curve.1 A decrease has been observed among male smokers but numbers remain steady among women, still a long way off the phase IV of the population of Western Europe. Monitoring chronic diseases related to tobacco use is a relevant, current issue. Preliminary data from December 2009 from the European Health Survey show a surprising increase in smoking among adults in Spain, reaching 31.5% at the present time.2
The EPI-SCAN study determined that the current prevalence of COPD in Spain according to the GOLD criteria is 10.2% (95% CI, 9.2–11.1) of the 40 to 80 years population.3 Previously, the IBERPOC study in 1997 determined a prevalence of COPD of 9.1% (14.3% in men and 3.9% in women), with important differences between the 7 participating areas.4 COPD is defined according to the former criteria of the European Respiratory Society as a post-bronchodilator FEV1/FVC ratio <88% of the predicted value in men and 89% in women. On this subject, the high number of cases detected in some geographical areas in the IBERPOC study corresponded with female non-smokers over 55 years with a history of childhood respiratory diseases who suffered no symptoms of expectoration or wheezing.5
The comparison of the spirometry results in the IBERPOC and EPI-SCAN studies have been described recently.6 However, the geographical variations in COPD in Spain at present are unknown, as are its relationship with smoking and other local determining factors. The so-called geographical or small area epidemiology7 encourages the local dissemination of health data compared with surrounding towns, which makes it possible to establish priorities for carrying out correction mechanisms, as recently reviewed.8 Furthermore, it should make it possible to monitor and/or confirm that community strategy recommendations are being implemented.9 Internationally, both the PLATINO and BOLD initiatives identified important differences in the distribution of the prevalence of COPD,10,11 although in both studies the samples were from one single city or area per country, so it is not possible to determine the variability within the country or in small areas. The aim of this article is to determine if there are variations in the prevalence, under-diagnosis and under-treatment of COPD among the 11 areas participating in the EPI-SCAN, and to analyze if these variations are related to some of its determining factors, including smoking on an individual level and the COPD official mortality rates published by the autonomous communities at an ecological level.
MethodThe methodology and protocol of the EPI-SCAN study have been described previously in detail.12 Briefly, the EPI-SCAN is population-based, multi-centred, cross-sectional, observational, epidemiologic study carried out on national scale with a randomized selection of participants using two-stage sampling, stratified by areas close to the participating centres. The participating centres were selected in accordance with four geographical areas (north, east, south and centre) in Spain, which are: Barcelona, Burgos, Cordoba, Huesca, Madrid (two centres), Oviedo, Seville, Valencia, Vic and Vigo. Two-stage, population-based, randomized sampling was performed using telephone sampling and including men and women in the general population aged between 40 and 80 years and resident in Spain. The field work was performed between May 2006 and July 2007. The study was authorized and presented by the corresponding ethics committees for clinical research, the Clinic i Provincial Hospital in Barcelona being the reference committee. All the participants gave their voluntary written consent to participate in the trials.
Information was collected about sociodemographic data, smoking habits, previous diagnosis of respiratory diseases and other pathologies, COPD exacerbations, dyspnoea scale, and treatment for respiratory diseases, amongst other variables. The presence of respiratory symptoms (daily morning cough, frequent sputum, and the presence at some time of dyspnoea and wheezing) was collected using the Spanish version of the CECA questionnaire.13 Forced spirometry was carried out with MasterScope CT (VIASY Healthcare®, Hoechberg, Germany, using the acceptability and reproducibility criteria and the selection of manoeuvre proposed in the most recent recommendations of the American Thoracic Society/European Respiratory Society (ATS/ERS),14 the reference values of the CECA were used.15 The manoeuvres were repeated 15–30 min after inhaling 200 mcg of salbutamol. Following the criteria of the ATS/ERS guidelines,16 the bronchodilator test was considered positive when recording an increase in FEV1 or FVC >200 ml and >12% with regard to the baseline value.
In the present analysis, COPD was defined in two ways: As a post-bronchodilator FEV1/FVC ratio<0.70 or as the lower limit of normal,14 which is the percentile 5 of the distribution of the variable FEV1/FVC in the general population, in accordance with the reference values of the CECA.15
The mortality rate by autonomous community and gender, adjusted for the European population/100,000 inhabitants was collected from official statistics.17
Statistical AnalysisThe EPI-SCAN study was carried out using the following calculation of the sample size. The prevalence of COPD was estimated at 12%, with an accuracy of ±1%, and assuming a 20% drop-out rate the theoretical number of individuals to be included in the study was 5,071. Considering, subsequently, that the mean number of participants in the 11 areas of the EPI-SCAN was 345, with a maximum of 439 in Burgos and a minimum of 136 in Asturias, there is statistical power for most comparisons of the areas with regard to the mean. Furthermore, the estimator and its 95% confidence interval are shown in most of the analyses. The results for each variable are shown as the mean with standard deviation in the case of the continuous variables, and using the number of cases for each category and the frequency regarding the total number of responses in the case of the categorical variables. The prevalence of COPD and its 95% confidence interval were calculated in accordance with two spirometry criteria (GOLD and LLN).14
The statistical significance in tables 1 and 2 was compared in each variable by area in relation to the global EPI-SCAN study, performing first an ANOVA and then a bilateral test for continuous variables, and a Chi-squared test for the categorical ones. Spearman's correlation coefficient was used to determine the relationship between the prevalence of COPD by area and the pack-years by area and the published mortality rates in each autonomous community,17 respectively. In all the statistical tests performed a level of statistical significance below 0.05 was used.
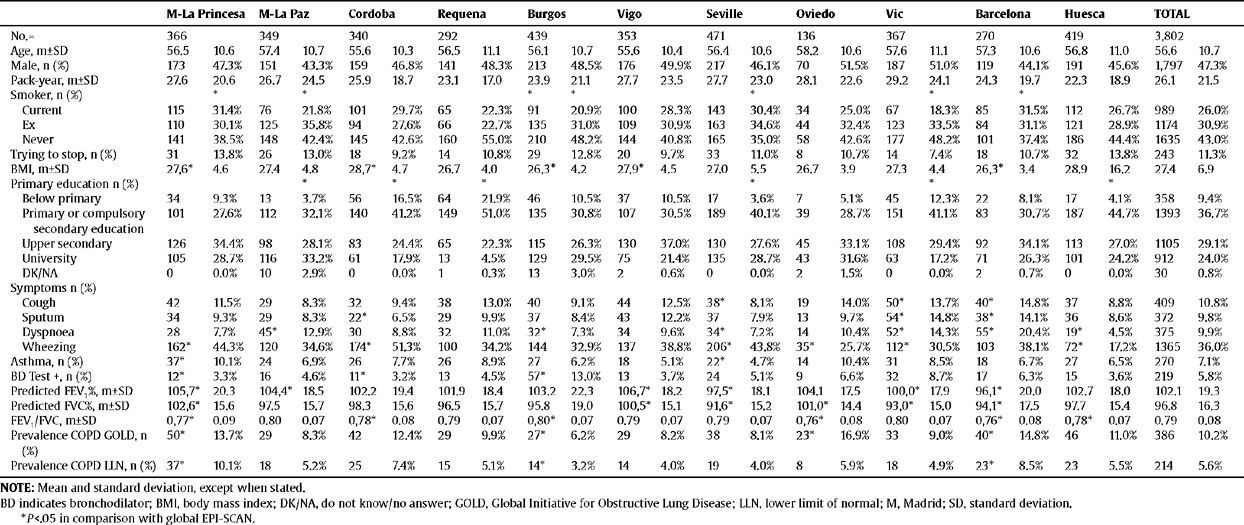
Sociodemographic and clinical characteristics of the participants of the EPI-SCAN study by area
| M-La Princesa | M-La Paz | Cordoba | Requena | Burgos | Vigo | Seville | Oviedo | Vic | Barcelona | Huesca | TOTAL | |||||||||||||
| No.= | 366 | 349 | 340 | 292 | 439 | 353 | 471 | 136 | 367 | 270 | 419 | 3,802 | ||||||||||||
| Age, m±SD | 56.5 | 10.6 | 57.4 | 10.7 | 55.6 | 10.3 | 56.5 | 11.1 | 56.1 | 10.7 | 55.6 | 10.4 | 56.4 | 10.6 | 58.2 | 10.6 | 57.6 | 11.1 | 57.3 | 10.6 | 56.8 | 11.0 | 56.6 | 10.7 |
| Male, n (%) | 173 | 47.3% | 151 | 43.3% | 159 | 46.8% | 141 | 48.3% | 213 | 48.5% | 176 | 49.9% | 217 | 46.1% | 70 | 51.5% | 187 | 51.0% | 119 | 44.1% | 191 | 45.6% | 1,797 | 47.3% |
| Pack-year, m±SD | 27.6 | 20.6 | 26.7 | 24.5 | 25.9 | 18.7 | 23.1 | 17.0 | 23.9 | 21.1 | 27.7 | 23.5 | 27.7 | 23.0 | 28.1 | 22.6 | 29.2 | 24.1 | 24.3 | 19.7 | 22.3 | 18.9 | 26.1 | 21.5 |
| Smoker, n (%) | * | * | * | * | * | * | * | |||||||||||||||||
| Current | 115 | 31.4% | 76 | 21.8% | 101 | 29.7% | 65 | 22.3% | 91 | 20.9% | 100 | 28.3% | 143 | 30.4% | 34 | 25.0% | 67 | 18.3% | 85 | 31.5% | 112 | 26.7% | 989 | 26.0% |
| Ex | 110 | 30.1% | 125 | 35.8% | 94 | 27.6% | 66 | 22.7% | 135 | 31.0% | 109 | 30.9% | 163 | 34.6% | 44 | 32.4% | 123 | 33.5% | 84 | 31.1% | 121 | 28.9% | 1174 | 30.9% |
| Never | 141 | 38.5% | 148 | 42.4% | 145 | 42.6% | 160 | 55.0% | 210 | 48.2% | 144 | 40.8% | 165 | 35.0% | 58 | 42.6% | 177 | 48.2% | 101 | 37.4% | 186 | 44.4% | 1635 | 43.0% |
| Trying to stop, n (%) | 31 | 13.8% | 26 | 13.0% | 18 | 9.2% | 14 | 10.8% | 29 | 12.8% | 20 | 9.7% | 33 | 11.0% | 8 | 10.7% | 14 | 7.4% | 18 | 10.7% | 32 | 13.8% | 243 | 11.3% |
| BMI, m±SD | 27,6* | 4.6 | 27.4 | 4.8 | 28,7* | 4.7 | 26.7 | 4.0 | 26,3* | 4.2 | 27,9* | 4.5 | 27.0 | 5.5 | 26.7 | 3.9 | 27.3 | 4.4 | 26,3* | 3.4 | 28.9 | 16.2 | 27.4 | 6.9 |
| Primary education n (%) | * | * | * | * | * | * | ||||||||||||||||||
| Below primary | 34 | 9.3% | 13 | 3.7% | 56 | 16.5% | 64 | 21.9% | 46 | 10.5% | 37 | 10.5% | 17 | 3.6% | 7 | 5.1% | 45 | 12.3% | 22 | 8.1% | 17 | 4.1% | 358 | 9.4% |
| Primary or compulsory secondary education | 101 | 27.6% | 112 | 32.1% | 140 | 41.2% | 149 | 51.0% | 135 | 30.8% | 107 | 30.5% | 189 | 40.1% | 39 | 28.7% | 151 | 41.1% | 83 | 30.7% | 187 | 44.7% | 1393 | 36.7% |
| Upper secondary | 126 | 34.4% | 98 | 28.1% | 83 | 24.4% | 65 | 22.3% | 115 | 26.3% | 130 | 37.0% | 130 | 27.6% | 45 | 33.1% | 108 | 29.4% | 92 | 34.1% | 113 | 27.0% | 1105 | 29.1% |
| University | 105 | 28.7% | 116 | 33.2% | 61 | 17.9% | 13 | 4.5% | 129 | 29.5% | 75 | 21.4% | 135 | 28.7% | 43 | 31.6% | 63 | 17.2% | 71 | 26.3% | 101 | 24.2% | 912 | 24.0% |
| DK/NA | 0 | 0.0% | 10 | 2.9% | 0 | 0.0% | 1 | 0.3% | 13 | 3.0% | 2 | 0.6% | 0 | 0.0% | 2 | 1.5% | 0 | 0.0% | 2 | 0.7% | 0 | 0.0% | 30 | 0.8% |
| Symptoms n (%) | ||||||||||||||||||||||||
| Cough | 42 | 11.5% | 29 | 8.3% | 32 | 9.4% | 38 | 13.0% | 40 | 9.1% | 44 | 12.5% | 38* | 8.1% | 19 | 14.0% | 50* | 13.7% | 40* | 14.8% | 37 | 8.8% | 409 | 10.8% |
| Sputum | 34 | 9.3% | 29 | 8.3% | 22* | 6.5% | 29 | 9.9% | 37 | 8.4% | 43 | 12.2% | 37 | 7.9% | 13 | 9.7% | 54* | 14.8% | 38* | 14.1% | 36 | 8.6% | 372 | 9.8% |
| Dyspnoea | 28 | 7.7% | 45* | 12.9% | 30 | 8.8% | 32 | 11.0% | 32* | 7.3% | 34 | 9.6% | 34* | 7.2% | 14 | 10.4% | 52* | 14.3% | 55* | 20.4% | 19* | 4.5% | 375 | 9.9% |
| Wheezing | 162* | 44.3% | 120 | 34.6% | 174* | 51.3% | 100 | 34.2% | 144 | 32.9% | 137 | 38.8% | 206* | 43.8% | 35* | 25.7% | 112* | 30.5% | 103 | 38.1% | 72* | 17.2% | 1365 | 36.0% |
| Asthma, n (%) | 37* | 10.1% | 24 | 6.9% | 26 | 7.7% | 26 | 8.9% | 27 | 6.2% | 18 | 5.1% | 22* | 4.7% | 14 | 10.4% | 31 | 8.5% | 18 | 6.7% | 27 | 6.5% | 270 | 7.1% |
| BD Test +, n (%) | 12* | 3.3% | 16 | 4.6% | 11* | 3.2% | 13 | 4.5% | 57* | 13.0% | 13 | 3.7% | 24 | 5.1% | 9 | 6.6% | 32 | 8.7% | 17 | 6.3% | 15 | 3.6% | 219 | 5.8% |
| Predicted FEV,%, m±SD | 105,7* | 20.3 | 104,4* | 18.5 | 102.2 | 19.4 | 101.9 | 18.4 | 103.2 | 22.3 | 106,7* | 18.2 | 97,5* | 18.1 | 104.1 | 17.5 | 100,0* | 17.9 | 96,1* | 20.0 | 102.7 | 18.0 | 102.1 | 19.3 |
| Predicted FVC%, m±SD | 102,6* | 15.6 | 97.5 | 15.7 | 98.3 | 15.6 | 96.5 | 15.7 | 95.8 | 19.0 | 100,5* | 15.1 | 91,6* | 15.2 | 101,0* | 14.4 | 93,0* | 15.0 | 94,1* | 17.5 | 97.7 | 15.4 | 96.8 | 16.3 |
| FEVJFVC, m±SD | 0,77* | 0.09 | 0.80 | 0.07 | 0,78* | 0.08 | 0.79 | 0.07 | 0,80* | 0.07 | 0.79 | 0.07 | 0.79 | 0.07 | 0,76* | 0.08 | 0.80 | 0.07 | 0,76* | 0.08 | 0,78* | 0.07 | 0.79 | 0.08 |
| Prevalence COPD GOLD, n (%) | 50* | 13.7% | 29 | 8.3% | 42 | 12.4% | 29 | 9.9% | 27* | 6.2% | 29 | 8.2% | 38 | 8.1% | 23* | 16.9% | 33 | 9.0% | 40* | 14.8% | 46 | 11.0% | 386 | 10.2% |
| Prevalence COPD LLN, n (%) | 37* | 10.1% | 18 | 5.2% | 25 | 7.4% | 15 | 5.1% | 14* | 3.2% | 14 | 4.0% | 19 | 4.0% | 8 | 5.9% | 18 | 4.9% | 23* | 8.5% | 23 | 5.5% | 214 | 5.6% |
NOTE: Mean and standard deviation, except when stated.
BD indicates bronchodilator; BMI, body mass index; DK/NA, do not know/no answer; GOLD, Global Initiative for Obstructive Lung Disease; LLN, lower limit of normal; M, Madrid; SD, standard deviation.
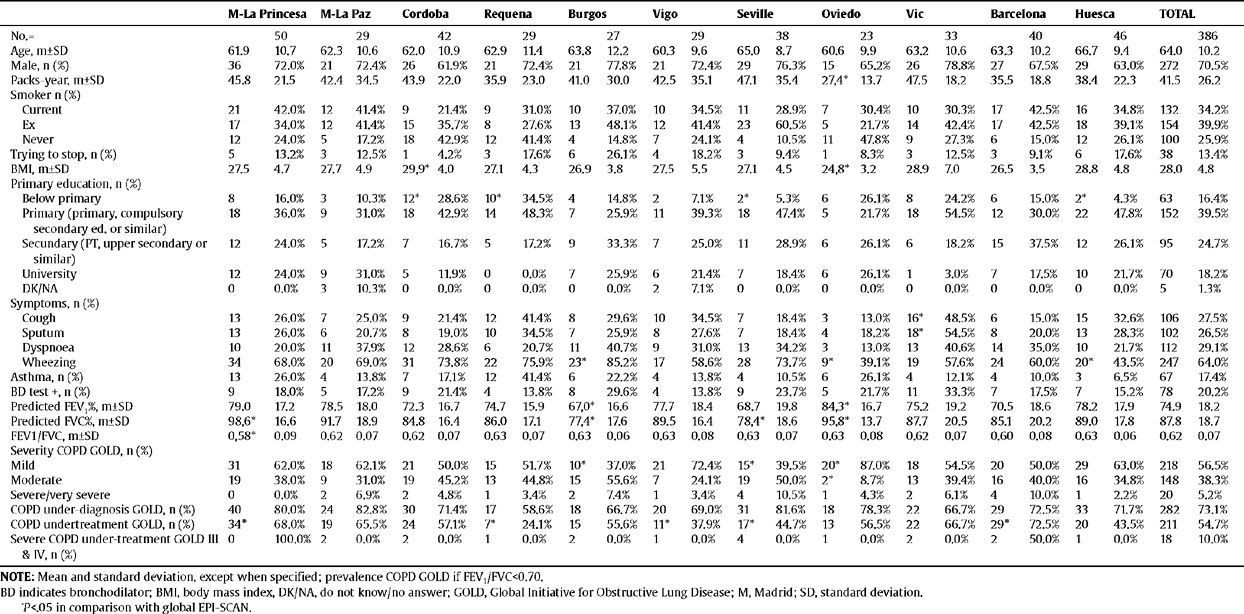
Characteristics of the individuals with COPD (according to GOLD) in the EPI-SCAN study, by areas
| M-La Princesa | M-La Paz | Cordoba | Requena | Burgos | Vigo | Seville | Oviedo | Vic | Barcelona | Huesca | TOTAL | |||||||||||||
| No.= | 50 | 29 | 42 | 29 | 27 | 29 | 38 | 23 | 33 | 40 | 46 | 386 | ||||||||||||
| Age, m±SD | 61.9 | 10.7 | 62.3 | 10.6 | 62.0 | 10.9 | 62.9 | 11.4 | 63.8 | 12.2 | 60.3 | 9.6 | 65.0 | 8.7 | 60.6 | 9.9 | 63.2 | 10.6 | 63.3 | 10.2 | 66.7 | 9.4 | 64.0 | 10.2 |
| Male, n (%) | 36 | 72.0% | 21 | 72.4% | 26 | 61.9% | 21 | 72.4% | 21 | 77.8% | 21 | 72.4% | 29 | 76.3% | 15 | 65.2% | 26 | 78.8% | 27 | 67.5% | 29 | 63.0% | 272 | 70.5% |
| Packs-year, m±SD | 45.8 | 21.5 | 42.4 | 34.5 | 43.9 | 22.0 | 35.9 | 23.0 | 41.0 | 30.0 | 42.5 | 35.1 | 47.1 | 35.4 | 27,4* | 13.7 | 47.5 | 18.2 | 35.5 | 18.8 | 38.4 | 22.3 | 41.5 | 26.2 |
| Smoker n (%) | ||||||||||||||||||||||||
| Current | 21 | 42.0% | 12 | 41.4% | 9 | 21.4% | 9 | 31.0% | 10 | 37.0% | 10 | 34.5% | 11 | 28.9% | 7 | 30.4% | 10 | 30.3% | 17 | 42.5% | 16 | 34.8% | 132 | 34.2% |
| Ex | 17 | 34.0% | 12 | 41.4% | 15 | 35.7% | 8 | 27.6% | 13 | 48.1% | 12 | 41.4% | 23 | 60.5% | 5 | 21.7% | 14 | 42.4% | 17 | 42.5% | 18 | 39.1% | 154 | 39.9% |
| Never | 12 | 24.0% | 5 | 17.2% | 18 | 42.9% | 12 | 41.4% | 4 | 14.8% | 7 | 24.1% | 4 | 10.5% | 11 | 47.8% | 9 | 27.3% | 6 | 15.0% | 12 | 26.1% | 100 | 25.9% |
| Trying to stop, n (%) | 5 | 13.2% | 3 | 12.5% | 1 | 4.2% | 3 | 17.6% | 6 | 26.1% | 4 | 18.2% | 3 | 9.4% | 1 | 8.3% | 3 | 12.5% | 3 | 9.1% | 6 | 17.6% | 38 | 13.4% |
| BMI, m±SD | 27.5 | 4.7 | 27.7 | 4.9 | 29,9* | 4.0 | 27.1 | 4.3 | 26.9 | 3.8 | 27.5 | 5.5 | 27.1 | 4.5 | 24,8* | 3.2 | 28.9 | 7.0 | 26.5 | 3.5 | 28.8 | 4.8 | 28.0 | 4.8 |
| Primary education, n (%) | ||||||||||||||||||||||||
| Below primary | 8 | 16.0% | 3 | 10.3% | 12* | 28.6% | 10* | 34.5% | 4 | 14.8% | 2 | 7.1% | 2* | 5.3% | 6 | 26.1% | 8 | 24.2% | 6 | 15.0% | 2* | 4.3% | 63 | 16.4% |
| Primary (primary, compulsory secondary ed. or similar) | 18 | 36.0% | 9 | 31.0% | 18 | 42.9% | 14 | 48.3% | 7 | 25.9% | 11 | 39.3% | 18 | 47.4% | 5 | 21.7% | 18 | 54.5% | 12 | 30.0% | 22 | 47.8% | 152 | 39.5% |
| Secundary (PT, upper secondary or similar) | 12 | 24.0% | 5 | 17.2% | 7 | 16.7% | 5 | 17.2% | 9 | 33.3% | 7 | 25.0% | 11 | 28.9% | 6 | 26.1% | 6 | 18.2% | 15 | 37.5% | 12 | 26.1% | 95 | 24.7% |
| University | 12 | 24.0% | 9 | 31.0% | 5 | 11.9% | 0 | 0.0% | 7 | 25.9% | 6 | 21.4% | 7 | 18.4% | 6 | 26.1% | 1 | 3.0% | 7 | 17.5% | 10 | 21.7% | 70 | 18.2% |
| DK/NA | 0 | 0.0% | 3 | 10.3% | 0 | 0.0% | 0 | 0.0% | 0 | 0.0% | 2 | 7.1% | 0 | 0.0% | 0 | 0.0% | 0 | 0.0% | 0 | 0.0% | 0 | 0.0% | 5 | 1.3% |
| Symptoms, n (%) | ||||||||||||||||||||||||
| Cough | 13 | 26.0% | 7 | 25.0% | 9 | 21.4% | 12 | 41.4% | 8 | 29.6% | 10 | 34.5% | 7 | 18.4% | 3 | 13.0% | 16* | 48.5% | 6 | 15.0% | 15 | 32.6% | 106 | 27.5% |
| Sputum | 13 | 26.0% | 6 | 20.7% | 8 | 19.0% | 10 | 34.5% | 7 | 25.9% | 8 | 27.6% | 7 | 18.4% | 4 | 18.2% | 18* | 54.5% | 8 | 20.0% | 13 | 28.3% | 102 | 26.5% |
| Dyspnoea | 10 | 20.0% | 11 | 37.9% | 12 | 28.6% | 6 | 20.7% | 11 | 40.7% | 9 | 31.0% | 13 | 34.2% | 3 | 13.0% | 13 | 40.6% | 14 | 35.0% | 10 | 21.7% | 112 | 29.1% |
| Wheezing | 34 | 68.0% | 20 | 69.0% | 31 | 73.8% | 22 | 75.9% | 23* | 85.2% | 17 | 58.6% | 28 | 73.7% | 9* | 39.1% | 19 | 57.6% | 24 | 60.0% | 20* | 43.5% | 247 | 64.0% |
| Asthma, n (%) | 13 | 26.0% | 4 | 13.8% | 7 | 17.1% | 12 | 41.4% | 6 | 22.2% | 4 | 13.8% | 4 | 10.5% | 6 | 26.1% | 4 | 12.1% | 4 | 10.0% | 3 | 6.5% | 67 | 17.4% |
| BD test +, n (%) | 9 | 18.0% | 5 | 17.2% | 9 | 21.4% | 4 | 13.8% | 8 | 29.6% | 4 | 13.8% | 9 | 23.7% | 5 | 21.7% | 11 | 33.3% | 7 | 17.5% | 7 | 15.2% | 78 | 20.2% |
| Predicted FEV,%, m±SD | 79.0 | 17.2 | 78.5 | 18.0 | 72.3 | 16.7 | 74.7 | 15.9 | 67,0* | 16.6 | 77.7 | 18.4 | 68.7 | 19.8 | 84,3* | 16.7 | 75.2 | 19.2 | 70.5 | 18.6 | 78.2 | 17.9 | 74.9 | 18.2 |
| Predicted FVC%, m±SD | 98,6* | 16.6 | 91.7 | 18.9 | 84.8 | 16.4 | 86.0 | 17.1 | 77,4* | 17.6 | 89.5 | 16.4 | 78,4* | 18.6 | 95,8* | 13.7 | 87.7 | 20.5 | 85.1 | 20.2 | 89.0 | 17.8 | 87.8 | 18.7 |
| FEV1/FVC, m±SD | 0,58* | 0.09 | 0.62 | 0.07 | 0.62 | 0.07 | 0.63 | 0.07 | 0.63 | 0.06 | 0.63 | 0.08 | 0.63 | 0.07 | 0.63 | 0.08 | 0.62 | 0.07 | 0.60 | 0.08 | 0.63 | 0.06 | 0.62 | 0.07 |
| Severity COPD GOLD, n (%) | ||||||||||||||||||||||||
| Mild | 31 | 62.0% | 18 | 62.1% | 21 | 50.0% | 15 | 51.7% | 10* | 37.0% | 21 | 72.4% | 15* | 39.5% | 20* | 87.0% | 18 | 54.5% | 20 | 50.0% | 29 | 63.0% | 218 | 56.5% |
| Moderate | 19 | 38.0% | 9 | 31.0% | 19 | 45.2% | 13 | 44.8% | 15 | 55.6% | 7 | 24.1% | 19 | 50.0% | 2* | 8.7% | 13 | 39.4% | 16 | 40.0% | 16 | 34.8% | 148 | 38.3% |
| Severe/very severe | 0 | 0.0% | 2 | 6.9% | 2 | 4.8% | 1 | 3.4% | 2 | 7.4% | 1 | 3.4% | 4 | 10.5% | 1 | 4.3% | 2 | 6.1% | 4 | 10.0% | 1 | 2.2% | 20 | 5.2% |
| COPD under-diagnosis GOLD, n (%) | 40 | 80.0% | 24 | 82.8% | 30 | 71.4% | 17 | 58.6% | 18 | 66.7% | 20 | 69.0% | 31 | 81.6% | 18 | 78.3% | 22 | 66.7% | 29 | 72.5% | 33 | 71.7% | 282 | 73.1% |
| COPD undertreatment GOLD, n (%) | 34* | 68.0% | 19 | 65.5% | 24 | 57.1% | 7* | 24.1% | 15 | 55.6% | 11* | 37.9% | 17* | 44.7% | 13 | 56.5% | 22 | 66.7% | 29* | 72.5% | 20 | 43.5% | 211 | 54.7% |
| Severe COPD undertreatment GOLD III & IV, n (%) | 0 | 100.0% | 2 | 0.0% | 2 | 0.0% | 1 | 0.0% | 2 | 0.0% | 1 | 0.0% | 4 | 0.0% | 1 | 0.0% | 2 | 0.0% | 2 | 50.0% | 1 | 0.0% | 18 | 10.0% |
NOTE: Mean and standard deviation, except when specified; prevalence COPD GOLD if FEV1/FVC<0.70.
BD indicates bronchodilator; BMI, body mass index, DK/NA, do not know/no answer; GOLD, Global Initiative for Obstructive Lung Disease; M, Madrid; SD, standard deviation.
Of a total of 4,274 subjects contacted randomly by telephone in the 11 centres, 3,885 (90.9%) agreed to participate in the study and in the end a sample of 3,802 (88.9%) was available for analysis (minimum set of data about sex, age and lung function). As reported previously,3 the 389 (9.1%) individuals who refused to participate in the survey were slightly older and usually women, most being never-smokers and ex-smokers. The sociodemographic and clinical characteristics of the 3,802 participants by area in the EPI-SCAN study are shown in table 1. There were no differences by areas in the distribution by age, sex or packs-year, although there were significant differences by smoking status, body mass index (BMI) or educational level in some areas compared to the total (P<.05).
The prevalence of COPD according to the GOLD criteria was 10.2% (CI 95%, 9.2–11.1) and 5.6% (CI 95%, 4.9–6.4) according to the LLN criteria. The ratio of the prevalence of COPD according to the GOLD criteria among the EPI-SCAN areas was 2.7, with a peak in Asturias (16.9%) and a minimum in Burgos (6.2%) (P<.05) (table 1); likewise, the ratio of prevalences using the LLN criteria was 3.1, but with a peak in Madrid-La Princesa (10.1%) and a minimum in Burgos (3.2%) (P<.05).
Table 2 shows the characteristics of the individuals with COPD (according to GOLD) from the EPI-SCAN study. Again, there are subtle, but smaller, differences by areas in comparison with the total. Thus, with regard to the overall figures, the patients with COPD in Oviedo had a lower packs-year mean, in Cordoba and Oviedo they had a lower BMI, and differences remained in the educational level (P<.05). It is worth highlighting that the variations in the severity of COPD (fig. 1), under-diagnosis (58.6% to 72.8%) and under-treatment by areas (24.1% to 72.5%) were significant (P<.05). In contrast, it can be seen that the age and sex of the individuals with COPD is almost identical in all areas, and that the variations in height, weight, BMI and educational level are minimal. The variations in the distribution of smokers and ex-smokers are also small among both the participating sample of the population (table 1) and among those with airflow obstruction compatible with COPD (table 2).

Of the participants, 5.8% had a positive bronchodilator test, as did 20.2% of those with COPD. As can be seen in tables 1 and 2, there were wide and inconsistent variations by area in the positive bronchodilator tests. Looking at the total number of participants, there was a four-fold difference in positive bronchodilator tests between the highest number in Vigo (13%) and the lowest in Cordoba (3.2%) (table 1). However, among those with COPD the difference is only 2.1-fold between the maximum in Vigo (29.6%) and the minimum in Burgos (13.8%) (table 2).
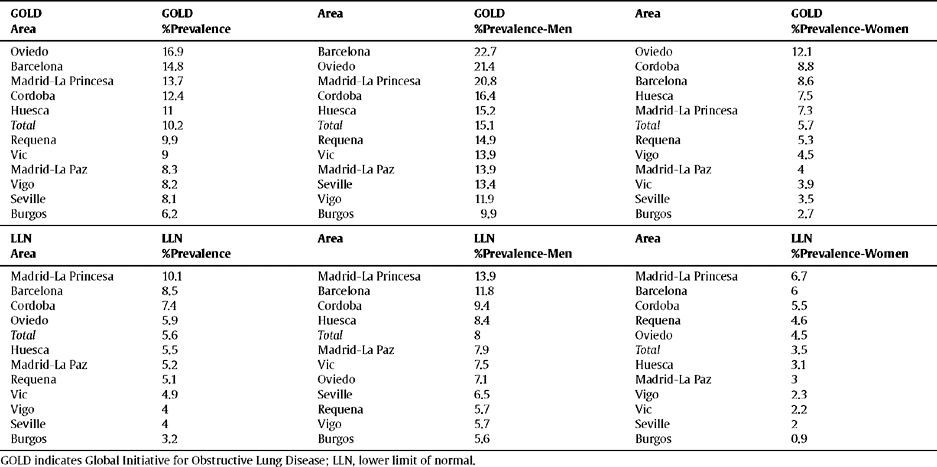
The order of the prevalence of COPD by area did not remain the same in each area with regard to sex and age (table 3 and fig. 2) with either of the definitions used, except Burgos, which was consistently the area with the lowest prevalence of COPD, when using both the GOLD and LLN criteria, and for both sexes.
Ranking of the prevalence of COPD by area according to the GOLD and LLN criteria, total and sex
| GOLD Area | GOLD %Prevalence | Area | GOLD %Prevalence-Men | Area | GOLD %Prevalence-Women |
| Oviedo | 16.9 | Barcelona | 22.7 | Oviedo | 12.1 |
| Barcelona | 14.8 | Oviedo | 21.4 | Cordoba | 8.8 |
| Madrid-La Princesa | 13.7 | Madrid-La Princesa | 20.8 | Barcelona | 8.6 |
| Cordoba | 12.4 | Cordoba | 16.4 | Huesca | 7.5 |
| Huesca | 11 | Huesca | 15.2 | Madrid-La Princesa | 7.3 |
| Total | 10.2 | Total | 15.1 | Total | 5.7 |
| Requena | 9.9 | Requena | 14.9 | Requena | 5.3 |
| Vic | 9 | Vic | 13.9 | Vigo | 4.5 |
| Madrid-La Paz | 8.3 | Madrid-La Paz | 13.9 | Madrid-La Paz | 4 |
| Vigo | 8.2 | Seville | 13.4 | Vic | 3.9 |
| Seville | 8.1 | Vigo | 11.9 | Seville | 3.5 |
| Burgos | 6.2 | Burgos | 9.9 | Burgos | 2.7 |
| LLN Area | LLN %Prevalence | Area | LLN %Prevalence-Men | Area | LLN %Prevalence-Women |
| Madrid-La Princesa | 10.1 | Madrid-La Princesa | 13.9 | Madrid-La Princesa | 6.7 |
| Barcelona | 8.5 | Barcelona | 11.8 | Barcelona | 6 |
| Cordoba | 7.4 | Cordoba | 9.4 | Cordoba | 5.5 |
| Oviedo | 5.9 | Huesca | 8.4 | Requena | 4.6 |
| Total | 5.6 | Total | 8 | Oviedo | 4.5 |
| Huesca | 5.5 | Madrid-La Paz | 7.9 | Total | 3.5 |
| Madrid-La Paz | 5.2 | Vic | 7.5 | Huesca | 3.1 |
| Requena | 5.1 | Oviedo | 7.1 | Madrid-La Paz | 3 |
| Vic | 4.9 | Seville | 6.5 | Vigo | 2.3 |
| Vigo | 4 | Requena | 5.7 | Vic | 2.2 |
| Seville | 4 | Vigo | 5.7 | Seville | 2 |
| Burgos | 3.2 | Burgos | 5.6 | Burgos | 0.9 |
GOLD indicates Global Initiative for Obstructive Lung Disease; LLN, lower limit of normal.
 by areas, total and sex. GOLD indicates Global Initiative for Obstructive Lung Disease.")
This is why it is interesting to observe that the accumulated exposure to tobacco, measured by packs-year [Spearman's correlation ?0.305 in men P=.336 and 0.210 in women P=.513] (fig. 3), does not greatly explain the geographical variations in the prevalence of COPD. Neither is a correlation observed between the prevalence in each area and the mortality rates published by the autonomous communities, with a Spearman's coefficient of 0.193 in men, P=.547 and 0.190 in women, P=.555 (fig. 4).
 with regard to packs-year for the area (X axis), [Spearman")
 with regard to adjusted mortality rate in the autonomous community (Strategy) (X axis) [Spearman")
This study describes important geographical variations in the current distribution of the prevalence of COPD in Spain, this being 2 or 3-fold higher in certain areas. The lack of homogeneity in the distribution of COPD in the population, both nationally and internationally, has already been described by other authors, the same occurring with asthma. However, among the novel contributions of this article is that it determines that the geographical differences in the prevalence of COPD vary for men and women, and also depend on the spirometry definition used. Furthermore there is a total lack of consistency in the data, and the individual accumulated exposure to tobacco measured by packs-year can not account for this variation by itself. No relationship was found either with the registered mortality from COPD in an ecological analysis. In a free and universal health system like the one in Spain, it is interesting to observe that there were also important variations in under-diagnosis and under-treatment which could not be explained by these factors.
LimitationsThis sub-analysis of the EPI-SCAN study has a series of limitations to be considered. The variation observed refers to the 11 participating areas, which can not claim to represent Spain as a whole, as the recruitment of centres and researchers was performed by convenience sampling. It is possible that areas exist which were not part of the sample with more extreme prevalences of COPD, so the true range in Spain may be even higher than the 2.4 or 2.7 observed. Although the overall response rate for the study was very satisfactory (89.1%), there may be a differential response rate within each area, generating an information bias which is difficult to interpret. The sample size of the EPI-SCAN study was chosen based on the expected overall national prevalence, and although the a posteriori statistical power calculation is reasonable, the confidence intervals are shown for most of the estimators by area, since the small (and varied) sample in each geographical area implies less accuracy. Variations in confusing variables and determining factors for COPD and other chronic diseases, as well as the different distribution of variables, such as age, sex, smoking or pollution, among others, may be biased, but hopefully producing a non-differential error. The asthma phenotype may be an additional confusing factor in explaining the variation in the prevalence of COPD in the 11 areas participating in the EPI-SCAN. Wheezing is known to be a symptom which is not exclusive to asthma, occurring frequently in COPD.10,11 Therefore, nearly two-thirds of the participants in the EPI-SCAN study with airway obstruction compatible with COPD (64%) present wheezing at some time, although there are important variations by area (table 2). In any case, the prevalences of a positive bronchodilator response found in all the areas are lower than the 53.9% described in clinical patients with a previous diagnosis of COPD included in a recent multi-national assay.18 Likewise, 7.1% of the participants, and 17.4% of those with COPD, claimed to suffer/have suffered from asthma, which are again reasonable results in accordance with the ECRHS study, the European Asthma Study in Spain, and others, there being huge variations by area once again and inconsistent results. Thus, it is important to highlight the lack of consistency in the distribution by areas among the respective frequencies of wheezing, self-declared asthma and bronchodilator tests, and that although it is essential for them to be assessed clinically on an individual basis, on a population level the current definitions of COPD are based only on a diagnosis using spirometry.
The differences found in the prevalence of COPD between centres in the same autonomous community must also be highlighted, for example when comparing Hospital de La Princesa and Hospital La Paz in Madrid, or Barcelona and Vic in Catalonia. This may be due to variations in structures of sex, age, tobacco smoking, and asthma or to other variables which were not studied, such as urban or rural habitats, environmental exposure, work or others. Lastly, although mortality data exists for small areas in some communities, this is an ecological comparison with mortality rates for autonomous communities, and it probably includes many confusing factors which were not studied.
Summary of Published LiteratureAs mentioned above, although there are other isolated studies in Spain which are summarized in other sources,9,19 the IBERPOC study is the only previous one to have determined geographical variations in Spain. The IBERPOC study in 1997 described important geographical variations in the prevalence of COPD among the 7 participating areas (Burgos, Caceres, Madrid, Manlleu, Oviedo, Seville and Biscay),4 from only 4,9% in Caceres to 18% in Manlleu. That is a 3.7-fold interval, possibly related to environmental or occupational factors which were not studied. There is probably little sense in posing a new hypothesis about possible influences attributable to differences in smoking habits, environmental and diagnostic factors, or coding, or also that biological or genetic differences may exist in the risk of COPD by area in Spain.4 It is possible and likely that variations in the distribution of chronic diseases in the population are partly explained by known factors or others still to be discovered, but there seem to be real variations. For example, the variation in the distribution of COPD in the five Latin American cities participating in the PLATINO study has been related to their height above sea level.10 Unlike in other diseases,20 the literature about respiratory diseases is poor with regard to variations in lung function in small areas, with studies focusing almost exclusively on environmental pollution.21 For example, a study in the USA has described that the risk of syncope recurrence of 9.4% shows high regional variation in all racial/ethnic subgroups and persists after adjusting for the individual characteristics of the patients.22 The development of new statistical methods, already applied in mortality from COPD in the United Kingdom, will undoubtedly be welcomed.23 In Denmark, the use of home oxygen therapy (HOT) for COPD ranges between 14 and 53 per 100,000 inhabitants in its 16 counties, and its use was higher in the counties where the general practitioners prescribe it. Adherence to national guidelines for HOT was 34.4% for the whole of Denmark, but varied regionally between 14% and 63%. Probably, projects under way such as the first clinical audit of COPD to be performed in Spain (AUDIPOC)24 or the ratification of healthcare quality standards for COPD (VESALIO),25 and other future studies, will make it possible to determine the heterogeneous distribution of COPD and its determining factors in Spain.
In highly under-diagnosed diseases, such as COPD, the so-called “iceberg phenomenon” can occur; this is a metaphor emphasizing that every known case of the disease is outweighed by those that remain undiscovered. COPD is associated with significant under-diagnosis and wrong diagnosis, and consequently with under-treatment or wrong treatment.26 The iceberg phenomenon often frustrates attempts to assess the burden of the disease, as happens with other chronic diseases. It also makes it more difficult to determine the needs of the health services, and to select representative cases for study and inclusion in clinical assays. This leads to what has been called the “clinical fallacy”, which is a mistaken view of the nature and causes of a disease because of the results of the study of a small number of patients receiving medical treatment. Only a population-based focus can overcome the “clinical fallacy” of our current knowledge of the distribution and natural history of COPD.
ConclusionsThere are significant variations in the distribution of COPD in Spain, both in its prevalence and its under-diagnosis and undertreatment. Confirming these variations and investigating the causes of this heterogeneity must enable not only a more sensible distribution of healthcare resources, but also the setting up of educational and corrective initiatives to reduce the effects of tobacco and other factors responsible for COPD.
AcknowledgementsThe sponsor of the EPI-SCAN study is GlaxoSmithKline S.A. We would like to acknowledge the hard work of all the researchers and collaborators in each centre, and thank the participants for their voluntary, unselfish collaboration.
EPI-SCAN Scientific CommitteeJulio Ancochea, La Princesa Hospital (Madrid, Spain)
Guadalupe Sánchez, Medical Department, GlaxoSmithkline S.A. (Madrid, Spain)
Enric Duran-Tauleria, Municipal Institute of Medical research (IMIM) (Barcelona, Spain)
Francisco García Río, La Paz Hospital (Madrid, Spain)
Marc Miravitlles, Hospital Clinic of Barcelona, Spain
Luis Muñoz, Reina Sofía Hospital (Cordoba, Spain)
Víctor Sobradillo-Peña, Cruces Hospital (Bilbao, Spain)
Joan B Soriano, Caubet-CIMERA Foundation, Balearic Islands (Majorca, Spain)
EPI-SCAN Principal ResearchersJulio Ancochea, La Princesa Hospital (Madrid, Spain)
Luis Borderías, San Jorge Hospital (Huesca, Spain)
Francisco García Río, La Paz Hospital (Madrid, Spain)
Jaime Martínez, Asturias Central Hospital (Oviedo, Spain)
Teodoro Montemayor, Virgen de la Macarena Hospital (Seville, Spain)
Luis Muñoz, Reina Sofía Hospital (Cordoba, Spain)
Luis Piñeiro, Xeral Cies Hospital (Vigo, Spain)
Joan Serra, Vic General Hospital (Vic, Barcelona, Spain)
Juan José Soler-Cataluña, Requena General Hospital (Requena, Valencia, Spain)
Antoni Torres, Hospital Clinic (Barcelona, Spain)
Jose Luis Viejo, Yagüe General Hospital (Burgos, Spain)


