


Ventilatory inefficiency (high V′E/V′CO2) and resting hypocapnia are common in pulmonary vascular disease and are associated with poor prognosis. Low resting PaCO2 suggests increased chemosensitivity or an altered PaCO2 set-point. We aimed to determine the relationships between exercise gas exchange variables reflecting the PaCO2 set-point, exercise capacity, hemodynamics and V′E/V′CO2.
MethodsPulmonary arterial hypertension (n=34), chronic thromboembolic pulmonary hypertension (CTEPH, n=19) and pulmonary veno-occlusive disease (PVOD, n=6) patients underwent rest and peak exercise arterial blood gas measurements during cardiopulmonary exercise testing. Patients were grouped according to resting PaCO2: hypocapnic (PaCO2 ≤34mmHg) or normocapnic (PaCO2 35–45mmHg). The PaCO2 set-point was estimated by the maximal value of end-tidal PCO2 (maximal PETCO2) between the anaerobic threshold and respiratory compensation point.
ResultsThe hypocapnic group (n=39) had lower resting cardiac index (3.1±0.8 vs. 3.7±0.7L/min/m2, p<0.01), lower peak V′O2 (15.8±3.5 vs. 20.7±4.3mL/kg/min, p<0.01), and higher V′E/V′CO2 slope (60.6±17.6 vs. 38.2±8.0, p<0.01). At peak exercise, hypocapic patients had lower PaO2, higher VD/VT and higher P(a-ET)CO2. Maximal PETCO2 (r=0.59) and VD/VT (r=−0.59) were more related to cardiac index than PaO2 or PaCO2 at rest or peak exercise. Maximal PETCO2 was the strongest correlate of V′E/V′CO2 slope (r=−0.86), peak V′O2 (r=0.64) and peak work rate (r=0.49).
ConclusionsResting hypocapnia is associated with worse cardiac function, more ventilatory inefficiency and reduced exercise capacity. This could be explained by elevated chemosensitivity and lower PaCO2 set-point. Maximal PETCO2 may be a useful non-invasive marker of PaCO2 setpoint and disease severity even with submaximal effort.
La ineficiencia ventilatoria (V’E/V’CO2 alta) y la hipocapnia en reposo son comunes en la enfermedad vascular pulmonar y se asocian con un mal pronóstico. La PaCO2 baja en reposo sugiere una mayor quimiosensibilidad o una alteración en el ajuste fisiológico de la PaCO2. Nuestro objetivo fue determinar las relaciones entre las variables de intercambio de gases que reflejan el ajuste de la PaCO2 durante el ejercicio, la capacidad de ejercicio, la hemodinámica y la V’E/V’CO2.
MétodosSe realizaron mediciones de gases en sangre arterial durante las pruebas de ejercicio cardiopulmonar a pacientes con hipertensión arterial pulmonar (n=34), hipertensión pulmonar tromboembólica crónica (HPTEC, n=19) y enfermedad venooclusiva pulmonar (EVOP, n=6). Los pacientes se agruparon de acuerdo con su PaCO2 en reposo: hipocapnia (PaCO2 ≤34mmHg) o normocapnia (PaCO2 35–45mmHg). El ajuste de la PaCO2 se estimó mediante el valor máximo de PCO2 exhalado (PETCO2 máximo) entre el umbral anaeróbico y el punto de compensación respiratoria.
ResultadosEl grupo hipocápnico (n=39) tenía un índice cardíaco en reposo más bajo (3,1±0,8 vs. 3,7±0,7L/min/m2, p<0,01), un pico de V’O2 más bajo (15,8±3,5 vs 20,7±4,3mL/kg/min, p<0,01), y mayor pendiente de V’E/V’CO2 (60,6±17,6 vs. 38,2±8,0, p<0,01). En el punto de ejercicio máximo, los pacientes hipocápnicos tenían una PaO2 más baja, un VD/VT más alto y una P(a-ET) CO2 más alta. La PETCO2 máxima (r=0,59) y la VD/VT (r=-0,59) estaban más relacionadas con el índice cardíaco que la PaO2 o la PaCO2 en reposo o en el punto de máximo esfuerzo. La PETCO2 máxima fue la que mayor correlación tuvo con la pendiente V’E/V’CO2 (r=-0,86), la V’O2 máxima (r=0.64) y la tasa de esfuerzo máximo (r=0,49).
ConclusionesLa hipocapnia en reposo se asocia a una peor función cardíaca, una mayor ineficiencia ventilatoria y una capacidad disminuída de ejercicio. Esto podría explicarse por una quimiosensibilidad elevada y un ajuste fisiológico más bajo de la PaCO2. La PETCO2 máxima puede ser un marcador no invasivo útil del ajuste de PaCO2 y la gravedad de la enfermedad incluso con un esfuerzo submáximo.
The main determinants of the exercise ventilatory response (V′E) are the pulmonary carbon dioxide (CO2) output (V′CO2), the arterial partial pressure of CO2 (PaCO2), the dead space fraction of each tidal breath (VD/VT) and the extent to which the ventilatory system is constrained by abnormal respiratory mechanics.1 An indicator of the efficiency of exercise V′E is the steepness with which V′E rises with respect to VCO2, i.e., the V′E/V′CO2 slope. Pulmonary vascular disease patients often hyperventilate at rest and during exercise,1 and ventilatory inefficiency (high V′E/V′CO2) is a hallmark that predicts higher mortality independent from other exercise-related prognostic factors such as peak oxygen uptake (VO2).2–6 The V′E/V′CO2 slope is fundamentally determined by two factors: (1) the tidal volume (VT) fraction going to dead space (VD), (i.e., the VD/VT); and (2) the direction and magnitude of change in the PaCO2 during exercise.
A low resting PaCO2 predicts a worse prognosis in pulmonary arterial hypertension (PAH).7 However, high VD/VT does not cause low resting PaCO2, therefore an altered PaCO2 set-point, increased neural respiratory drive, and/or increased chemosensitivity must explain hypocapnia and consequently, the high V′E/V′CO2 slope. The PaCO2 set-point is influenced by factors such as metabolic acidosis, hypoxemia, baroreceptors in the pulmonary vasculature and sympathetic nervous system hyperactivity.8–13 The assessment of chemosensitivity and/or the PaCO2 set-point during exercise is not straightforward and can be problematic. Few studies have attempted to evaluate the PaCO2 set-point “non-invasively” by evaluating the maximal end-tidal CO2 pressure (maximal PETCO2) value between the anaerobic threshold (AT) and respiratory compensation point (RCP) where PETCO2 is constant and, therefore, is supposed to truly reflect the real PaCO2 set-point.14–17
The aim of the study was to test the relationships between gas exchange variables that reflect high chemosensitivity and/or the PaCO2 set-point, exercise capacity and markers of disease severity in pulmonary vascular disease patients according to the presence of resting hypocapnia (PaCO2 ≤ 34mmHg) or normocapnia (PaCO2=35–45mmHg).
MethodsThis retrospective study complied with the Declaration of Helsinki. Although French law does not require ethics committee approval or informed consent for retrospective data collection, the data collected were anonymized and complied according to the requirements of the Commission Nationale Informatique et Liberté (CNIL), the organization dedicated to privacy, information technology and civil rights in France.
Study populationWe reviewed patients>18 years of age with PAH, chronic thromboembolic pulmonary hypertension (CTEPH), or pulmonary veno-occlusive disease (PVOD) who underwent cardiopulmonary exercise testing (CPET) with arterial blood gas (ABG) sampling at rest and maximal exercise at our institution between 2010 and 2016. All patients were diagnosed according to current guidelines with right heart catheterization. Patients were prevalent, treated with PAH therapies with clinical stability during the preceding 3 months and in New York Heart Association (NYHA) function class I–III. Patients with a history of smoking, forced expiratory volume in 1-second to forced vital capacity (FEV1/FVC) ratio <0.7, and those without peak exercise ABG measurements were excluded.
CPET testingSpirometry, single breath DLCO and static lung volumes were performed on the same day prior to CPET. All patients underwent a symptom-limited incremental cycle ergometer CPET and were encouraged to continue until exhaustion. Arterial blood gas (ABG) measurements were obtained via a radial artery puncture at rest before and at peak exercise, while still pedaling. Pulmonary function tests were performed using automated equipment (Masterscreen MS Body and Diffusion, tyb B/IEC 601-1/IP20, Jaeger, Germany). Symptom-limited incremental CPETs were conducted on an electrically braked cycle ergometer (Ergoline 100P mitBD; Medisoft, Sorinnes, Belgium) with a cardiopulmonary exercise testing system (Ergocard model E, Medisoft, Sorinnes, Belgium). Breath-by-breath cardiopulmonary and metabolic data were collected at baseline and throughout exercise while subjects breathed through a mouthpiece with nasal passages occluded by a nose-clip. Exercise variables were measured and averaged over the last 20s of each minute and at peak exercise. Exercise variables were compared with predicted normal values .18 The AT was determined individually using the V-slope method.19 We estimated the CO2 set-point noninvasively from the highest value of end-tidal PCO2 (maximal PETCO2) observed between the AT and the RCP, when PETCO2 remains constant, as previously described (Fig. 1).14–17 In cases where the RCP was not clearly evident, the highest value occurring after AT was used. Ventilatory efficiency was obtained from the V′E/V′CO2 slope, which was determined for each patient using linear regression. The physiologic dead space (VD/VT) was calculated using the Enghoff modification of the Bohr equation20:
where VD=dead space volume, VT=tidal volume, PaCO2=arterial partial pressure of carbon dioxide and PECO2=mixed expired carbon dioxide partial pressure.Statistical analysis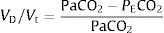
 observed between the anaerobic threshold (AT) and the respiratory compensation point (RCP), when PETCO2 remains constant.")
Patients were grouped according to resting PaCO2, defined as being hypocapnic (PaCO2 ≤ 34mmHg) or normocapnic (PaCO2=35–45mmHg). Continuous variables are expressed as mean±standard deviation or median with interquartile range (IQR25–75%) according to normality. The Shapiro–Wilk test was used to assess normality of data. Categorical variables are expressed as absolute and relative frequencies. Between-group comparisons were made using two-sample t-tests, Wilcoxon rank sum tests, and the chi-squared test, where appropriate. Relationships between V′E, VD/VT, arterial-to-end-tidal PCO2 difference (P(a-ET)CO2), maximal PETCO2, resting cardiac index (CI), and V′E/V′CO2 slope were assessed using linear regression. A p-value <0.05 was considered significant. Statistical analyses were performed using STATA (version 13.1, StataCorp, College Station, Texas, USA).
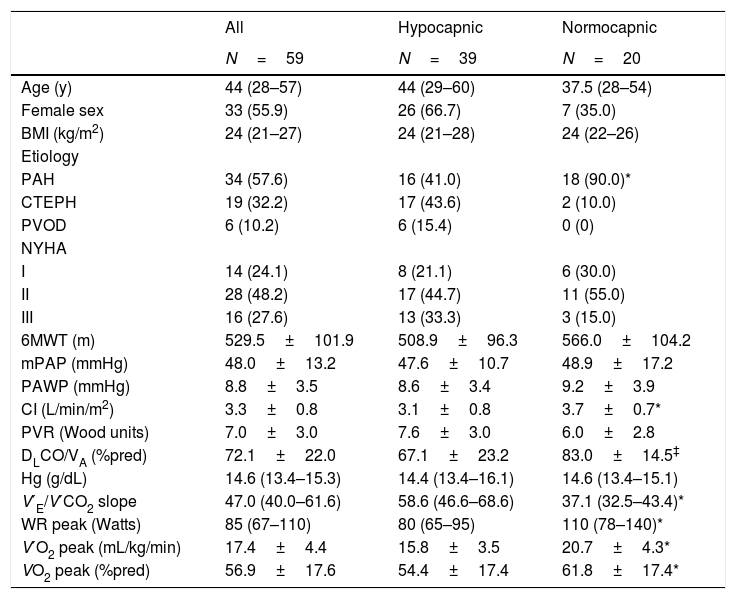
ResultsA total of 59 patients were included. Demographics, clinical and hemodynamic characteristics are shown in Table 1. Compared to normocapnic patients, a greater proportion of hypocapnic patients had CTEPH or PVOD as opposed to PAH, and both DLCO/VA and CI were lower in hypocapnic patients. Peak oxygen consumption (V′O2peak) was lower and V′E/V′CO2 was higher in hypocapnic patients. Characteristics and gas exchange variables according to etiology of pulmonary hypertension are shown in Online Supplemental Table 1.
Patient characteristics.
| All | Hypocapnic | Normocapnic | |
|---|---|---|---|
| N=59 | N=39 | N=20 | |
| Age (y) | 44 (28–57) | 44 (29–60) | 37.5 (28–54) |
| Female sex | 33 (55.9) | 26 (66.7) | 7 (35.0) |
| BMI (kg/m2) | 24 (21–27) | 24 (21–28) | 24 (22–26) |
| Etiology | |||
| PAH | 34 (57.6) | 16 (41.0) | 18 (90.0)* |
| CTEPH | 19 (32.2) | 17 (43.6) | 2 (10.0) |
| PVOD | 6 (10.2) | 6 (15.4) | 0 (0) |
| NYHA | |||
| I | 14 (24.1) | 8 (21.1) | 6 (30.0) |
| II | 28 (48.2) | 17 (44.7) | 11 (55.0) |
| III | 16 (27.6) | 13 (33.3) | 3 (15.0) |
| 6MWT (m) | 529.5±101.9 | 508.9±96.3 | 566.0±104.2 |
| mPAP (mmHg) | 48.0±13.2 | 47.6±10.7 | 48.9±17.2 |
| PAWP (mmHg) | 8.8±3.5 | 8.6±3.4 | 9.2±3.9 |
| CI (L/min/m2) | 3.3±0.8 | 3.1±0.8 | 3.7±0.7* |
| PVR (Wood units) | 7.0±3.0 | 7.6±3.0 | 6.0±2.8 |
| DLCO/VA (%pred) | 72.1±22.0 | 67.1±23.2 | 83.0±14.5‡ |
| Hg (g/dL) | 14.6 (13.4–15.3) | 14.4 (13.4–16.1) | 14.6 (13.4–15.1) |
| V′E/V′CO2 slope | 47.0 (40.0–61.6) | 58.6 (46.6–68.6) | 37.1 (32.5–43.4)* |
| WR peak (Watts) | 85 (67–110) | 80 (65–95) | 110 (78–140)* |
| V′O2 peak (mL/kg/min) | 17.4±4.4 | 15.8±3.5 | 20.7±4.3* |
| VO2 peak (%pred) | 56.9±17.6 | 54.4±17.4 | 61.8±17.4* |
BMI: body mass index; PAH: pulmonary arterial hypertension; CTEPH: chronic thromboembolic pulmonary hypertension; PVOD: pulmonary veno-occlusive disease; NYHA: New York Heart Association functional class; 6MWT: 6-minute walk test distance; mPAP: mean pulmonary arterial pressure; PAWP: pulmonary artery wedge pressure; CI: cardiac index; PVR: pulmonary vascular resistance; DLCO/VA: diffusion capacity for carbon monoxide adjusted for alveolar volume; Hg: hemoglobin; V′E/V′CO2: minute ventilation/carbon dioxide output; WR peak: work rate at peak exercise; V′O2 peak: oxygen consumption at peak exercise.
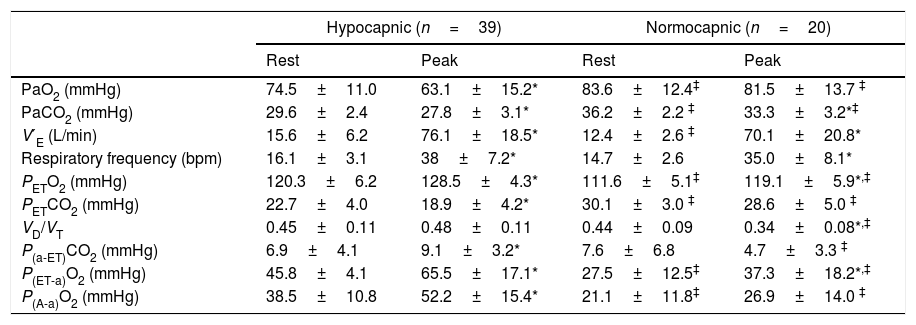
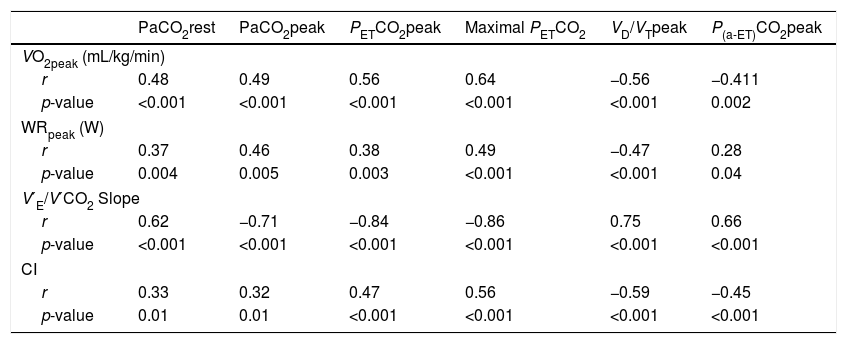
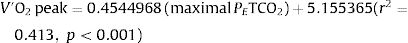
Gas exchange variables at rest and at peak exercise are shown in Table 2. In hypocapnic patients, peak VD/VT did not significantly change during exercise and P(a-ET)CO2 increased, whereas VD/VT and P[a-ET]CO2 both decreased from rest to peak exercise among the normocapnic patients (Online Supplemental Figure 1). The CO2 set-point, as estimated by the maximal PETCO2 between AT and the RCP, was significantly lower among hypocapnic patients (23.6±4.1 vs. 33.8±3.7mmHg, p<0.001). In the overall population, the CO2 set-point (maximal PETCO2) was the strongest correlate of V′O2peak, peak work rate (WRpeak) and V′E/V′CO2 slope (Table 3). V′O2peak (mL/kg/min) could be estimated from the maximal PETCO2 with the equation:
Gas Exchange variables at rest and peak exercise.
| Hypocapnic (n=39) | Normocapnic (n=20) | |||
|---|---|---|---|---|
| Rest | Peak | Rest | Peak | |
| PaO2 (mmHg) | 74.5±11.0 | 63.1±15.2* | 83.6±12.4‡ | 81.5±13.7 ‡ |
| PaCO2 (mmHg) | 29.6±2.4 | 27.8±3.1* | 36.2±2.2 ‡ | 33.3±3.2*‡ |
| V′E (L/min) | 15.6±6.2 | 76.1±18.5* | 12.4±2.6 ‡ | 70.1±20.8* |
| Respiratory frequency (bpm) | 16.1±3.1 | 38±7.2* | 14.7±2.6 | 35.0±8.1* |
| PETO2 (mmHg) | 120.3±6.2 | 128.5±4.3* | 111.6±5.1‡ | 119.1±5.9*,‡ |
| PETCO2 (mmHg) | 22.7±4.0 | 18.9±4.2* | 30.1±3.0 ‡ | 28.6±5.0 ‡ |
| VD/VT | 0.45±0.11 | 0.48±0.11 | 0.44±0.09 | 0.34±0.08*,‡ |
| P(a-ET)CO2 (mmHg) | 6.9±4.1 | 9.1±3.2* | 7.6±6.8 | 4.7±3.3 ‡ |
| P(ET-a)O2 (mmHg) | 45.8±4.1 | 65.5±17.1* | 27.5±12.5‡ | 37.3±18.2*,‡ |
| P(A-a)O2 (mmHg) | 38.5±10.8 | 52.2±15.4* | 21.1±11.8‡ | 26.9±14.0 ‡ |
V′E: minute ventilation; PETO2: end-tidal partial pressure of oxygen tension; PETCO2: end-tidal partial pressure of carbon dioxide; VD/VT: physiologic dead space fraction; P(a-ET)CO2: arterial-end-tidal PCO2 difference; P(ET-a)O2: end-tidal-arterial PO2 difference; P(A-a)O2: alveolar-arterial oxygen difference.
Correlations between exercise gas exchange variables, exercise capacity, ventilatory efficiency and cardiac index in the overall population (n=59).
| PaCO2rest | PaCO2peak | PETCO2peak | Maximal PETCO2 | VD/VTpeak | P(a-ET)CO2peak | |
|---|---|---|---|---|---|---|
| VO2peak (mL/kg/min) | ||||||
| r | 0.48 | 0.49 | 0.56 | 0.64 | −0.56 | −0.411 |
| p-value | <0.001 | <0.001 | <0.001 | <0.001 | <0.001 | 0.002 |
| WRpeak (W) | ||||||
| r | 0.37 | 0.46 | 0.38 | 0.49 | −0.47 | 0.28 |
| p-value | 0.004 | 0.005 | 0.003 | <0.001 | <0.001 | 0.04 |
| V′E/V′CO2 Slope | ||||||
| r | 0.62 | −0.71 | −0.84 | −0.86 | 0.75 | 0.66 |
| p-value | <0.001 | <0.001 | <0.001 | <0.001 | <0.001 | <0.001 |
| CI | ||||||
| r | 0.33 | 0.32 | 0.47 | 0.56 | −0.59 | −0.45 |
| p-value | 0.01 | 0.01 | <0.001 | <0.001 | <0.001 | <0.001 |
PETCO2: end-tidal partial pressure of carbon dioxide; VD/VT: physiologic dead space fraction; P(a-ET)CO2: arterial-end-tidal PCO2 difference; VO2: oxygen consumption; WR: work rate; V′E/V′CO2: minute ventilation/carbon dioxide output; CI: resting cardiac index.
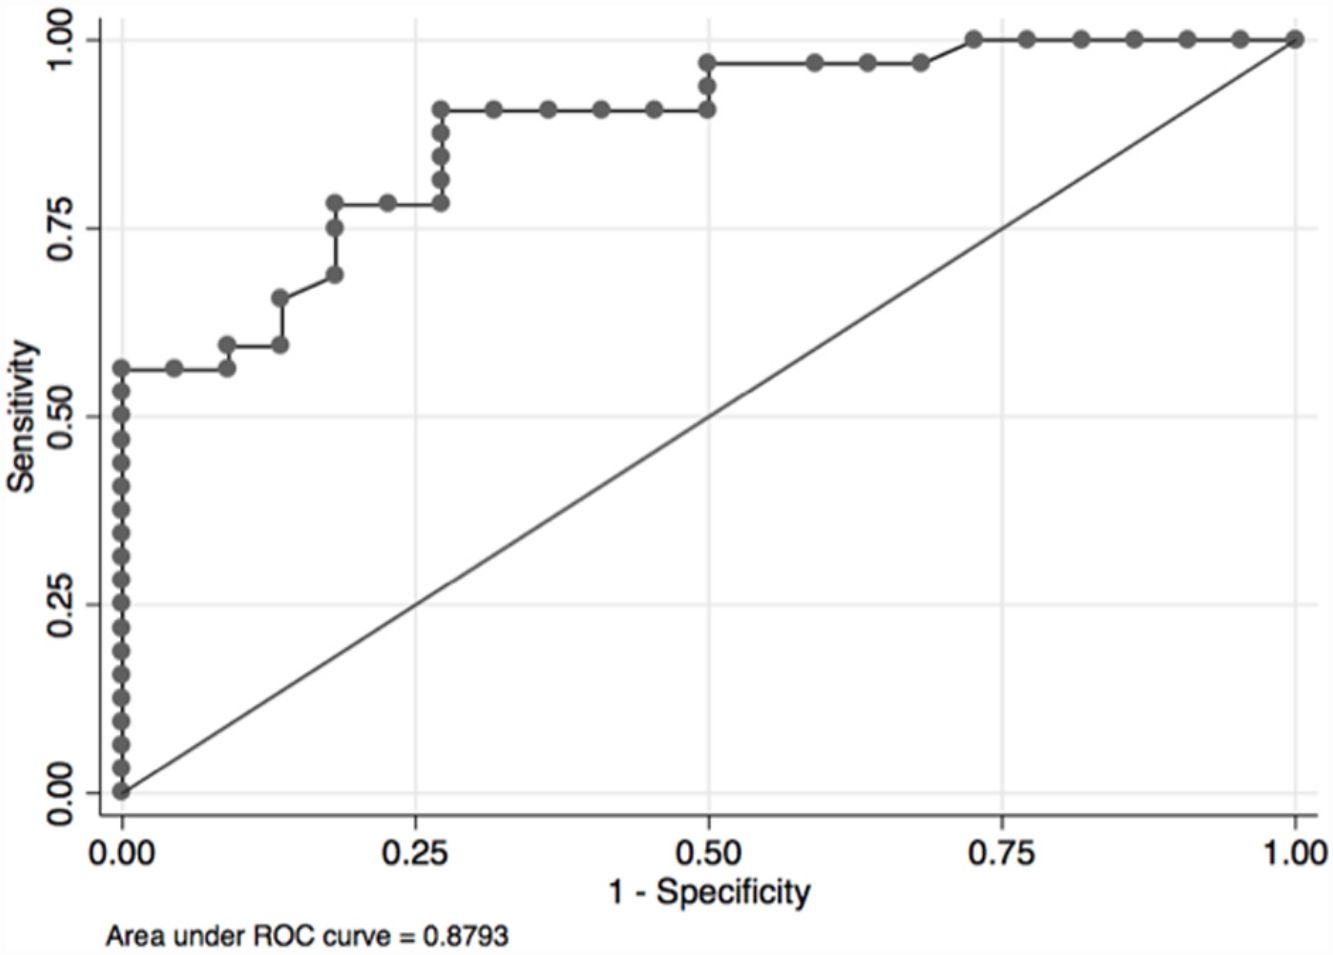
In the overall population, the maximal PETCO2 discriminated patients with low-risk value for V′O2peak of>15mL/kg/min (area under the receiver operating curve [AUC] 0.88, 95%CI 0.79–0.96) (Fig. 2) and V′O2peak>65% predicted (AUC 0.64, 95% CI 0.47–0.80).21 A maximal PETCO2 value of ≥25mmHg had 90% sensitivity and 72% specificity for a V′O2peak of>15mL/kg/min. The maximal PETCO2 AUC for V′O2peak of>15mL/kg/min was 0.89 in the normocapnic group and 0.77 in the hypocapnic group (Online Supplemental Figure 2).

Peak V′E was related to peak exercise PaO2 (r2=0.29, p=0.02) and PaCO2 (r2=0.3, p=0.01) in normocapnic patients but not in hypocapnic patients. The V′E/V′CO2 slope was related to peak exercise VD/VT, P(a-ET)CO2 and maximal PETCO2 in hypocapnic patients but not significantly correlated to VD/VT in normocapnic patients (Fig. 3). The VD/VT and P(a-ET)CO2 at peak exercise and PETCO2 max correlated with resting CI only in hypocapnic patients (Fig. 4). Maximal PETCO2 modestly correlated with resting CI but to a greater extent than resting or peak exercise PaCO2 in the overall population (Table 3). In hypocapnic patients, maximal exercise capacity (V′O2peak), was related the PETCO2 max (r2=0.37, p<0.0001) and to peak VD/VT (r2=0.27, p=0.001) (Fig. 5), whereas these variables were not related to V′O2peak in the normocapnic group. Similar correlations were seen with WRpeak as the dependent variable (Online Supplemental Figure 3).
CO2 at peak exercise, and maximal PETCO2 (PETCO2 Max) in patients with resting hypocapnia (HC) and resting normocapnia (NC). Shaded areas indicate 95% confidence intervals.")
CO2 at peak exercise versus resting cardiac index in patients with resting hypocapnia (HC) and resting normocapnia (NC). Shaded areas indicate 95% confidence intervals.")
 versus VD/VT at peak exercise, P(a-ET)CO2 at peak exercise and PETCO2max in patients with resting hypocapnia (HC) and resting normocapnia (NC). Shaded areas indicate 95% confidence intervals.")
In this study we tested the relationships between exercise variables, hemodynamics, markers of chemosensitivity, and the CO2 setpoint in a group of 59 patients with pulmonary vascular disease who performed CPET with peak exercise ABG sampling. We examined these relationships in the overall population and according to the presence of resting hypocapnia or resting normocapnia. The main findings of this study were: (1) the majority of CTEPH, all PVOD patients and 47% of PAH patients had resting hypocapnia, (2) hypocapnic patients were characterized by a lower CI, lower DLCO, worse exercise capacity, higher V′E/V′CO2 and more pronounced exertional hypoxemia than normocapnic patients, (3) the maximal PETCO2 was the strongest correlate of exercise capacity and ventilatory efficiency slope in the overall population and particularly in hypocapnic patients. These results provide insights into the relative influence of an altered PaCO2 setpoint and VD/VT on exercise capacity and ventilatory inefficiency during exercise in pulmonary vascular disease. Furthermore, the stronger relationship between maximal PETCO2 with peak exercise capacity and V′E/V′CO2 compared to resting or peak exercise blood gases suggests that maximal PETCO2 could be used as a non-invasive marker of CO2 setpoint and disease severity even during a submaximal effort.
The finding of resting hypocapnia is well known in pulmonary vascular diseases22–27 and 66% of patients had a resting PaCO2 <35mmHg in our study. Approximately half of the PAH patients had hypocapnia, while nearly all CTEPH patients and all PVOD patients were hypocapnic. The mechanisms of hypoxemia at rest and during exercise in these diseases include ventilation-perfusion inequality, shunt, and lower mixed venous oxygen saturation.22,23 Less is known about the mechanisms or clinical importance of resting hypocapnia. It is generally accepted that high physiologic dead space due to ventilation-perfusion heterogeneity and vascular obstruction accounts for the excessive ventilatory response during exercise in pulmonary vascular diseases, however, this does not adequately explain resting hypocapnia. Hypocapnia is likely a marker of more advanced or extensive pulmonary vascular disease in our population: 1) the lower DLCO/VA in hypocapnic patients may reflect lower capillary volume from more extensive pulmonary vascular involvement and 2) there was a slightly higher PVR in hypocapnic versus normocapnic patients, which would also support this notion. Hoeper et al. previously demonstrated that resting PaCO2 was not correlated to mPAP and only weakly related to cardiac index and mixed venous oxygen saturation in idiopathic PAH, with lower resting PaCO2 associated with worse survival.7 In our study of mixed etiologies of pulmonary vascular disease, patients with resting hypocapnia had more severe functional impairment as indicated by lower exercise capacity and worse cardiac function. Similarly to Hoeper et al.,7 PaCO2 at rest and peak exercise were also weakly correlated to resting cardiac index, and to a lesser extent than the maximal PETCO2 or VD/VT. This suggests an important and complex interaction between right ventricular function, hyperventilation at rest, chemosensitivity and exercise capacity. Patients with CTEPH who undergo pulmonary thromboendarterectomy (a procedure which reduces or eliminates pulmonary vascular bed obstruction) have improvements in pulmonary hemodynamics, hypoxemia and ventilation-perfusion inequalities on multiple inert gas testing, with a parallel increase in the resting PaCO2.26,27 However, it is not known whether improvement in resting PaCO2 is driven by changes in hemodynamics, sympathetic tone, ventilation-perfusion matching, or all of these mechanisms together.
Pulmonary vascular disease leads to right ventricular dysfunction and a low cardiac output state, similar to left heart failure, and there is increased sympathetic activity in PAH12 to a similar degree as in left heart failure. However, the V′E/V′CO2 tends to be higher in pulmonary vascular disease, while left heart failure patients are not typically hypocapnic at rest and do not desaturate during exercise.28-30 Our study provides certain insights into these underlying mechanisms of resting hypocapnia and high V′E/V′CO2 in pulmonary vascular disease. Patients with resting hypocapnia were different from normocapnic patients in several ways and showed evidence of different mechanisms of exercise limitation. First, hypocapnic patients had higher resting V′E but similar levels of peak ventilation and peak exercise respiratory rates despite having lower exercise capacity, highlighting the increased ventilatory drive at rest and during exercise in these patients. Second, most patients with resting hypocapnia had a PaO2> 60mmHg, and resting PaO2 did not correlate with peak V′E, indicating that stimulation of peripheral chemoreceptors is unlikely to be the explanation for resting hypocapnia. Therefore, other mechanisms, such as an altered central PaCO2 setpoint or other sympathetic reflexes are probably responsible for the low PaCO2 at rest. Our results suggest that an altered CO2 setpoint could play an important role. Indeed, maximal exercise performance was most highly related to the maximal PETCO2 value between the AT and RCP, an indicator of the CO2 setpoint,15–17 in the overall population and in hypocapnic patients, but not normocapnic patients. The normocapnic patients still had reduced peak exercise capacity but likely are limited by other mechanisms than impaired gas exchange or ventilatory inefficiency. Similarly, the PETCO2 max was a stronger correlate of V′E/V′CO2 and V′O2peak than the VD/VT or P(a-ET)CO2. In fact, V′E/V′CO2 was not correlated with peak exercise VD/VT whereas maximal PETCO2 explained 61% of the variability in V′E/VCO2 slope among hypocapnic patients. This contrast with a study by Kee et al., where high VD/VT was the main mediator of exercise capacity and V′E/V′CO2 in systolic heart failure patients.31 This suggests that the CO2 set-point is at least as important as VD/VT in determining exercise capacity and ventilatory inefficiency in pulmonary vascular diseases. The V′O2peak is a strong predictor of mortality4,5,32 and is a recommended variable for comprehensive risk assessment and monitoring treatment,21 however many patients with pulmonary vascular disease may not achieve a maximal effort during CPET. The maximal PETCO2 also had excellent discrimination for identifying patients who had a “low-risk” V′O2peak (>15mL/kg/min) value for mortality,21 which could be useful in risk assessment when there is a submaximal effort. However, the prognostic value of maximal PETCO2 and the effect of targeted interventions on this variable remain to be explored and should be studied in the future.
Autonomic dysfunction, increased sympathetic nervous system activity, and an altered CO2 set-point are related to chemoreflex sensitivity. Our results are supportive of a recent study by Farina et al., who performed minute-to-minute blood gas analysis during exercise in 18 patients with pulmonary vascular disease.33 They performed hypoxic and hypercapnic challenge tests to evaluate peripheral and central chemosensitivity and found that, although chemoreceptor sensitivity was increased in PAH and CTEPH, peripheral chemoreceptor responses to hypoxia and hypercapnia did not correlate with any exercise parameter. However, central chemoreceptor sensitivity to hypercapnia did correlate with the VA/VCO2 slope during exercise, suggesting that the higher VA due to a lower central CO2 setpoint could be the main explanation for resting hypocapnia. We extend and confirm their results that the CO2 setpoint is likely an important underlying mechanism of inefficient ventilation to a much larger population. Together, we and Farina et al.,33 imply that hypocapnic patients and/or those with low maximal PETCO2 during exercise have autonomic dysfunction and a lower CO2 setpoint. Thus, resting PaCO2 or maximal PETCO2 could be used to identify patients with probably autonomic dysfunction as inclusion criteria or to help enrich future studies that target the sympathetic nervous system in pulmonary vascular disease.
LimitationsOur study has limitations given its retrospective nature. Autonomic function and chemoreflex responses were not specifically tested in our study, therefore, we may only generate additional hypotheses about the relative role these reflexes in the high ventilatory inefficiency in our population. However, our results and conclusions are supportive of a recent smaller study by Farina et al., which did test chemoreflexes. Although the distinction and definitions of normocapnia and hypocapnia were made a priori, there was a smaller number of patients in the normocapnic group (n=20), which may have affected statistical significance in comparing certain patient characteristics or correlations. The different proportion of etiologies between the hypo and normocapnic groups and their different sizes may also explain some of the weaker correlations and conclusions. We also did not have resting or exertional echocardiographic data to exclude a patent foramen ovale in patients with exercise-related desaturation and high V′E/V′CO2, which could be a contributing mechanism of inefficient ventilation in some patients.34
ConclusionsPatients with resting hypocapnia have worse cardiac function and more severe gas exchange abnormalities during exercise. High chemosensitivity and an altered PaCO2 setpoint are likely explanations for resting hypocapnia and high V′E/V′CO2. The PaCO2 setpoint, estimated by the maximal PETCO2 was the strongest correlate of peak exercise capacity and V′E/V′CO2, suggesting that this variable could be used as a non-invasive measure of CO2 setpoint and disease severity even during submaximal exercise.
Conflicts of InterestsDr. Weatherald reports grants, personal fees and non-financial support from Actelion and Janssen Inc., personal fees and non-financial support from Bayer, personal fees from Novartis, grants from grants from Canadian Vascular Network, outside the submitted work; grants from European Respiratory Society related to the current work. Dr. Boucly reports personal fees and non-financial support from Actelion Pharmaceuticals, non-financial support from Bayer HealthCare, non-financial support from GlaxoSmithKline, personal fees and non-financial support from Merck, outside the submitted work. Dr. Montani reports grants and personal fees from Actelion Pharmaceuticals, grants and personal fees from Bayer HealthCare, personal fees from GlaxoSmithKline, personal fees from Novartis, personal fees from Pfizer, personal fees from BMS, outside the submitted work. Dr. Jaïs reports grants, personal fees and non-financial support from Actelion Pharmaceuticals, grants, personal fees and non-financial support from Bayer HealthCare, grants, personal fees and non-financial support from GlaxoSmithKline, grants, personal fees and non-financial support from MSD, outside the submitted work. Dr. Savale reports grants and personal fees from Actelion Pharmaceuticals, grants and personal fees from Bayer HealthCare, personal fees from GlaxoSmithKline, personal fees from Merck, outside the submitted work. Dr. Humbert reports personal fees from Actelion, grants and personal fees from Bayer, grants and personal fees from GSK, personal fees from Merck, from United Therapeutics, outside the submitted work. Dr. Sitbon reports grants, personal fees and non-financial support from Actelion Pharmaceuticals, personal fees from Acceleron Pharmaceuticals, personal fees from Arena Pharmaceuticals, grants and personal fees from Bayer HealthCare, grants, personal fees and non-financial support from GlaxoSmithKline, personal fees from Gossamer Bio, grants and personal fees from Merck, outside the submitted work. Dr. Garcia has nothing to disclose. Dr. Laveneziana reports personal fees from NOVARTIS France, personal fees from BOEHRINGER France, outside the submitted work.
JW was the recipient of a joint European Respiratory Society/Canadian Thoracic Society Long-Term Research Fellowship (LTRF 2015 – 4780) which funded this research. These organizations had no role in the design, collection or publication of this manuscript.
Part of this study has been presented in abstract form at the European Respiratory Society Congress in Milan, Italy, on September 11, 2017.


