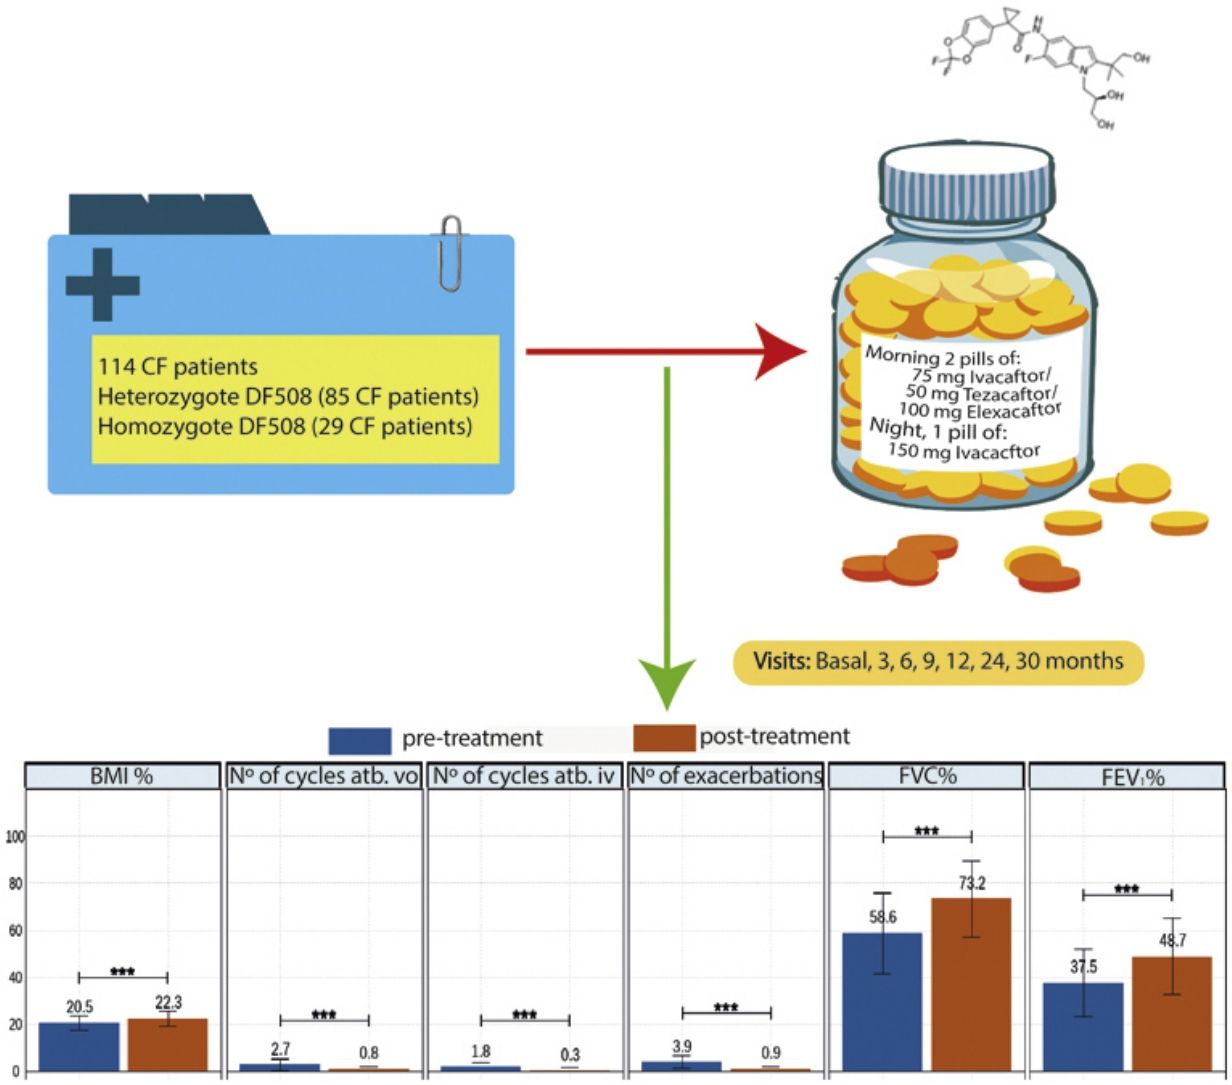
Elexacaftor/tezacaftor/ivacaftor (ETI) was used through the early access programme in Spain from December 2019 in cystic fibrosis (CF) patients with homozygous or heterozygous F508del mutation with advanced lung disease.
MethodologyMulticentre, ambispective, observational, study in which 114 patients in follow-up in 16 national CF units were recruited. Clinical data, functional tests, nutritional parameters, quality of life questionnaires, microbiological isolates, number of exacerbations, antibiotic treatments and side effects were collected. The study also compared patients with homozygous and heterozygous F508del mutations.
ResultsOf the 114 patients, 85 (74.6%) were heterozygous for F508del mutation, and the mean age was 32.2±9.96 years. After 30 months of treatment, lung function measured by FEV1% showed improvement from 37.5 to 48.6 (p<0.001), BMI increased from 20.5 to 22.3 (p<0.001), and all isolated microorganisms decreased significantly. The total number of exacerbations was also significantly reduced from 3.9 (±2.9) to 0.9 (±1.1) (p<0.001). All items in the CFQ-R questionnaire showed improvement, except for the digestive domain. Oxygen therapy use decreased by 40%, and only 20% of patients referred for lung transplantation remained on the active transplant list. ETI was well-tolerated, with only 4 patients discontinuing treatment due to hypertransaminemia.
ConclusionsETI decreases the number of exacerbations, increases lung function and nutritional parameters, decrease in all isolated microorganisms, for 30 months of treatment. There is an improvement in the CFQ-R questionnaire score except for the digestive item. It is a safe and well-tolerated drug.
The treatment of cystic fibrosis (CF) since the beginning of the disease has focused on symptomatic and preventive treatment. With the approval of new CFTR (cystic fibrosis transmembrane regulator) modulator drugs by the US Food and Drug Administration (FDA) and the European Medicines Agency (EMA), the CF paradigm has undergone a major shift.
We can say that we are in the “New Era” of modulatory treatments. We currently have several drugs on the market, including ivacaftor, the first drug approved in 2012, lumacaftor and tezacaftor in combination with ivacaftor, and the latest to join the list is elaxacaftor, which is administered together with tezacaftor and ivacaftor. All of them have shown improvement in some clinical aspects as shown in the following studies.1–3
Elexacaftor/tezacaftor/ivacaftor (ETI) was approved by the FDA in 2019 and by the EMA in August 2020. In Spain, the application was allowed through the access programme in December 2019. The indication for ETI is in patients with the F508del mutation in homozygosis or heterozygosis.4 Since September 2022 the age range has been reduced and it can be prescribed to children aged ≥6 years.
Elexacaftor is a CFTR protein corrector that binds to the protein at a different binding site than tezacaftor, having an additive effect to facilitate cellular processing and transport of F508del of CFTR and increase the amount of CFTR protein released to the cell surface. Clinical trials have shown that ETI improves ion transport, maximum exhaled volume during the first second of forced exhalation (FEV1%), body mass index (BMI) and reduces the number of exacerbations. It is a safe drug to administer with only mild to moderate adverse effects reported.
In this manuscript we present the experience of 16 Spanish centres with ETI in CF patients with advanced lung disease (FEV1 <40%) after 30 months of treatment upon entry into the early access programme.
Patients and MethodsWe conducted an ambispective, multi-centre, observational, real-life study with 114 patients in 16 CF hospitals of Spain. The patients entered a compassionate use programme because the drug was authorised by the FDA, but its authorisation was not approved in Spain. All patients received elexacaftor 200mg once daily (qd)/tezacaftor 100mg (qd)/ivacaftor 150mg every 12h (q12h). Inclusion criteria: patients 12 years of age and older with confirmed diagnosis of CF. Patients who have homozygous or heterozygous F508del mutation and meet at least one of the following criteria: FEV1 <40% for a minimum of 2 months before the date of completion, documentation of being active on a lung transplant waiting list or being evaluated for lung transplantation. Exclusion criteria: patients currently receiving invasive mechanical ventilation, patients with severe hepatic impairment (Child-Pugh Class C), history of advanced liver disease with or without hepatic impairment that in the opinion of the treating physician might pose undue risk in administering ETI to the patient or have any of the following abnormal laboratory values during the eligibility assessment (>5×upper limit of normal (ULN) alanine transaminase (ALT) or aspartate transaminase (AST), >3×ULN ALT or AST with >2×ULN total bilirubin). In addition, the history of solid organ or haematological transplantation, known history of alcohol or drug abuse in the past year. For sexually active patients of reproductive potential who are not willing to use appropriate contraception methods approved by the treating physician.
Eligibility assessments should occur before administration of ETI. Patients signed the informed consent form and underwent the following examinations prior to inclusion: baseline ophthalmologic examination for patients less than 18 years of age, spirometry (assessed pre- or post-bronchodilator), pregnancy test for females, liver function tests (ALT, AST, and total bilirubin) and review of prior and concomitant medications.
We collected the following general clinical variables: age, age at treatment initiation, sex, mutation type, exocrine pancreatic insufficiency, endocrine pancreatic CF-related diabetes (CFRD) and glucose intolerance, hepatopathy, chronic bronchial infection. Moreover, the treatment use collected were previous modulator use, oxygen therapy and non-invasive ventilation (NIV) or pending or on an active list for lung transplantation. We recorded tolerability and overall drug safety data with the adverse effects observed and whether this had an impact on the decision to discontinue the drug. We compared these results between homozygous and heterozygous patients.
In addition, we monitored clinical visits: values of forced vital capacity (FVC), FEV1 and BMI and quality of life questionnaires (CFQ-R), chronic bronchial infection by bacteria, mycobacteria and fungi: baseline, 3, 6, 9, 12, 18, 24, 30 months after treatment.
In addition, we recorded the number of respiratory exacerbations oral (vo.) and intravenous (iv.) in the year before and after the start of ETI, differentiating between oral and intravenous antibiotic cycles.
The document followed STROBE (http://www.strobe-statement.org/) recommendations for observational studies.
The study conducted descriptive analyses on quantitative variables, including mean and standard deviation calculations. The normality and homoscedasticity of continuous variables were checked using the Shapiro-W Kolmogorov-Smirnov and Levene's tests, respectively. Parametric tests were used when distributions were normal and homoscedastic. Non-parametric tests were used when either assumption was not met. For qualitative variables, proportions were compared using chi-square. Additionally, a Random Forest analysis was performed to assess explanatory variable importance in FEV1 improvement. All analyses were conducted using R,5 and statistical significance was set at p<0.05.
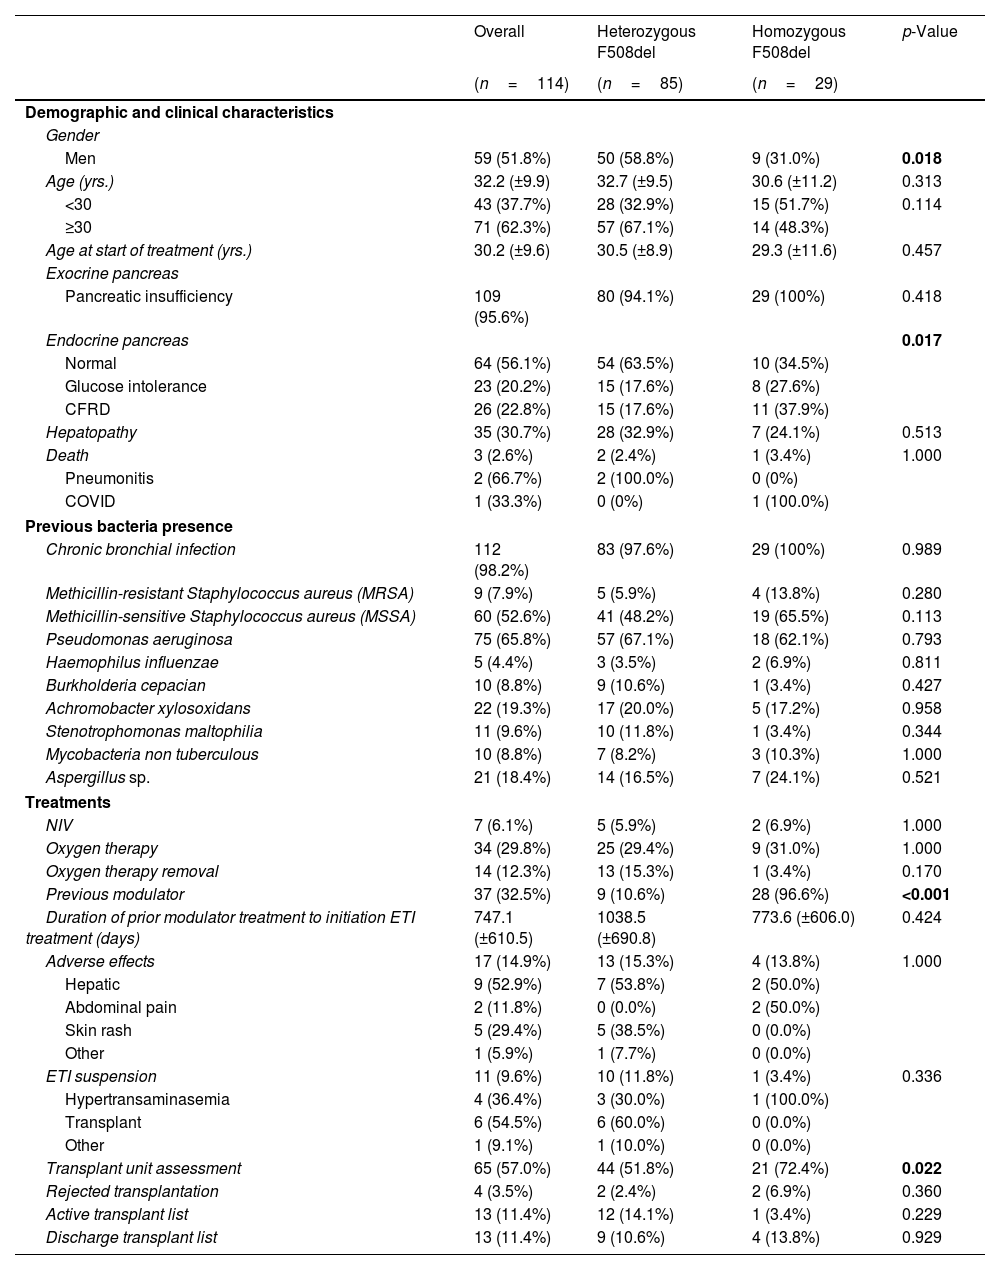
ResultsDemographic and Clinical CharacteristicsThe characteristics of the 114 patients and the comparison between the group of homozygous and heterozygous patients F508del are shown in Table 1.
Sociodemographic and Clinical Characteristics of Patients With Cystic Fibrosis (CF) in Total and According to Mutation Type.
| Overall | Heterozygous F508del | Homozygous F508del | p-Value | |
|---|---|---|---|---|
| (n=114) | (n=85) | (n=29) | ||
| Demographic and clinical characteristics | ||||
| Gender | ||||
| Men | 59 (51.8%) | 50 (58.8%) | 9 (31.0%) | 0.018 |
| Age (yrs.) | 32.2 (±9.9) | 32.7 (±9.5) | 30.6 (±11.2) | 0.313 |
| <30 | 43 (37.7%) | 28 (32.9%) | 15 (51.7%) | 0.114 |
| ≥30 | 71 (62.3%) | 57 (67.1%) | 14 (48.3%) | |
| Age at start of treatment (yrs.) | 30.2 (±9.6) | 30.5 (±8.9) | 29.3 (±11.6) | 0.457 |
| Exocrine pancreas | ||||
| Pancreatic insufficiency | 109 (95.6%) | 80 (94.1%) | 29 (100%) | 0.418 |
| Endocrine pancreas | 0.017 | |||
| Normal | 64 (56.1%) | 54 (63.5%) | 10 (34.5%) | |
| Glucose intolerance | 23 (20.2%) | 15 (17.6%) | 8 (27.6%) | |
| CFRD | 26 (22.8%) | 15 (17.6%) | 11 (37.9%) | |
| Hepatopathy | 35 (30.7%) | 28 (32.9%) | 7 (24.1%) | 0.513 |
| Death | 3 (2.6%) | 2 (2.4%) | 1 (3.4%) | 1.000 |
| Pneumonitis | 2 (66.7%) | 2 (100.0%) | 0 (0%) | |
| COVID | 1 (33.3%) | 0 (0%) | 1 (100.0%) | |
| Previous bacteria presence | ||||
| Chronic bronchial infection | 112 (98.2%) | 83 (97.6%) | 29 (100%) | 0.989 |
| Methicillin-resistant Staphylococcus aureus (MRSA) | 9 (7.9%) | 5 (5.9%) | 4 (13.8%) | 0.280 |
| Methicillin-sensitive Staphylococcus aureus (MSSA) | 60 (52.6%) | 41 (48.2%) | 19 (65.5%) | 0.113 |
| Pseudomonas aeruginosa | 75 (65.8%) | 57 (67.1%) | 18 (62.1%) | 0.793 |
| Haemophilus influenzae | 5 (4.4%) | 3 (3.5%) | 2 (6.9%) | 0.811 |
| Burkholderia cepacian | 10 (8.8%) | 9 (10.6%) | 1 (3.4%) | 0.427 |
| Achromobacter xylosoxidans | 22 (19.3%) | 17 (20.0%) | 5 (17.2%) | 0.958 |
| Stenotrophomonas maltophilia | 11 (9.6%) | 10 (11.8%) | 1 (3.4%) | 0.344 |
| Mycobacteria non tuberculous | 10 (8.8%) | 7 (8.2%) | 3 (10.3%) | 1.000 |
| Aspergillus sp. | 21 (18.4%) | 14 (16.5%) | 7 (24.1%) | 0.521 |
| Treatments | ||||
| NIV | 7 (6.1%) | 5 (5.9%) | 2 (6.9%) | 1.000 |
| Oxygen therapy | 34 (29.8%) | 25 (29.4%) | 9 (31.0%) | 1.000 |
| Oxygen therapy removal | 14 (12.3%) | 13 (15.3%) | 1 (3.4%) | 0.170 |
| Previous modulator | 37 (32.5%) | 9 (10.6%) | 28 (96.6%) | <0.001 |
| Duration of prior modulator treatment to initiation ETI treatment (days) | 747.1 (±610.5) | 1038.5 (±690.8) | 773.6 (±606.0) | 0.424 |
| Adverse effects | 17 (14.9%) | 13 (15.3%) | 4 (13.8%) | 1.000 |
| Hepatic | 9 (52.9%) | 7 (53.8%) | 2 (50.0%) | |
| Abdominal pain | 2 (11.8%) | 0 (0.0%) | 2 (50.0%) | |
| Skin rash | 5 (29.4%) | 5 (38.5%) | 0 (0.0%) | |
| Other | 1 (5.9%) | 1 (7.7%) | 0 (0.0%) | |
| ETI suspension | 11 (9.6%) | 10 (11.8%) | 1 (3.4%) | 0.336 |
| Hypertransaminasemia | 4 (36.4%) | 3 (30.0%) | 1 (100.0%) | |
| Transplant | 6 (54.5%) | 6 (60.0%) | 0 (0.0%) | |
| Other | 1 (9.1%) | 1 (10.0%) | 0 (0.0%) | |
| Transplant unit assessment | 65 (57.0%) | 44 (51.8%) | 21 (72.4%) | 0.022 |
| Rejected transplantation | 4 (3.5%) | 2 (2.4%) | 2 (6.9%) | 0.360 |
| Active transplant list | 13 (11.4%) | 12 (14.1%) | 1 (3.4%) | 0.229 |
| Discharge transplant list | 13 (11.4%) | 9 (10.6%) | 4 (13.8%) | 0.929 |
Data are shown as n (%), mean±standard deviation (SD). Significant comparisons (p<0.05) are marked in bold. CFRD: CF-related diabetes; COVID (Coronavirus Disease); ETI: elexacaftor/tezacaftor/ivacaftor; NIV: non-invasive ventilation; other: severe functional and clinical deterioration, by change to the new modulator.
The clinic variables, pre-treatment and post-treatment, were assessed for all patients and compared for each group (eTable 1 and Fig. 1). The BMI, FVC% and FEV1% increased, while the number of exacerbations, number of cycles vo. and iv. were reduced.
.")
A similar trend was observed for heterozygous and homozygous F508del patients. Heterozygous F508del group increased higher BMI than homozygous F508del group. The number of exacerbations had higher decreased for homozygous F508del than for heterozygous F508del patients, but no significative. Likewise the reduction of the number of cycles antibiotics oral and intravenous was higher for homozygous.
Meanwhile, lung functions parameters assessed showed a higher increment for heterozygous F508del group.
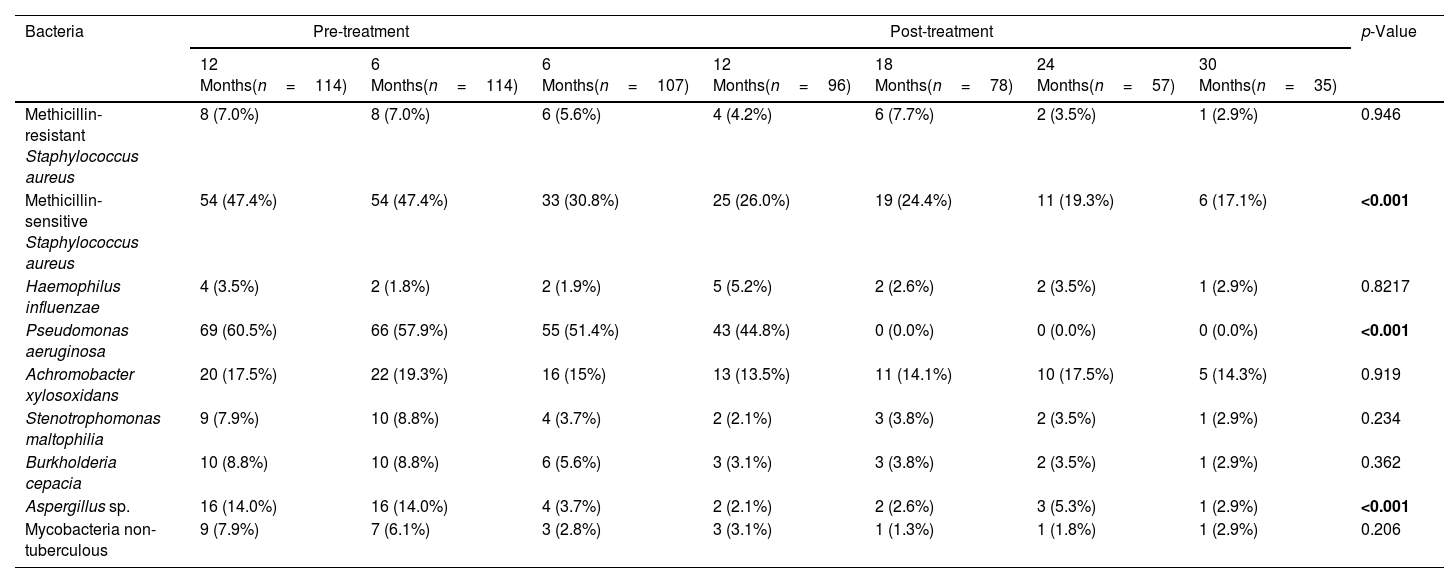
Effect of the Treatment in Bacteria PresenceThe top three bacteria with higher presence at the beginning of the study (12 months pre-treatment) were Pseudomonas aeruginosa (60.5% patients), MSSA (47.4%) and Achromobacter xylosoxidans (17.5%), maintaining this rank at 6 months pre-treatment. Once the treatment was applied this affect to the presence of all bacteria assessed in the present study (Table 2 and Fig. 2). The assessment of the percentage of presence during each time of study showed a reduction in all bacteria studied. The percentage of change of bacteria presence between the first and last time (12 months pre-treatment and 30 months post-treatment) (Fig. 2) showed that the top three with higher percentage of change were P. aeruginosa (−100.0%), Aspergillus sp. (−79.3%) and MSSA (−63.9%).
Comparisons of the Presence of Bacteria Before and After Follow-up Treatment With the Elexacaftor/Tezacaftor/Ivacaftor Combination.
| Bacteria | Pre-treatment | Post-treatment | p-Value | |||||
|---|---|---|---|---|---|---|---|---|
| 12 Months(n=114) | 6 Months(n=114) | 6 Months(n=107) | 12 Months(n=96) | 18 Months(n=78) | 24 Months(n=57) | 30 Months(n=35) | ||
| Methicillin-resistant Staphylococcus aureus | 8 (7.0%) | 8 (7.0%) | 6 (5.6%) | 4 (4.2%) | 6 (7.7%) | 2 (3.5%) | 1 (2.9%) | 0.946 |
| Methicillin-sensitive Staphylococcus aureus | 54 (47.4%) | 54 (47.4%) | 33 (30.8%) | 25 (26.0%) | 19 (24.4%) | 11 (19.3%) | 6 (17.1%) | <0.001 |
| Haemophilus influenzae | 4 (3.5%) | 2 (1.8%) | 2 (1.9%) | 5 (5.2%) | 2 (2.6%) | 2 (3.5%) | 1 (2.9%) | 0.8217 |
| Pseudomonas aeruginosa | 69 (60.5%) | 66 (57.9%) | 55 (51.4%) | 43 (44.8%) | 0 (0.0%) | 0 (0.0%) | 0 (0.0%) | <0.001 |
| Achromobacter xylosoxidans | 20 (17.5%) | 22 (19.3%) | 16 (15%) | 13 (13.5%) | 11 (14.1%) | 10 (17.5%) | 5 (14.3%) | 0.919 |
| Stenotrophomonas maltophilia | 9 (7.9%) | 10 (8.8%) | 4 (3.7%) | 2 (2.1%) | 3 (3.8%) | 2 (3.5%) | 1 (2.9%) | 0.234 |
| Burkholderia cepacia | 10 (8.8%) | 10 (8.8%) | 6 (5.6%) | 3 (3.1%) | 3 (3.8%) | 2 (3.5%) | 1 (2.9%) | 0.362 |
| Aspergillus sp. | 16 (14.0%) | 16 (14.0%) | 4 (3.7%) | 2 (2.1%) | 2 (2.6%) | 3 (5.3%) | 1 (2.9%) | <0.001 |
| Mycobacteria non-tuberculous | 9 (7.9%) | 7 (6.1%) | 3 (2.8%) | 3 (3.1%) | 1 (1.3%) | 1 (1.8%) | 1 (2.9%) | 0.206 |
Data are shown as presence/total patients (%). Significant comparisons (p<0.05) are marked in bold.
.")
Percentage of bacteria from 12 months pre-treatment to 30 months post-treatment. The flashing red line symbolises time 0 of treatment application. The number after bacteria name indicate the percentage of change between first and last time assessed (12 months pre-treatment vs 30 months post-treatment).
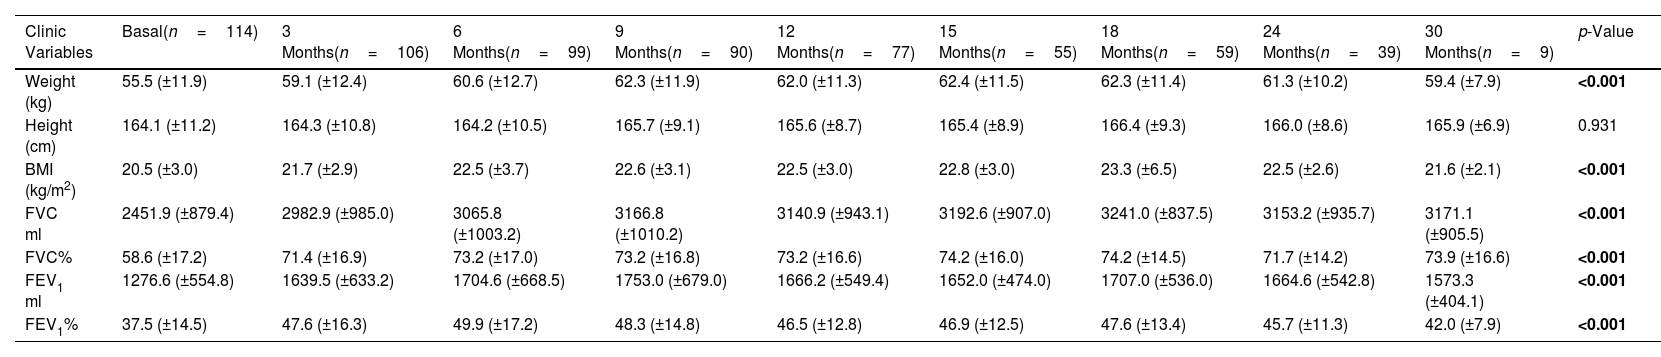
The collection of clinical and quality of life data allowed us to assess how the patients evolved throughout the treatment (Table 3 and eFigure 1). The mean BMI value showed a significant difference throughout the treatment (p<0.001). Although the mean value showed an improvement from month 12 post-treatment onwards, the mean value was maintained and then decreased at 30 months. In terms of pulmonary functions all showed a significant improvement (p<0.001), although FEV1 ml and percentage showed a decrease from 24 months post-treatment onwards.
Comparisons of the Clinic Variables and Quality of Life Questionaries Before and After Follow-up Treatment With the Elexacaftor/Tezacaftor/Ivacaftor Combination.
| Clinic Variables | Basal(n=114) | 3 Months(n=106) | 6 Months(n=99) | 9 Months(n=90) | 12 Months(n=77) | 15 Months(n=55) | 18 Months(n=59) | 24 Months(n=39) | 30 Months(n=9) | p-Value |
|---|---|---|---|---|---|---|---|---|---|---|
| Weight (kg) | 55.5 (±11.9) | 59.1 (±12.4) | 60.6 (±12.7) | 62.3 (±11.9) | 62.0 (±11.3) | 62.4 (±11.5) | 62.3 (±11.4) | 61.3 (±10.2) | 59.4 (±7.9) | <0.001 |
| Height (cm) | 164.1 (±11.2) | 164.3 (±10.8) | 164.2 (±10.5) | 165.7 (±9.1) | 165.6 (±8.7) | 165.4 (±8.9) | 166.4 (±9.3) | 166.0 (±8.6) | 165.9 (±6.9) | 0.931 |
| BMI (kg/m2) | 20.5 (±3.0) | 21.7 (±2.9) | 22.5 (±3.7) | 22.6 (±3.1) | 22.5 (±3.0) | 22.8 (±3.0) | 23.3 (±6.5) | 22.5 (±2.6) | 21.6 (±2.1) | <0.001 |
| FVC ml | 2451.9 (±879.4) | 2982.9 (±985.0) | 3065.8 (±1003.2) | 3166.8 (±1010.2) | 3140.9 (±943.1) | 3192.6 (±907.0) | 3241.0 (±837.5) | 3153.2 (±935.7) | 3171.1 (±905.5) | <0.001 |
| FVC% | 58.6 (±17.2) | 71.4 (±16.9) | 73.2 (±17.0) | 73.2 (±16.8) | 73.2 (±16.6) | 74.2 (±16.0) | 74.2 (±14.5) | 71.7 (±14.2) | 73.9 (±16.6) | <0.001 |
| FEV1 ml | 1276.6 (±554.8) | 1639.5 (±633.2) | 1704.6 (±668.5) | 1753.0 (±679.0) | 1666.2 (±549.4) | 1652.0 (±474.0) | 1707.0 (±536.0) | 1664.6 (±542.8) | 1573.3 (±404.1) | <0.001 |
| FEV1% | 37.5 (±14.5) | 47.6 (±16.3) | 49.9 (±17.2) | 48.3 (±14.8) | 46.5 (±12.8) | 46.9 (±12.5) | 47.6 (±13.4) | 45.7 (±11.3) | 42.0 (±7.9) | <0.001 |
| Quality of Life Questionaries | Basal(±n=73) | 3 Months(±n=58) | 6 Months(±n=61) | 9 Months | 12 Months(±n=56) | 15 Months(±n=28) | 18 Months(±n=29) | 24 Months(±n=29) | 30 Months | p-Value |
|---|---|---|---|---|---|---|---|---|---|---|
| CFQ-R respiratory | 47.3 (±23.2) | 78.8 (±17.5) | 81.4 (±16.1) | NA | 77.9 (±24.9) | 56.3 (±38.7) | 54.8 (±39.7) | 53.1 (±41.4) | NA | <0.001 |
| CFQ-R digestive | 75.2 (±20.3) | 80.7 (±16.1) | 83.4 (±15.8) | NA | 81.0 (±24.2) | 60.6 (±40.8) | 59.4 (±42.2) | 54.4 (±42.3) | NA | <0.001 |
| CFQ-R vitality | 49.0 (±25.1) | 71.0 (±17.8) | 75.2 (±16.8) | NA | 69.7 (±24.0) | 53.3 (±37.4) | 50.9 (±38.4) | 48.9 (±38.9) | NA | <0.001 |
| CFQ-R physical activity | 41.8 (±26.5) | 68.3 (±19.2) | 73.2 (±22.0) | NA | 69.1 (±29.1) | 55.4 (±40.1) | 50.9 (±39.2) | 50.4 (±41.3) | NA | <0.001 |
| CFQ-R food | 76.7 (±26.8) | 88.5 (±16.9) | 89.7 (±15.8) | NA | 82.6 (±26.8) | 63.9 (±43.5) | 62.8 (±46.2) | 60.5 (±46.3) | NA | <0.001 |
| CFQ-R daily activities | 60.8 (±27.5) | 76.1 (±21.5) | 80.0 (±18.3) | NA | 78.7 (±26.2) | 62.3 (±41.4) | 57.4 (±41.4) | 56.4 (±43.1) | NA | <0.001 |
| CFQ-R treatment | 38.2 (±23.5) | 51.7 (±19.9) | 56.3 (±22.6) | NA | 55.0 (±23.9) | 47.2 (±34.4) | 42.1 (±34.2) | 40.2 (±34.4) | NA | <0.001 |
| CFQ-R emotional | 66.4 (±21.5) | 76.8 (±18.1) | 79.9 (±16.1) | NA | 74.6 (±25.1) | 58.8 (±40.7) | 56.6 (±41.7) | 53.6 (±41.0) | NA | <0.001 |
Sample sizes are shown with the minimum and maximum collected for all variables assessed. Data are shown as mean±standard deviation (SD). BMI: body mass index; FVC: forced vital capacity; FEV1%: maximum exhaled volume during the first second of forced exhalation; CFQ-R: Cystic Fibrosis Questionnaire-Revised. Variables that showed a significant difference (p<0.05) are shown in bold. ND: data not available.
For the quality of-life, the mean value of all items showed a significant difference (p<0.001) between basal to last time point. In line with what occurred previously, the mean value of some items after the increase in the first months showed a plateau or decrease during the months evaluated.
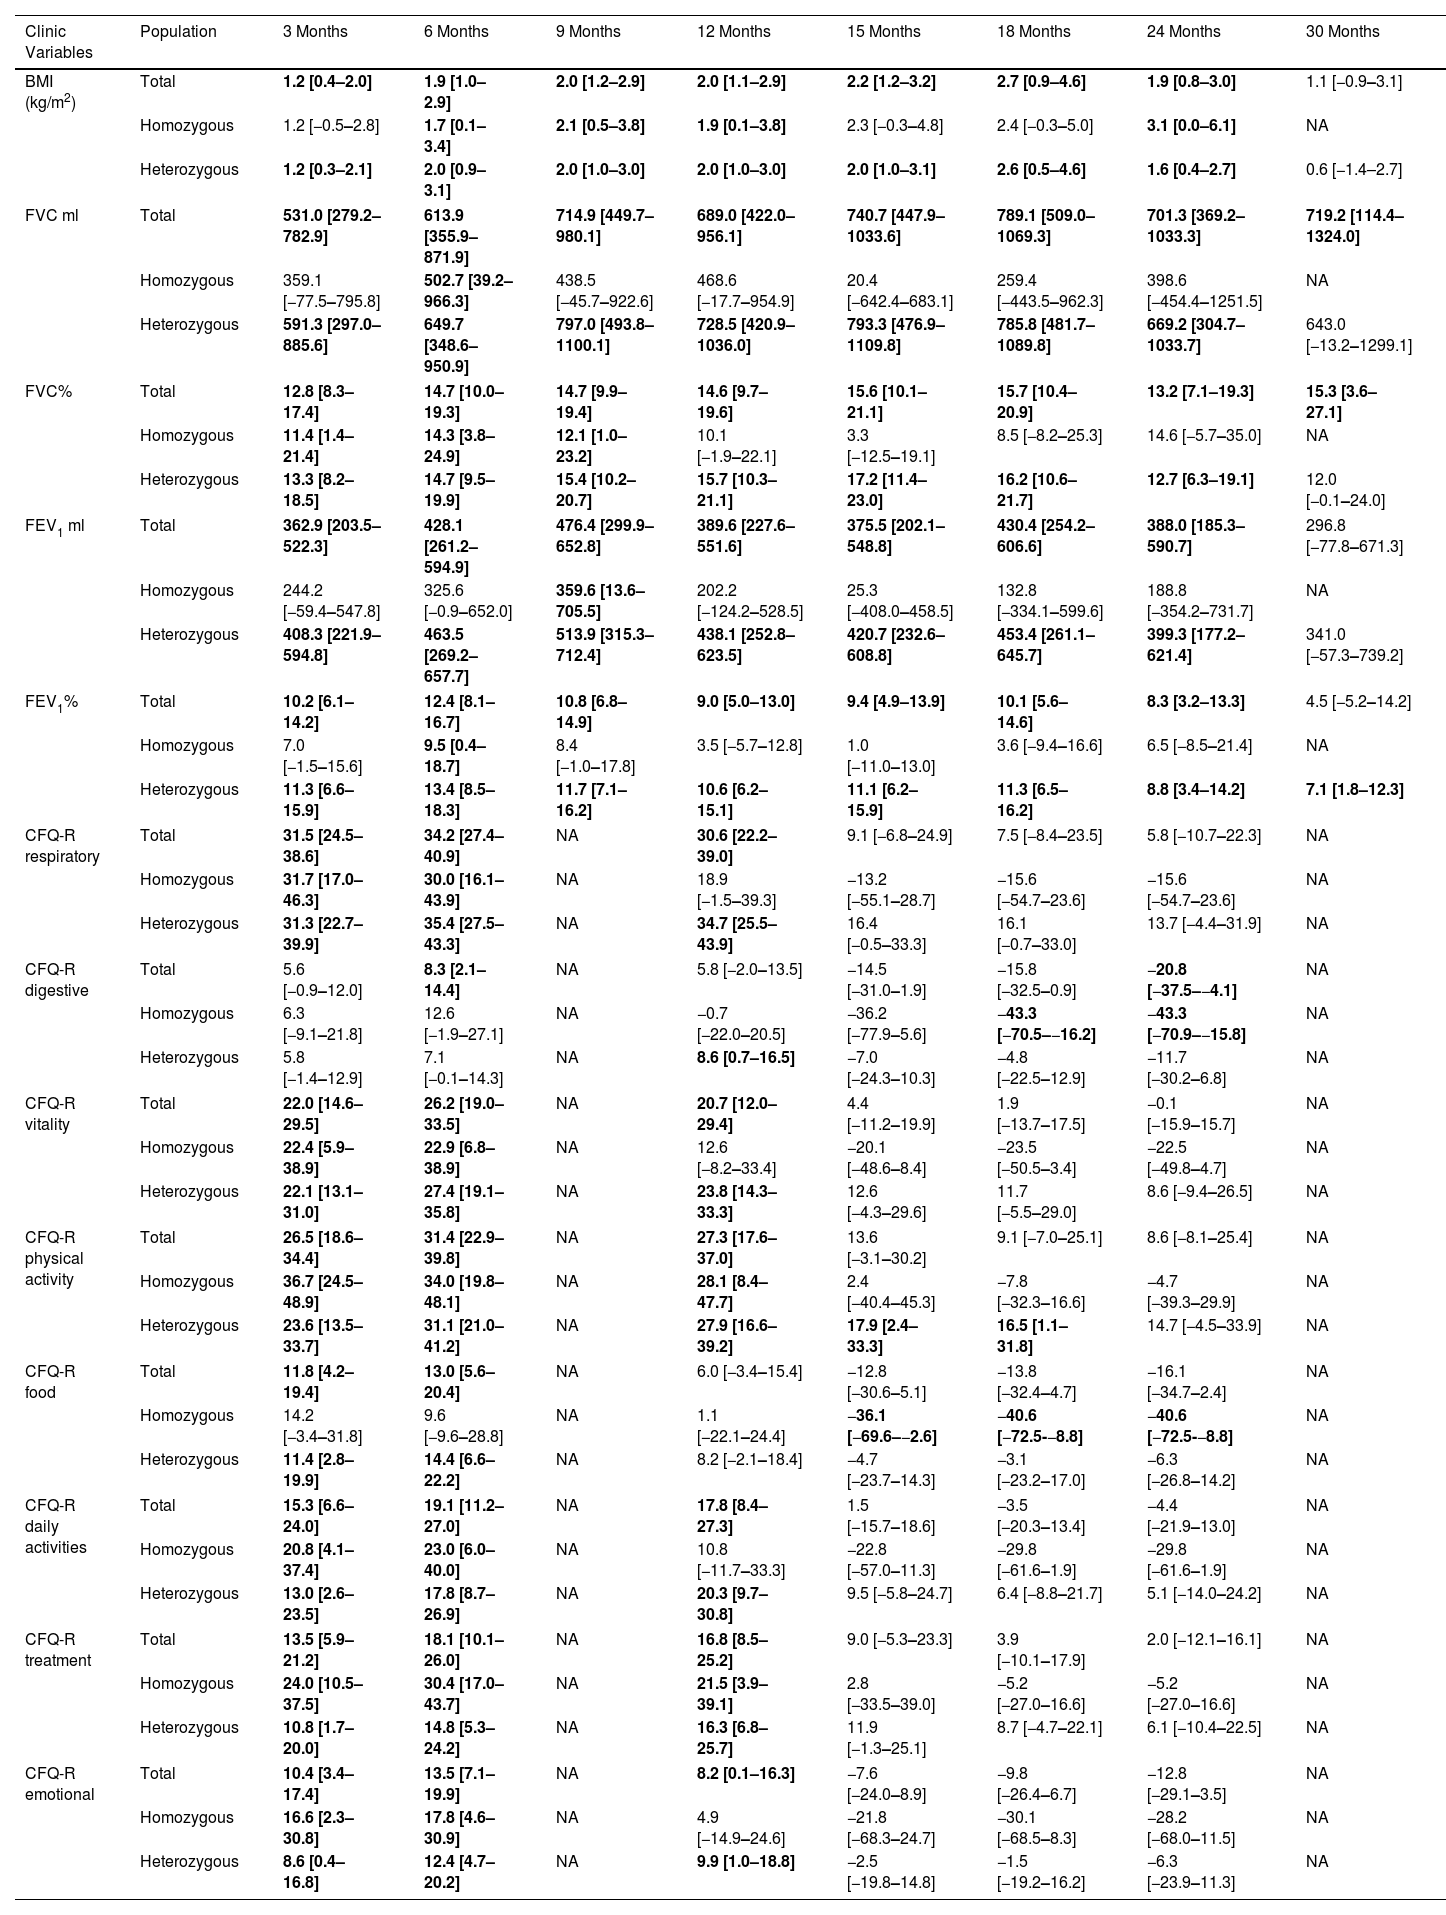
We also calculated the mean difference between the baseline values and the values at each month of follow-up (Table 4 and eFigure 1). We showed that for all clinic variables the mean difference values increased and after some months of follow-up decreased. BMI, FVC% and FEV1% had a significant increase until the difference between baseline–24 months, with the exception of FVC%. For the CFQ-R domains of respiratory, vitality, physical activity, daily activities, and emotional well-being, the increase was significant until the difference between baseline and 12 months, except for the CFQ-R digestive and food domains.
Mean Differences of the Clinic Variables and Quality of Life Questionaries for Each Month Post Treatment With the Elexacaftor/Tezacaftor/Ivacaftor Combination vs Basal Results.
| Clinic Variables | Population | 3 Months | 6 Months | 9 Months | 12 Months | 15 Months | 18 Months | 24 Months | 30 Months |
|---|---|---|---|---|---|---|---|---|---|
| BMI (kg/m2) | Total | 1.2 [0.4–2.0] | 1.9 [1.0–2.9] | 2.0 [1.2–2.9] | 2.0 [1.1–2.9] | 2.2 [1.2–3.2] | 2.7 [0.9–4.6] | 1.9 [0.8–3.0] | 1.1 [−0.9–3.1] |
| Homozygous | 1.2 [−0.5–2.8] | 1.7 [0.1–3.4] | 2.1 [0.5–3.8] | 1.9 [0.1–3.8] | 2.3 [−0.3–4.8] | 2.4 [−0.3–5.0] | 3.1 [0.0–6.1] | NA | |
| Heterozygous | 1.2 [0.3–2.1] | 2.0 [0.9–3.1] | 2.0 [1.0–3.0] | 2.0 [1.0–3.0] | 2.0 [1.0–3.1] | 2.6 [0.5–4.6] | 1.6 [0.4–2.7] | 0.6 [−1.4–2.7] | |
| FVC ml | Total | 531.0 [279.2–782.9] | 613.9 [355.9–871.9] | 714.9 [449.7–980.1] | 689.0 [422.0–956.1] | 740.7 [447.9–1033.6] | 789.1 [509.0–1069.3] | 701.3 [369.2–1033.3] | 719.2 [114.4–1324.0] |
| Homozygous | 359.1 [−77.5–795.8] | 502.7 [39.2–966.3] | 438.5 [−45.7–922.6] | 468.6 [−17.7–954.9] | 20.4 [−642.4–683.1] | 259.4 [−443.5–962.3] | 398.6 [−454.4–1251.5] | NA | |
| Heterozygous | 591.3 [297.0–885.6] | 649.7 [348.6–950.9] | 797.0 [493.8–1100.1] | 728.5 [420.9–1036.0] | 793.3 [476.9–1109.8] | 785.8 [481.7–1089.8] | 669.2 [304.7–1033.7] | 643.0 [−13.2–1299.1] | |
| FVC% | Total | 12.8 [8.3–17.4] | 14.7 [10.0–19.3] | 14.7 [9.9–19.4] | 14.6 [9.7–19.6] | 15.6 [10.1–21.1] | 15.7 [10.4–20.9] | 13.2 [7.1–19.3] | 15.3 [3.6–27.1] |
| Homozygous | 11.4 [1.4–21.4] | 14.3 [3.8–24.9] | 12.1 [1.0–23.2] | 10.1 [−1.9–22.1] | 3.3 [−12.5–19.1] | 8.5 [−8.2–25.3] | 14.6 [−5.7–35.0] | NA | |
| Heterozygous | 13.3 [8.2–18.5] | 14.7 [9.5–19.9] | 15.4 [10.2–20.7] | 15.7 [10.3–21.1] | 17.2 [11.4–23.0] | 16.2 [10.6–21.7] | 12.7 [6.3–19.1] | 12.0 [−0.1–24.0] | |
| FEV1 ml | Total | 362.9 [203.5–522.3] | 428.1 [261.2–594.9] | 476.4 [299.9–652.8] | 389.6 [227.6–551.6] | 375.5 [202.1–548.8] | 430.4 [254.2–606.6] | 388.0 [185.3–590.7] | 296.8 [−77.8–671.3] |
| Homozygous | 244.2 [−59.4–547.8] | 325.6 [−0.9–652.0] | 359.6 [13.6–705.5] | 202.2 [−124.2–528.5] | 25.3 [−408.0–458.5] | 132.8 [−334.1–599.6] | 188.8 [−354.2–731.7] | NA | |
| Heterozygous | 408.3 [221.9–594.8] | 463.5 [269.2–657.7] | 513.9 [315.3–712.4] | 438.1 [252.8–623.5] | 420.7 [232.6–608.8] | 453.4 [261.1–645.7] | 399.3 [177.2–621.4] | 341.0 [−57.3–739.2] | |
| FEV1% | Total | 10.2 [6.1–14.2] | 12.4 [8.1–16.7] | 10.8 [6.8–14.9] | 9.0 [5.0–13.0] | 9.4 [4.9–13.9] | 10.1 [5.6–14.6] | 8.3 [3.2–13.3] | 4.5 [−5.2–14.2] |
| Homozygous | 7.0 [−1.5–15.6] | 9.5 [0.4–18.7] | 8.4 [−1.0–17.8] | 3.5 [−5.7–12.8] | 1.0 [−11.0–13.0] | 3.6 [−9.4–16.6] | 6.5 [−8.5–21.4] | NA | |
| Heterozygous | 11.3 [6.6–15.9] | 13.4 [8.5–18.3] | 11.7 [7.1–16.2] | 10.6 [6.2–15.1] | 11.1 [6.2–15.9] | 11.3 [6.5–16.2] | 8.8 [3.4–14.2] | 7.1 [1.8–12.3] | |
| CFQ-R respiratory | Total | 31.5 [24.5–38.6] | 34.2 [27.4–40.9] | NA | 30.6 [22.2–39.0] | 9.1 [−6.8–24.9] | 7.5 [−8.4–23.5] | 5.8 [−10.7–22.3] | NA |
| Homozygous | 31.7 [17.0–46.3] | 30.0 [16.1–43.9] | NA | 18.9 [−1.5–39.3] | −13.2 [−55.1–28.7] | −15.6 [−54.7–23.6] | −15.6 [−54.7–23.6] | NA | |
| Heterozygous | 31.3 [22.7–39.9] | 35.4 [27.5–43.3] | NA | 34.7 [25.5–43.9] | 16.4 [−0.5–33.3] | 16.1 [−0.7–33.0] | 13.7 [−4.4–31.9] | NA | |
| CFQ-R digestive | Total | 5.6 [−0.9–12.0] | 8.3 [2.1–14.4] | NA | 5.8 [−2.0–13.5] | −14.5 [−31.0–1.9] | −15.8 [−32.5–0.9] | −20.8 [−37.5–−4.1] | NA |
| Homozygous | 6.3 [−9.1–21.8] | 12.6 [−1.9–27.1] | NA | −0.7 [−22.0–20.5] | −36.2 [−77.9–5.6] | −43.3 [−70.5–−16.2] | −43.3 [−70.9–−15.8] | NA | |
| Heterozygous | 5.8 [−1.4–12.9] | 7.1 [−0.1–14.3] | NA | 8.6 [0.7–16.5] | −7.0 [−24.3–10.3] | −4.8 [−22.5–12.9] | −11.7 [−30.2–6.8] | NA | |
| CFQ-R vitality | Total | 22.0 [14.6–29.5] | 26.2 [19.0–33.5] | NA | 20.7 [12.0–29.4] | 4.4 [−11.2–19.9] | 1.9 [−13.7–17.5] | −0.1 [−15.9–15.7] | NA |
| Homozygous | 22.4 [5.9–38.9] | 22.9 [6.8–38.9] | NA | 12.6 [−8.2–33.4] | −20.1 [−48.6–8.4] | −23.5 [−50.5–3.4] | −22.5 [−49.8–4.7] | NA | |
| Heterozygous | 22.1 [13.1–31.0] | 27.4 [19.1–35.8] | NA | 23.8 [14.3–33.3] | 12.6 [−4.3–29.6] | 11.7 [−5.5–29.0] | 8.6 [−9.4–26.5] | NA | |
| CFQ-R physical activity | Total | 26.5 [18.6–34.4] | 31.4 [22.9–39.8] | NA | 27.3 [17.6–37.0] | 13.6 [−3.1–30.2] | 9.1 [−7.0–25.1] | 8.6 [−8.1–25.4] | NA |
| Homozygous | 36.7 [24.5–48.9] | 34.0 [19.8–48.1] | NA | 28.1 [8.4–47.7] | 2.4 [−40.4–45.3] | −7.8 [−32.3–16.6] | −4.7 [−39.3–29.9] | NA | |
| Heterozygous | 23.6 [13.5–33.7] | 31.1 [21.0–41.2] | NA | 27.9 [16.6–39.2] | 17.9 [2.4–33.3] | 16.5 [1.1–31.8] | 14.7 [−4.5–33.9] | NA | |
| CFQ-R food | Total | 11.8 [4.2–19.4] | 13.0 [5.6–20.4] | NA | 6.0 [−3.4–15.4] | −12.8 [−30.6–5.1] | −13.8 [−32.4–4.7] | −16.1 [−34.7–2.4] | NA |
| Homozygous | 14.2 [−3.4–31.8] | 9.6 [−9.6–28.8] | NA | 1.1 [−22.1–24.4] | −36.1 [−69.6–−2.6] | −40.6 [−72.5-−8.8] | −40.6 [−72.5-−8.8] | NA | |
| Heterozygous | 11.4 [2.8–19.9] | 14.4 [6.6–22.2] | NA | 8.2 [−2.1–18.4] | −4.7 [−23.7–14.3] | −3.1 [−23.2–17.0] | −6.3 [−26.8–14.2] | NA | |
| CFQ-R daily activities | Total | 15.3 [6.6–24.0] | 19.1 [11.2–27.0] | NA | 17.8 [8.4–27.3] | 1.5 [−15.7–18.6] | −3.5 [−20.3–13.4] | −4.4 [−21.9–13.0] | NA |
| Homozygous | 20.8 [4.1–37.4] | 23.0 [6.0–40.0] | NA | 10.8 [−11.7–33.3] | −22.8 [−57.0–11.3] | −29.8 [−61.6–1.9] | −29.8 [−61.6–1.9] | NA | |
| Heterozygous | 13.0 [2.6–23.5] | 17.8 [8.7–26.9] | NA | 20.3 [9.7–30.8] | 9.5 [−5.8–24.7] | 6.4 [−8.8–21.7] | 5.1 [−14.0–24.2] | NA | |
| CFQ-R treatment | Total | 13.5 [5.9–21.2] | 18.1 [10.1–26.0] | NA | 16.8 [8.5–25.2] | 9.0 [−5.3–23.3] | 3.9 [−10.1–17.9] | 2.0 [−12.1–16.1] | NA |
| Homozygous | 24.0 [10.5–37.5] | 30.4 [17.0–43.7] | NA | 21.5 [3.9–39.1] | 2.8 [−33.5–39.0] | −5.2 [−27.0–16.6] | −5.2 [−27.0–16.6] | NA | |
| Heterozygous | 10.8 [1.7–20.0] | 14.8 [5.3–24.2] | NA | 16.3 [6.8–25.7] | 11.9 [−1.3–25.1] | 8.7 [−4.7–22.1] | 6.1 [−10.4–22.5] | NA | |
| CFQ-R emotional | Total | 10.4 [3.4–17.4] | 13.5 [7.1–19.9] | NA | 8.2 [0.1–16.3] | −7.6 [−24.0–8.9] | −9.8 [−26.4–6.7] | −12.8 [−29.1–3.5] | NA |
| Homozygous | 16.6 [2.3–30.8] | 17.8 [4.6–30.9] | NA | 4.9 [−14.9–24.6] | −21.8 [−68.3–24.7] | −30.1 [−68.5–8.3] | −28.2 [−68.0–11.5] | NA | |
| Heterozygous | 8.6 [0.4–16.8] | 12.4 [4.7–20.2] | NA | 9.9 [1.0–18.8] | −2.5 [−19.8–14.8] | −1.5 [−19.2–16.2] | −6.3 [−23.9–11.3] | NA | |
Data are shown as mean difference between post-treatment time vs baseline time and the confidence interval (95%) for the absolute difference from the mean. Where a statistically significant difference (p<0.05) was found between the comparison times for each variable, these are marked in bold. BMI: body mass index; FVC: forced vital capacity; FEV1%: maximum exhaled volume during the first second of forced exhalation; CFQ-R: Cystic Fibrosis Questionnaire-Revised. NA: data not available.
For homozygous and heterozygous populations the mean difference showed that the effect of the treatment was maintained significantly more time for heterozygous population. BMI had a significant increase in the difference baseline – 6, 9, 12, and 24 months for the homozygous population and for all follow-up differences except for 30 months for heterozygous. The FVC of the homozygous population had a significant increase between the baseline and months 3–9 and FEV1 showed a significant increase only in the difference baseline–6 months. However, for heterozygous population the FVC and FEV1 showed a significant increase for the difference between baseline and 3–24 months and all follow-up, respectively.
For the homozygous group, the increase was significant for CFQ-R respiratory, vitality, daily activities, and emotional in the difference between baseline and 3 and 6 months, while CFQ-R physical activity and treatment had a higher significant increase (difference baseline vs 3–12 months). On the other hand, the items CFQ-R digestive and food showed a significant decrease for the difference baseline vs 18–24 months and 15–24 months, respectively.
For heterozygous group the increase was significant for CFQ-R respiratory, vitality, daily activities, treatment and emotional for the difference baseline vs 3–12 months, while CFQ-R physical activity had a higher significant increase for difference between baseline and 3–18 months. On the other hand, the items CFQ-R digestive showed a significant decrease for the difference between baseline and 24 months.
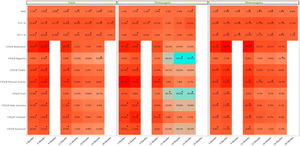
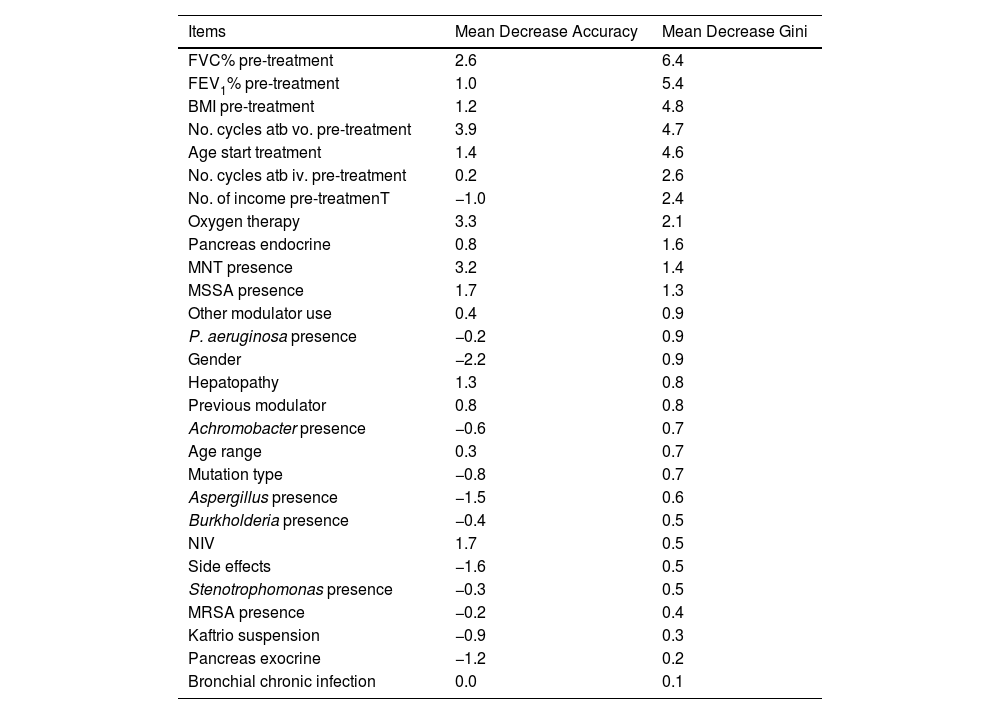
Factors Associated With the FEV1% ImprovingFinally, the individual determinants of the maximum FEV1% increase were evaluated. The FEV1% improvement value was obtained as the median FEV1% value at the latest time available (18, 24 or 30 months after treatment) for each patient versus baseline. To assess which variables have the most predictive power to the improvement a Random Forest (RF) model was conducted. RF model was performed for a set of 28 variables that could potentially be good predictors of FEV1% improvement. The assessment of the yielding of the training dataset showed an overall error rate of 29.12%, with an accuracy of 70.88%. The RF analysis provides the Mean Decrease Accuracy (MDA) and Mean Decrease Gini (MDG) indices of the predictors evaluated in each of the models (Table 5 and Fig. 3). We mainly use the MDG index for evaluating the significance of variables in relation to the response variable. MDG-based rankings offer more reliable outcomes than those of MDA.16
Associated Mean Decreases Accuracy (MDA) and Mean Decrease Gini (MDG) of High-importance Predictors of Improving FEV1%.
| Items | Mean Decrease Accuracy | Mean Decrease Gini |
|---|---|---|
| FVC% pre-treatment | 2.6 | 6.4 |
| FEV1% pre-treatment | 1.0 | 5.4 |
| BMI pre-treatment | 1.2 | 4.8 |
| No. cycles atb vo. pre-treatment | 3.9 | 4.7 |
| Age start treatment | 1.4 | 4.6 |
| No. cycles atb iv. pre-treatment | 0.2 | 2.6 |
| No. of income pre-treatmenT | −1.0 | 2.4 |
| Oxygen therapy | 3.3 | 2.1 |
| Pancreas endocrine | 0.8 | 1.6 |
| MNT presence | 3.2 | 1.4 |
| MSSA presence | 1.7 | 1.3 |
| Other modulator use | 0.4 | 0.9 |
| P. aeruginosa presence | −0.2 | 0.9 |
| Gender | −2.2 | 0.9 |
| Hepatopathy | 1.3 | 0.8 |
| Previous modulator | 0.8 | 0.8 |
| Achromobacter presence | −0.6 | 0.7 |
| Age range | 0.3 | 0.7 |
| Mutation type | −0.8 | 0.7 |
| Aspergillus presence | −1.5 | 0.6 |
| Burkholderia presence | −0.4 | 0.5 |
| NIV | 1.7 | 0.5 |
| Side effects | −1.6 | 0.5 |
| Stenotrophomonas presence | −0.3 | 0.5 |
| MRSA presence | −0.2 | 0.4 |
| Kaftrio suspension | −0.9 | 0.3 |
| Pancreas exocrine | −1.2 | 0.2 |
| Bronchial chronic infection | 0.0 | 0.1 |
FVC: forced vital capacity; FEV1%: peak expiratory volume during the first second of forced expiration; BMI: body mass index; Atb: antibiotics; MNT: Mycobacteria non-tuberculous; MSSA: methicillin-sensitive Staphylococcus aureus; MRSA: methicillin-resistant Staphylococcus aureus; NIV: non-invasive ventilation.
 plot showing relevant predictors of FEV1% improving using Mean Decrease Gini index (MDG). A higher increase in Mean Decrease Gini corresponds to higher importance in the model. FVC: forced vital capacity; FEV1%: peak expiratory volume during the first second of forced expiration; BMI: body mass index; Atb: antibiotics; MNT: Mycobacteria non-tuberculous; MSSA: methicillin-sensitive Staphylococcus aureus; MRSA: methicillin-resistant Staphylococcus aureus; IV: invasive ventilation; NIV: non-invasive ventilation.")
Random Forest (RF) plot showing relevant predictors of FEV1% improving using Mean Decrease Gini index (MDG). A higher increase in Mean Decrease Gini corresponds to higher importance in the model. FVC: forced vital capacity; FEV1%: peak expiratory volume during the first second of forced expiration; BMI: body mass index; Atb: antibiotics; MNT: Mycobacteria non-tuberculous; MSSA: methicillin-sensitive Staphylococcus aureus; MRSA: methicillin-resistant Staphylococcus aureus; IV: invasive ventilation; NIV: non-invasive ventilation.
This paper presents data from a Spanish multicentre study in patients with advanced disease who received ETI as part of an early access programme showing follow-up beyond 48 weeks. We showed that the improvement in lung function, BMI and the reduction of potentially pathogenic microorganisms, especially MSSA, P. aeruginosa, and Aspergillus sp. were maintained up to 30 months. We also note that recovery was superior in the heterozygous group in all parameters analysed. However, in quality of life, although at the beginning all CFQ-R scores, in all domains, improved, this improvement was attenuated over time after 12 months, being more striking in the homozygous patients.
The number of cycles of vo. and iv. were reduced during the year before and after the onset of ETI, with no significant differences between the homozygous and heterozygous groups when assessed globally, although it showed a higher reduction in the homozygous group.
In this profile of patients with severe CF, several experiences have been published, such as that of an Irish centre (St Vincent's University Hospital)6 with 14 patients analysing a follow-up period of 4.9±1.94 months, where a functional and BMI improvement was observed, as well as a reduction of sweat chloride concentration and exacerbations compared to the previous year. The largest patient series is from the French Network, which included all 47 centres in the country with 245 adult patients with FEV1% of 29%. The mean absolute increase in FEV1% was +15.1 (CI95%: +13.8 to +16.4; p<0.0001), and in weight was +4.2kg (CI95%: +3.9 to +4.6; p<0.0001).7 A relevant aspect evaluated was how the number of patients requiring long-term oxygen, NIV and/or enteral tube feeding decreased by 50%, 30% and 50%, respectively (p<0.01). Of the total, 16 patients were on the active transplant list and 37 were undergoing transplant evaluation at baseline, two received a transplant, one died and five patients remained on the transplant list after starting treatment.
Compared to the previous 2 years in France, they observed a halving in the number of lung transplants performed in CF patients in 2020. In our series, we observed a 40% reduction in the use of oxygen therapy and that only 20% of the 65 patients referred for lung transplantation remained on the active transplant list. Of the 114 patients, three patients died.
The same authors analysed the patients’ perspective in different areas, using a 13-item questionnaire. Of the 245 patients who started ETI, 101 (41%) responded to the questionnaire, with a mean treatment duration of 4.3 [3.0–5.6] months. Patients generally reported a rapid impact on respiratory symptoms, sleep quality, general well-being and physical self-esteem, and a reduction in overall treatment burden. Most patients contrasted treatment burden, symptom severity, depression and a closed future marked by death or transplantation prior to ETI with significant and rapid physical strength, leading to increased self-confidence, autonomy and long-term planning after treatment initiation. A small number of patients expressed concerns, mainly regarding changes in body representation and/or fear of becoming dependent on treatment.8
The series from three Italian centres, albeit with a small number of patients (26 in total) showed a follow-up of 48 weeks.9 An improvement in FEV1% was described in 1206 (CI95%: 8.54, 1557) after 4 weeks of treatment, of 1532 (CI95%: 11.3, 1934) after 24 weeks and 1448 (CI95%: 1064, 1832) after 48 weeks. The increase in FEV1% was accompanied by a decrease in sweat chloride concentration, an improvement in BMI and a marked reduction in exacerbations. In our case, we observed that the improvement in functional and anthropometric parameters was still observed up to 30 months. However, quality of life scores in all domains started to decline after 12 months.
A very relevant aspect of our work is the exhaustive analysis of the microbiological follow-up in this severe patient profile. The three main bacteria with the highest presence at the beginning of the study (12 months before treatment) were P. aeruginosa (60.5%), MSSA (47.4%) and A. xylosoxidans (17.5%), maintaining this range at 6 months prior to treatment. The analysis of the percentage of microbiological isolates, between 12 months before the onset of ETI and 30 months after, showed a decrease in all microorganisms isolated, with the reduction being significant for MSSA (−63.9%), P. aeruginosa (−100.0%) and Aspergillus sp. (−79.3%). This is probably explained by the improvement of mucociliary clearance with CFTR functioning with ETI. Likewise, P. aeruginosa reduction has been described in a study of patients with severe functional impairment treated with ivacaftor treatment and mutations gating (non-functional surface CFTR protein).10 In a small study of 20 patients homozygous for F508del on lumacaftor-ivacaftor treatment, showed a non-significant decrease of P. aeruginosa.11 We observed in 144 patients treated with tezacaftor–ivacaftor a reduction of different microorganisms, among them the greatest reductions were for non-tuberculous mycobacteria (−66.7%), Haemophilus influenzae (−66.7%), Stenotrophomonas maltophilia (−53.8%), Aspergillus sp. (−35.7%) and MSSA (−25.0%).12
Clinical results in patients homozygous and heterozygous for F508 who started ETI already showed a better response in the heterozygous group at 24 weeks, as in the respective pivotal studies.4,13,14 We consider the present work to be novel as it shows the difference between the two groups that had not been analysed in real life.
Another notable aspect highlighted in this work was the evaluation of the factors that have the greatest impact on FEV1% improvement. The most relevant variables were lung function (FVC%, FEV1%), BMI, previous antibiotic treatment courses and age at treatment initiation, as well as oxygen therapy prescription, among others. The French article compares the populations of patients who improved a FEV1% greater than or equal to 13% after ETI vs. those who did not. This study concluded that patients with lower improvement (of FEV1% <13) were significantly older (p<0.001) and more likely to be treated with long-term oxygen therapy (p<0.001) and/or NIV (p=0.006).7,15
Regarding the adverse effects of ETI, our study showed that it is generally safe and has an acceptable side-effect profile. The majority of patients had mild to moderate adverse events (15%), of which 50% of patients showed liver and skin rash problems (29.4%). Adverse events leading to discontinuation of ETI occurred in only 4 patients for hypertransaminemia similar to the data observed in the clinical trial.14
The strengths of our study include a large number of patients, multicenter, a long follow-up period of 30 months and an analysis of previously unevaluated aspects such as microbiology, differences between homo- and heterozygous F508del groups and the assessment of factors related to FEV1% improvement in this patient profile with advanced disease.
Limitations of the study include a small number of subjects <12 years of age for group comparison, only one third of the patients had completed 30 months of follow-up and chloride concentrations were not analysed.
Another limitation to take into account is that given the timing of the study (COVID-19 pandemic), it could have an influence on the results obtained. However, our findings are consistent with those published in pivotal clinical trials.4,14 Consequently, we believe that the effect that the COVID-19 pandemic may have had on the findings is of little relevance, as preventive measures are a common measure routinely used by these patients.
ConclusionsTo our knowledge, the current data provide the first long-term evidence of ETI in CF patients with advanced lung disease. Clinical and nutritional improvement as well as reduction of micro-organisms was sustained up to 30 months and was superior in heterozygous patients. Quality of life scores became lower after 12 months and were more striking in F508del homozygous. Previous lung function, BMI, previous exacerbations, age at treatment initiation as well as oxygen therapy were factors influencing the observed improvement in FEV1%. Longer studies with larger numbers of patients and from different countries provided by CF registry data would be recommended.
Conflict of InterestsThe authors state that they have no conflict of interests.