


Saharan dust meets the Canary Islands at the beginning of its westward path across the North Atlantic, exceeding the European daily levels for PM10; for this reason, their two provincial capital cities, constitute optimal sites where to evaluate the health effects of this natural event.
ObjectivesTo assess the short-term association between Saharan Dust Days (SDDs) and respiratory morbidity in the two capital cities.
MethodsWe carried out a time-series analysis with daily emergency hospital admissions due to all respiratory system diseases, chronic obstructive pulmonary disease (COPD) and asthma between 2001 and 2005, assessing the independent effect of SDDs, defined according to the application of the methodology accepted by the European Environmental Office. We also examined accumulated effect, and some other specific SDDs’ features.
ResultsWe found a short-term association between SDDs and the increase in admission risk for the three outcomes during concurrent SDDs, compared to non-SDDs, that spread from 0 to 5th day: 22.6% (95% confidence interval [CI], 10.4, 36.0) for all respiratory diseases and 29.9% (95%CI: 6.6, 58.4) for COPD in Santa Cruz de Tenerife, and 33.4% (95%CI: −2.1,82.0) for asthma in Las Palmas de Gran Canaria. We obtained a robust association when Saharan dust transported at low altitude, when SDDs belonged to long episodes (≥5days), from the fifth SDD onwards and those SDDs with medium (50<PM<150) or high (≥150) PM10 levels.
ConclusionsWe found evidence that SDDs carry a risk of emergency hospital admission from respiratory diseases in the Canary Islands.
El polvo del Sahara se encuentra con las Islas Canarias al comienzo de su viaje en dirección oeste atravesando el Atlántico Norte; esto hace que se superen los niveles límite diarios europeos de PM10. Por este motivo, sus 2 capitales de provincia constituyen entornos óptimos para evaluar los efectos de este fenómeno natural en la salud.
ObjetivosEvaluar la asociación a corto plazo entre los días de calima sahariana (DCS) y la morbilidad respiratoria en las 2 ciudades.
MétodosLlevamos a cabo un análisis de series temporales con los ingresos hospitalarios urgentes diarios debido a todas las enfermedades del sistema respiratorio, enfermedad pulmonar obstructiva crónica (EPOC) y asma entre 2001 y 2005, evaluando el efecto independiente de los DCS, que definimos siguiendo la aplicación de la metodología aceptada por la Oficina Europea del Medio Ambiente. También estudiamos el efecto acumulado y otras características específicas de los DCS.
ResultadosEncontramos una asociación a corto plazo entre los DCS y el aumento en el riesgo de ingreso para las 3 variables durante los DCS concurrentes, en comparación con los no DCS, que se extendía desde 0 a los 5 días: 22,6% (intervalo de confianza [IC] del 95%: 10,4-36,0) para todas las enfermedades respiratorias, el 29,9% (IC 95%: 6,6-58,4) para la EPOC en Santa Cruz de Tenerife y el 33,4% (IC 95%: −2,1-82,0) para asma en Las Palmas de Gran Canaria. Obtuvimos una asociación fuerte cuando el polvo del Sahara se transportaba a baja altitud, cuando los DCS formaban parte de episodios largos (≥5 días), desde el quinto DCS en adelante y aquellos DCS con niveles de PM10 medios (50<PM<150) o altos (≥150).
ConclusionesDemostramos que los DCS conllevan un riesgo de ingreso hospitalario de emergencia por enfermedades respiratorias en las Islas Canarias.
The Canary Islands are probably one of the areas located outside the African mainland most affected by Saharan dust. Their citizens have always unerringly perceived that Saharan dust has an impact on health, worsening respiratory conditions.
African dust is transported over long distances and meets these Islands (100km from the western coast of Morocco) at the beginning of its westward path across the North Atlantic Ocean to The Caribbean, North and South America.1 During Saharan dust episodes (SDEs), daily particulate matter (PM) concentrations in both capital cities rise for several days, exceeding the European daily limit value for PM10 (50μg/m3).
The existence of an association between the urban exposure to anthropogenic PM in continental cities (dominated by PM2.5) and respiratory outcomes has been widely documented.2 Fewer studies have evaluated this association with coarse particles (particles with an aerodynamic diameter between 2.5 and 10mm; PM10–2.5). Brunekreef and Forsberg3 concluded that PM10–2.5 (mainly constituted by desert dust, crustal material, sea salt, pollen, spores, fly ash, and plant and insect parts) has as strong short-term effect as PM2.5. However, only several tens of the articles examining this association have been published. Most of them, concentrate on Southern European countries and some others have been carried out in the Caribbean. Some authors have highlighted the need to carry out studies in areas closer to dust sources.4–6
The provincial capitals of the Canary Islands [Las Palmas (L/P) de Gran Canaria and Santa Cruz (S/C) de Tenerife] constitute two optimal urban environments to assess the impact of Saharan dust on health; firstly, their citizens are exposed to a high frequency of Saharan dust days (SDDs) as well as higher levels of natural PM compared to other European cities due to their proximity to the western Sahara (200km); and secondly, with respect to other urban environments located in west Africa, they have systematic and consolidated air quality and health information systems in accordance with European regulations. Preliminary work has shown that in both cities there is a short-term association between daily levels of PM10, PM10–2.5 and PM2.5 with an increased risk of heart and respiratory morbidity and mortality and the lack of confounding by gases or between PM fractions.7–9
The aim of this study is to assess the short-term association between SDDs and emergency hospital admissions due to all respiratory system diseases (ARSD), chronic obstructive pulmonary disease (COPD) and asthma, in the cities of L/P de Gran Canaria and S/C de Tenerife according to the type, stage and intensity of SDDs as well as the duration of the episodes.
MethodsDesignThis is a time-series study with the day as unit of analysis and aggregate data at the city level during the period 2001–2005.
SettingL/P de Gran Canaria and S/C de Tenerife are in the northeastern areas of the islands of Gran Canaria and Tenerife, respectively, approximately 200km. off the northwest African coast (see supplemental material, Figure S1). They are characterized by very mild temperatures with low seasonal variation (7°C difference in daily average between the warmest and coldest months, Fig. S2). L/P de Gran Canaria, (374,000 inhabitants) is located largely on an isthmus that allows free circulation of the northeast trade winds, providing regular dispersive conditions and without industrial sources of air pollution. In S/C de Tenerife, 219,000 inhabitants), such dispersive conditions are diminished because The Anaga Massif surrounds the city on its north/northwest side. In addition, there was the added influence of a local oil refinery.
Air Pollution, Meteorological and Covariate DataDaily emergency hospital admissions of both cities’ residents between January 1, 2001 and December 31, 2005 were provided by the Canary Islands Regional Health Authority. The emergency hospital admissions with primary diagnosis [International Classification of Diseases, 9th Revision (ICD-9); World Health Organization] for: (1) ARSD [ICD-9: 460–519], (2) COPD [ICD-9: 490–492, 494–496] and (3) asthma [ICD-9: 493] were considered. Weekly influenza counts were provided by the Regional Epidemiological Surveillance System. Data on PM were obtained from the Canary Islands Air Quality Network (CIAQN). Two monitoring sites were selected in S/C de Tenerife and one in L/P de Gran Canaria (94% of valid days). PM10-2.5 concentrations were calculated as the difference between daily PM10 and PM2.5 means. Daily mean temperature (°C), relative humidity (%) and barometric pressure (mbar) for each city were provided by the National Meteorological Agency.
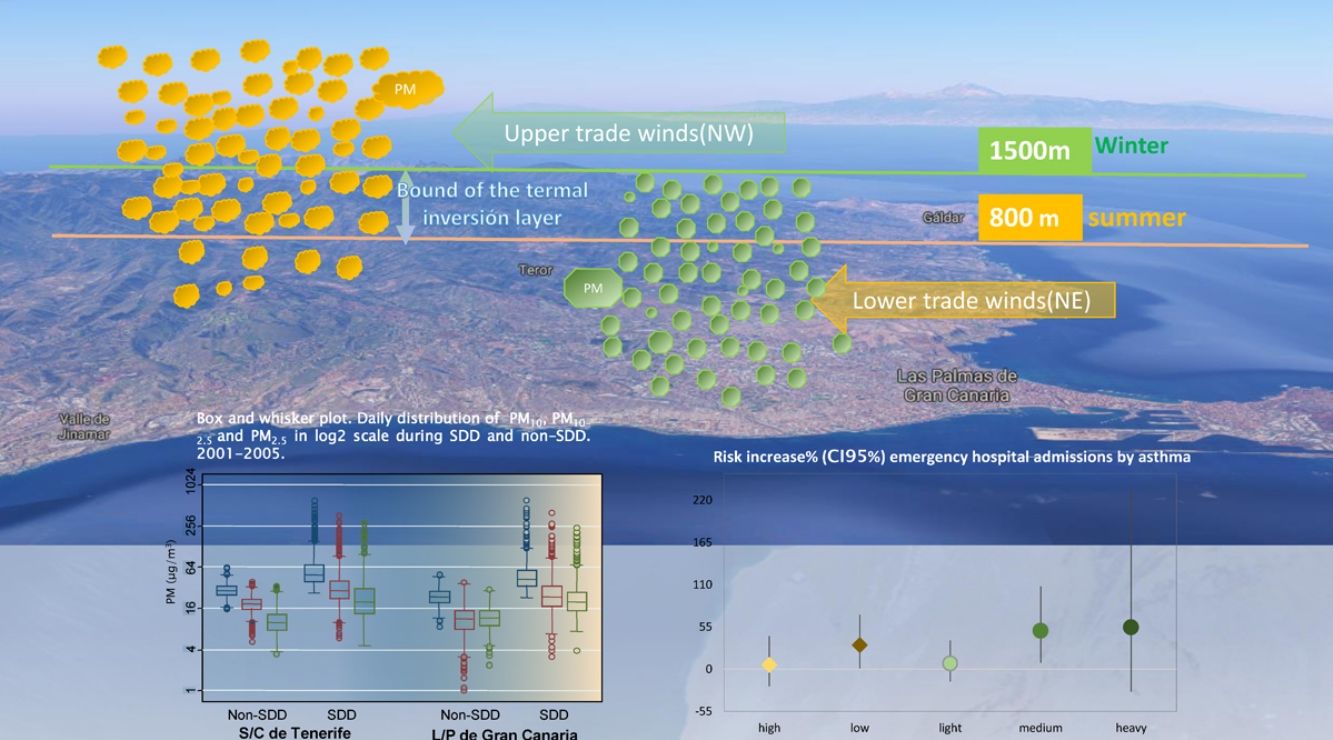
Sahara Dust AdvectionsThe low troposphere over the Islands is strongly stratified. The thermal inversion layer that limits the top of the fresh and wet marine boundary layer (MBL) is located at an approximate height of 800m above sea level during the summer and at 1500 during the winter. This feature is essential in order to understand the levels of particles that can be reached; some authors have described two main types of African dust intrusions over the Canary Islands: low altitude in winter (October to March) and high altitude atmospheric intrusions in summer (April to September).10,11 This means that in summer, this transport affects coastal cities for gravitational deposition from high altitude, whereas in winter, with the increase in the height of the thermal inversion layer, the transport takes place within the MBL and consequently very high levels of particulate matter can be registered.
Saharan Dust Days, SDDsDates with confirmed Saharan dust intrusion over the Canary Islands’ atmosphere (at a regional level), were obtained from the Directorate-General for Environmental Quality & Assessment at the Ministry for Agriculture, food and Environment, available at (http://www.calima.ws/, last accessed May 17th, 2017). Saharan dust intrusion assessment is based on operational models [through back-trajectory analysis (Hysplit model), information from NRL SKIRON and BSCDREAM dust maps] and satellite images provided by the NASA SeaWiFS. This procedure is the result of the application of the methodology accepted by the UE Environmental Office.12 In order to determine if Sahara dust advections impacted on PM concentrations at ground levels, the previous data were revised and combined with local information on air pollutant series and meteorological information by CIAQN experts.
Other VariablesAiming to evaluate whether the association between SDD and hospital admissions was different regarding specific features of the SDDs, additional categorical variables were defined:
“Type”, factor with three categories according to the altitude of the African dust transport [0: “non-SDD”; 1: “high altitude SDD”, SDD occurring from April to September; 2: “low altitude SDD”, from October to March]. This classification matches the categories “warm and cold months” carried out by other authors.
“Intensity”, factor with four categories according to the daily average of PM10 during an SDD [0: “non-SDD”; 1: “light SDD”, SDD with PM10<50μ/m3; 2: “medium SDD”, SDD with PM10 between 50 and 150μ/m3; 3: “heavy SDD”, SDD with PM10≥150μ/m3].
“Duration”, factor with three categories according to the length of the SDE in which the SDD is located [0: “non-SDD”; 1: “short episode SDD”, SDD belonging to a SDE fewer than 5 days; 2: “long episode SDD”, SDD belonging to a SDE of 5 or more SDDs].
“Stage”, factor with three categories according to the position of the SDD within the SDE [0: non-SDD; 1: “early SDD”, from current to fourth SDD; 2: “late SDD”, from fifth SDD onwards).
Statistical AnalysisIn each city Generalized Additive Models (GAM) in Poisson regression for ARSD and in negative binomial regression for COPD and asthma were adjusted (core models). Long-term trend and seasonality were non-parametrically controlled by using smoothing functions of time as explanatory variable. Potential confounding caused by daily influenza counts, temperature, humidity and calendar variables was also controlled as well as possible residual autocorrelation. Cumulative pattern of the association between SDD and emergency admission risk was examined by means of third-degree polynomial distributed lag models until five days after de exposure (PDLM05). Once the core model for each cause of hospitalization and city was adjusted, each SDD categorical variable was introduced into the model. The significance of these variables was tested by likelihood ratio (LR) test (P≤.05).
The PM fractions (PM2.5, PM10-2.5, and PM10) effect on hospital admission in the presence and absence of SDD was explored using an interaction term between the SDD indicator (yes/no) and each of the lag 0 PM fractions. All interaction terms with P<.15 were considered statistically significant.13,14
The effect-size estimates were expressed as the percentage of change and 95% confidence interval (95%CI) in emergency hospital admission risk in SDDs with respect to non-SDD. All analyses were carried out using R 2.12.2 statistical analysis software (R Project for Statistical Computing, http://www.r-project.org).
ResultsData DescriptionFrom 2001 to 2005, 32% of total days were classified as SDDs. As shown in Fig. 1, during cold months, the number of SDDs was more frequent and PM fractions levels, higher. The average duration of Saharan dust episodes (consecutive SDDs) was 4.2 days (range 1–23). In both cities (Fig. 2), more than 50% of SDDs, were classified as low altitude SDDs, light SDDs, long episode SDDs and early SDDs. Table S1 shows the episodes with heavy SDDs and their duration, Figure S3 illustrates the SDEs occurred between January 1th and March 2004 31st.
 Monthly distribution of daily average and 95%CI (μg/m3) of PM10 (shown in light circles) and PM10-2.5 (shown in dark rectangles) during Saharan Dust Days (2001–2005). (B) Monthly frequency of Saharan dust days (2001–2005).")

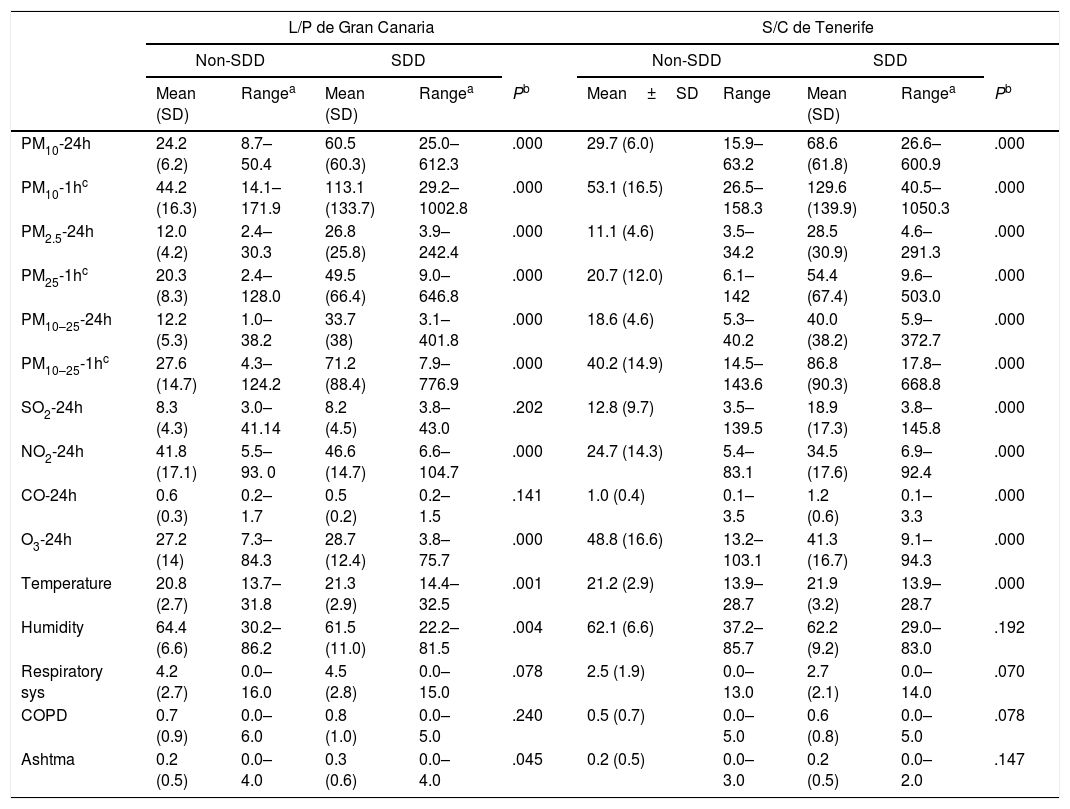
Table 1 shows the summary statistics for the study's variables. Significantly higher average levels during SDDs were found for all PM fractions (from 2.1 to 2.8-fold higher with respect to non-SDDs), for NO2 and temperature in both cities.
Descriptive Statistics on Air Pollution, Daily Emergency Hospital Admission Counts and Weather Variables for Each City, 2001–2005.
| L/P de Gran Canaria | S/C de Tenerife | |||||||||
|---|---|---|---|---|---|---|---|---|---|---|
| Non-SDD | SDD | Non-SDD | SDD | |||||||
| Mean (SD) | Rangea | Mean (SD) | Rangea | Pb | Mean±SD | Range | Mean (SD) | Rangea | Pb | |
| PM10-24h | 24.2 (6.2) | 8.7–50.4 | 60.5 (60.3) | 25.0–612.3 | .000 | 29.7 (6.0) | 15.9–63.2 | 68.6 (61.8) | 26.6–600.9 | .000 |
| PM10-1hc | 44.2 (16.3) | 14.1–171.9 | 113.1 (133.7) | 29.2–1002.8 | .000 | 53.1 (16.5) | 26.5–158.3 | 129.6 (139.9) | 40.5–1050.3 | .000 |
| PM2.5-24h | 12.0 (4.2) | 2.4–30.3 | 26.8 (25.8) | 3.9–242.4 | .000 | 11.1 (4.6) | 3.5–34.2 | 28.5 (30.9) | 4.6–291.3 | .000 |
| PM25-1hc | 20.3 (8.3) | 2.4–128.0 | 49.5 (66.4) | 9.0–646.8 | .000 | 20.7 (12.0) | 6.1–142 | 54.4 (67.4) | 9.6–503.0 | .000 |
| PM10–25-24h | 12.2 (5.3) | 1.0–38.2 | 33.7 (38) | 3.1–401.8 | .000 | 18.6 (4.6) | 5.3–40.2 | 40.0 (38.2) | 5.9–372.7 | .000 |
| PM10–25-1hc | 27.6 (14.7) | 4.3–124.2 | 71.2 (88.4) | 7.9–776.9 | .000 | 40.2 (14.9) | 14.5–143.6 | 86.8 (90.3) | 17.8–668.8 | .000 |
| SO2-24h | 8.3 (4.3) | 3.0–41.14 | 8.2 (4.5) | 3.8–43.0 | .202 | 12.8 (9.7) | 3.5–139.5 | 18.9 (17.3) | 3.8–145.8 | .000 |
| NO2-24h | 41.8 (17.1) | 5.5–93. 0 | 46.6 (14.7) | 6.6–104.7 | .000 | 24.7 (14.3) | 5.4–83.1 | 34.5 (17.6) | 6.9–92.4 | .000 |
| CO-24h | 0.6 (0.3) | 0.2–1.7 | 0.5 (0.2) | 0.2–1.5 | .141 | 1.0 (0.4) | 0.1–3.5 | 1.2 (0.6) | 0.1–3.3 | .000 |
| O3-24h | 27.2 (14) | 7.3–84.3 | 28.7 (12.4) | 3.8–75.7 | .000 | 48.8 (16.6) | 13.2–103.1 | 41.3 (16.7) | 9.1–94.3 | .000 |
| Temperature | 20.8 (2.7) | 13.7–31.8 | 21.3 (2.9) | 14.4–32.5 | .001 | 21.2 (2.9) | 13.9–28.7 | 21.9 (3.2) | 13.9–28.7 | .000 |
| Humidity | 64.4 (6.6) | 30.2–86.2 | 61.5 (11.0) | 22.2–81.5 | .004 | 62.1 (6.6) | 37.2–85.7 | 62.2 (9.2) | 29.0–83.0 | .192 |
| Respiratory sys | 4.2 (2.7) | 0.0–16.0 | 4.5 (2.8) | 0.0–15.0 | .078 | 2.5 (1.9) | 0.0–13.0 | 2.7 (2.1) | 0.0–14.0 | .070 |
| COPD | 0.7 (0.9) | 0.0–6.0 | 0.8 (1.0) | 0.0–5.0 | .240 | 0.5 (0.7) | 0.0–5.0 | 0.6 (0.8) | 0.0–5.0 | .078 |
| Ashtma | 0.2 (0.5) | 0.0–4.0 | 0.3 (0.6) | 0.0–4.0 | .045 | 0.2 (0.5) | 0.0–3.0 | 0.2 (0.5) | 0.0–2.0 | .147 |
Fig. 3 shows the estimated percentage change and 95%CI in risk of hospitalization associated with SDD at lag 0 and for PDLM05 in both cities. Overall, both models showed a positive pattern of association. In S/C de Tenerife, the risk of admission due to ARSD increased on the current [7.9% (95%CI: 0.4, 15.9)] and during the 5 next days: 22.6% (95%CI: 10.4, 36.0). Harmful SDDs according to the features previously described (Fig. 4) were: SDDs at late stage and those belonging to long episodes, low altitude SDDs and medium and heavy SDDs. In both cities, a linear trend in the estimates was appreciated regarding intensity (the higher intensity, the bigger effects).
 with respect to non-SDD.")

With respect to emergency COPD admissions, a very similar pattern was found (Figs. 3 and 4), unless a significant effect was also observed in L/P de Gran Canaria for SDDs in the highest category of intensity.
Regarding emergency admissions due to asthma, no association was found in S/C de Tenerife. In L/P de Gran Canaria, the cumulative effect (PDLM05) was marginally significant: 33.4% (CI95%: −2.1, 81.9) (Fig. 3), and according to the specific features of the SDDs, the SDDs's categories with highest effect were: low altitude and medium/heavy SDDs (Fig. 4).
Table S2 shows the effect modification of PM fractions caused by SDD. During non-SDDs, no statistically significant PM effects were observed on hospital admissions due to the analyzed causes. In both cities, during SDDs, the estimated effects on COPD admissions were positive and statistically significant for all PM fractions as well as the estimated effects for PM2.5 on ARSD admissions, however none of the interaction terms were statistically significant, being close to significance the interaction with PM10 for ARSD in S/C de Tenerife (P=.18).
DiscussionOur results show that, overall, there is a solid pattern of short-term association spreading over successive days, between the exposure to SDDs and respiratory emergency hospital admissions in both cities. We found that during an SDD, the risk of being hospitalized due to ARSD and COPD increases in S/C de Tenerife and the risk of asthma hospitalizations increases in L/P de Gran Canaria compared to non-SDDs. Our findings suggest the existence of different effect on the three analyzed outcomes according to some features of SDDs: during low SDDs, the risk of being hospitalized for ARSD and COPD in S/C de Tenerife and asthma in L/P de Gran Canaria, significantly increased with respect to non-SDDs. Both cities are located at sea level, so during low SDDs, Saharan dust has a higher impact on local particulate matter levels (worsening the air quality) than those recorded during high SDDs in summer. The intensity of the SDD also determined the probability of emergency admission, so that SDDs with medium or high PM10 daily levels associated with higher risk estimates than light SDDs. Finally, we also observed that for ARSD and COPD, effect-size estimates were higher on late SDDs and when SDDs belonged to long episodes.
Most of the studies assessing the possible health effects of SDD, have been carried out in cites located in Southern Europe and have analyzed the short-term effect on daily mortality. Only three analyzed SDD as an independent risk factor on daily admissions: in Nycosia, Middleton et al.15 found a 10.4% increase (95%CI: −4.7, 27.9) in the risk of hospitalization on dust days for cardiovascular disease. MED-PARTICLE project16 found weak evidence of dust being a risk factor per se for respiratory admissions: 0.85% (95% CI: −0.75, 2.47%), we found higher effect-size estimates: 7.9% (95%CI: 0.4, 15.9) in S/C de Tenerife. Zauli Sajani et al.,17 in Emilia-Romagna, concluded that Saharan dust showed an increased risk of respiratory mortality for people aged 75 or older.
In Be’er Shera, Israel, Vodonos et al.18 identified 445 dust storm days and found a 16% (95% CI: 8.0, 24) risk increase for admissions due to COPD during concurrent SDD, in line with our findings. In our study, the estimated risks for COPD are globally positive for the different indicators analyzed. In Tenerife, the prevalence of COPD is 6.1% (95%CI: 3.8, 8.8) and 8.4% (95%CI: 6.4, 10.6) in Gran Canaria19 while in the rest of Spain the estimated prevalence is 10.2%.20 This fact suggest that our estimated risks cannot be attributed to the existence of a high proportion of vulnerable population to SDD exposure due to COPD and may support the hypothesis of the potential capability of SDD to trigger COPD.
Asthma has also been associated with exposure to SDD; this fact is corroborated by local health professionals during their clinical practice, who consider it one of the triggers of this disease. A higher prevalence of asthma (between 15. 4 and 25%) has been reported in areas exposed to dust episodes such as Kuwait,21 United Arab Emirates,22 Saudi Arabia23 or Qatar.24 Julià Cerdà et al.25 have estimated that, in the adult population, the prevalence of asthma in the Canary Islands is 17.2% (95%CI: 16.3, 18.1) compared with an average of 5% of the whole of Spain. For that reason, it seems that there is a large population susceptible to the Saharan dust effects, generating a public health problem. Our estimate of accumulated effect on asthma admissions, from day 0 to 5 was 29.9% (95%CI: 6.6, 58.4). This impact has been studied thousands Km away from the Sahara Desert, in the Caribbean. In Trinidad26,27 and Grenada,28 an association between SDD and pediatric asthma emergency room visits was found, meanwhile Prospero et al.,29 did not find any association in Barbados. In Kuwait, Thalib et al.30 reported 7% (95%CI: 2.0, 12.0) increase in admission risk by asthma, under the influence of the same day SDD, which is consistent with our results. Some of the studies examining the effect of Asian dust have analyzed its effect on the risk of being hospitalized: due to asthma, in Taipei31,32 that estimated a 0.92% (95% CI: 0.81, 6.41) risk increase and due to COPD33: 5.7% increase (95% CI: −2.0, 13.8), although evidence was limited because the exposure assessment was inadequately described and potential confounders were insufficiently controlled.34 In Japan, Kanatani et al.35 reported an association between heavy dust events with the risk of asthma admissions for children with asthma [83%(95CI: 31, 156)].
In the Canary Islands, several studies have characterized the composition of PM, quantifying the mineral load on the bulk PM10 during SDDs (76%–78%) and non-SDDs (26%).36,37 The biogenic load of Saharan particles has also been analyzed38,39; Rodríguez et al.40 observed that dust particles in the free troposphere at the Izaña Global Atmospheric Watch/Observatory (Tenerife) can carry anthropogenic pollutants such as nitrate, sulphate and ammonium from the crude oil refineries and the phosphate based fertilizer industry and power plants located in the Atlantic coast of Morocco, northern and eastern Algeria and Tunisia. We observed that on SDDs particulate matter effect was stronger than those on non-SDDs, enhancing the hospital admissions risk due to ARSD and COPD associated with particulate matter.
The relatively low number of daily counts of emergency hospital admissions limits our ability to draw precise conclusions about size estimates but global and robust patterns of association can be considered. One of our major strengths is the use of the standard methodology for the detection of SDDs, besides the fact that our cities located very close to the Sahara Desert, with a greater number of SDDs and with higher PM levels than those conducted in other European cities. Likewise, with respect to other urban environments in west Africa, we have information systems on exposure (PM, episodes characterization) and on hospital admissions, absolutely consolidated and in accordance with European Union standards.
In Spain, a system of “prediction of Saharan dust intrussions” exists at national level, as well as some measures currently carried out at local level, such us monitoring, an early warning system for SDDs from the health and environmental authorities to the citizens and their recommendations to reduce exposure. The high prevalence of asthma in the Canary Islands and the positive association between this disease and COPD with SDDs observed in this research, highlights the importance that those strategies should be implemented.
In conclusion, our results provide evidence that an SDD carries a risk of emergency hospital admission from respiratory diseases in the Canary Islands that spreads over successive days. Our analyses indicate that observed association is robust during SDDs with medium or high PM10 levels, when African air masses are transported at low altitude, when SDDs belong to long episodes and from the fifth SDD onwards.
FundingThis work was supported in the course of study by the Canarian Research and Health Foundation, in Spanish: Fundación Canaria de Investigación y Salud (FUNCIS) PI/42/08. FUNCANIS FUNCIS has not participated in the study design or the collection, analysis, interpretation of data, drafting the article or the decision to submit the article for publication.
Conflict of InterestThe authors declare that they have no known competing financial interests or personal relationships that could have appeared to influence the work reported in this paper.
The authors wish to thank the Dirección General de Programas Asistenciales for data from the Conjunto Mínimo Básico de Datos Database (CMBD), the Regional Epidemiological Surveillance System, for the provision of weekly influenza counts and the Meteorological Estate Agency (AEMET) for the supply of meteorological data. Sincere thanks are given to Dolores García for her kind assistance in reviewing air pollutant data and to Geraldine Boylan for revising the text in English.
The following are the supplementary data to this article:


