


Peripheral oxygen saturation (SpO2) measured by pulse oximetry is widely used in clinical practice, but its fluctuations over the course of the 24h of a day have not been explored at length. Recently, we reported that children hospitalized due to non-cardiopulmonary causes had a circadian variation in SpO2. This finding needed to be corroborated in healthy children, which is the objective of the present study.
Patients and methodsHealthy children residing in a state foster home were studied with pulse oximetry every 2h for 24h.
ResultsEighty-two children were included in the study, ranging in age from 1 month to 6.5 years (average±standard error of 3.06±0.16 years), with a weight-for-length/height percentile of 65.5±2.9. In 65 (79.3%) children, the SpO2 levels followed a sinusoidal curve suggesting circadian rhythm. The total group of sinusoidal curves in this population had a mesor of 95.10±0.08%SpO2, period of 21.05±0.54h (in 53.8% of these children, the period was between 20 and 28h). The maximum SpO2 was reached at 3:14pm±16min, and the minimum at 5:16am±48min. When the 24h were divided into four periods, it was demonstrated that the highest SpO2 levels were reached between 2pm and 8pm.
ConclusionsIn this population of clinically healthy children, there was a circadian variation in pulse oximetry, with maximum values in the late afternoon and minimal values in the early morning.
La saturación periférica de oxígeno (SpO2) medida por oximetría de pulso es ampliamente usada en la práctica clínica, pero sus fluctuaciones durante las 24h del día han sido poco exploradas. Recientemente describimos que niños hospitalizados por causas no cardiopulmonares tenían una variación circadiana de la SpO2. Este hallazgo necesitaba ser corroborado en niños sanos, lo que constituyó la finalidad del presente estudio.
Población y métodoNiños sanos residentes en una casa cuna gubernamental se estudiaron mediante oximetría de pulso cada 2h a lo largo de 24h.
ResultadosSe incluyeron 82 niños de un mes a 6,5 años de edad (media±error estándar: 3,06±0,16 años), con peso para la talla en el percentil 65,5±2,9. En 65 (79,3%) niños los valores de SpO2 siguieron una curva sinusoidal sugestiva de un ritmo circadiano. El conjunto de curvas sinusoidales en esta población tuvo un mesor de 95,10±0,08%SpO2 y un período de 21,05±0,54h (en el 53,8% de estos niños el período estuvo entre 20 y 28h). El valor máximo de SpO2 se alcanzó a las 3:14PM±16min, y el más bajo a las 5:16AM±48min. Al dividir las 24h en 4 períodos se demostró que los valores más altos de SpO2 se alcanzaban entre las 2PM y las 8PM.
ConclusionesEn esta población de niños clínicamente sanos existió una variación circadiana en la oximetría de pulso, con valores máximos a media tarde y mínimos en la madrugada.
Pulse oximetry is a widespread procedure used in clinical and surgical settings, and it is an essential tool in intensive care units.1 This technique is usually done by placing a sensor on a finger or toe of one of the extremities or in other places such as an earlobe. The device emits a ray of light at 2 different wavelengths (∼660 and ∼940nm, alternatively), which are partially absorbed by hemoglobin.2 The quantity of absorption will depend on whether the hemoglobin is bound with oxygen or not. By calculating the quantity of light absorbed at each of the wavelengths, an index is determined that is automatically compared with a table or equation of references values, thus obtaining the percentage of hemoglobin saturation in the peripheral blood (SpO2).3
Several studies have published references values for SpO2 in children4–9 as well as in adults.10,11 However, these studies are usually done with nighttime polysomnography or with tracings that are relatively short; therefore, they do not make a complete 24-h analysis. The studies aimed at evaluating possible circadian changes in oxygenation are very scarce. In 1972, Reinberg and Gervais12 reported that PaO2 was lower during the night in healthy adults or in patients with chronic airway obstruction. In 1985, Updike et al.13 studied 6 pre-term newborns and they concluded that in half of the babies transcutaneous oxygen pressure (tcPO2) followed a circadian rhythm, reaching minimal levels during the early hours of the morning. Contrarily, in 1985 Postma et al.14 could not demonstrate a circadian rhythm in PaO2 or SpO2 in 8 healthy adults although said rhythm was evident in 8 patients with chronic airway obstruction. In a recent study, we assessed SpO2 values in 131 children aged between 23 days and 16 years who were hospitalized at the Hospital de Pediatría del Centro Médico Nacional Siglo XXI due to different diseases, but with no acute or chronic cardiorespiratory alterations.15 Each child underwent pulse oximetry approximately every 2h for 24h, and we found that in most of them (85%) SpO2 measurements followed a sinusoidal circadian rhythm, with maximal values in the late afternoon (∼5:00pm) and minimal levels in the early morning (∼3:00am). Clearly, the main disadvantage of this study was that it was done in children with some sort of disease. Thus, it was essential to explore whether this circadian rhythm phenomenon was likewise present in clinically healthy children, which is the objective of this present paper.
Patients and MethodsOurs is a prospective, longitudinal and observational study carried out between June and November 2009 in a government-run orphanage located in Mexico City (Centro Nacional Modelo de Atención, Investigación y Capacitación Casa Cuna Tlalpan, Sistema Nacional para el Desarrollo Integral de la Familia [DIF]). Children are admitted to the orphanage between the ages of 0 and 6, and upon admittance a medical file is opened for each child. The children undergo complete physical examinations as well as complete blood count, blood chemistry and parasitology. The children's vaccinations are reviewed and any necessary vaccines are administered. The facilities have a nurse and physician on duty for each shift who supervise the children's daily state of health. In addition, after admittance the children are included in a health-care program of periodical check-ups (at least every 3 months) that include dental, vision and orthopedic check-ups. Outside of the programmed activities for each age group (bathing, eating, schooling, etc.), the children spend free time with the other children.
We selected for participation in the study those children who, according to their medical history and physical examination, were clinically healthy and had no history of frequent snoring or any respiratory tract infection in the previous 30 days. After informed consent was given by their legal guardian, the children included in the study underwent SpO2 measurements approximately every 2h for a period of 24h. In order to do so, a portable pulse-oximeter was used (model 513, Novametrix Medical Systems Inc., Wallingford, CT, USA) with a non-disposable, pediatric, rigid clip sensor (model DB-9). According to the manufacturer's instructions, the precision of this oximeter is ±2% in SpO2 values between 80 and 100%. The sensor was placed on either a finger or toe, choosing one that best fit inside its concave shape. After a stabilization period of between 10 and 15s, SpO2 was read for 1min. The final value selected was the most constant value during the measurement. When the children were asleep, oximetry was done without waking them. When the children were awake, they were made to rest for at least 5min before the measurements were taken. All measurements were taken by the two physicians who participated in the study (IRG and JAG). These values and other variables (pulse, tympanic temperature, conditions, etc.) were registered on the data collection sheet.
The sinusoidal function was determined for each child (Levenberg–Marquardt method) with a 12-point system (referring to the 12 SpO2 values taken over the course of the 24h cycle) using a computer program (CurveExpert v1.38, Daniel Hyams, USA). This same procedure was done to obtain a global equation, using all the SpO2 values of all the children. The presence of a sinusoidal function with a cycle that was close to 24h (between 20 and 28h) corroborated the existence of circadian variability of SpO2. A sinusoidal function, such as that illustrated in Fig. 1, generally adheres to the formula:
where y is the SpO2 value from the fraction of the day selected (x), the constant a is the mesor (midline estimating statistic of rhythm, whose value is very similar to the average of the SpO2 measurements from a complete cycle), b is the amplitude (distance from the mesor to the either the highest or lowest point of the curve), c is 2π/period (the period is the duration of a complete cycle, which in this case is expected to be close to 24h) and d is the phase (moment of the period in which maximal SpO2 is reached). Therefore, once the sinusoidal function formula is obtained, it is possible to know the time at which the maximal and minimal SpO2 values occur as well as the degree of variation (maximum–minimum). The possible circadian rhythm was also evaluated by dividing the 24h cycle into 4 periods of 6h each (2–8, 8–14, 14–20 and 20–2h).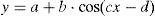

The majority of the variables followed a normal distribution according to the Kolmogorov–Smirnov test; therefore, parametric statistics were used, including regression and correlation analysis and the Student's t-test. The only variable that did not follow a normal distribution was the measurement of SpO2 in 4 periods of 6h each, and for this we used non-parametric statistics by means of the Kruskal–Wallis test, followed by the Dunn test for multiple comparisons.
The protocol was approved by the Comisión Nacional de Investigación en Salud del IMSS (2008-785-040), as well as by the Dirección General de Rehabilitación y Asistencia Social del DIF (221 000 00/668/09).
ResultsWe studied 82 children aged between 1 month and 6.5 years (mean 3.06±0.16 years [standard deviation]), 43 of whom (52.4%) were girls. Mean weight was 12.9±0.39kg and mean height was 87.8±1.55cm. According to the WHO reference values, the weight-for-length/height indicator was in percentile 65.5±2.9; none of the children were below the 5th percentile and only 9 were above the 95th percentile.
In 65 (79.3%) children, the SpO2 values taken during the 24h period were able to be adjusted to a sinusoidal curve. Fig. 2 shows some examples of these registers. There were no statistically significant differences in the anthropometric characteristics of these children or in the 17 children in whom it was not possible to obtain a sinusoidal curve. Nor were there any differences in mean SpO2 or in the minimal and maximal values. When we grouped all the sinusoidal curves, the average mesor was 95.10±0.08%SpO2 and the amplitude was 1.39±0.07%SpO2. The period had an average duration of 21.05±0.54h, and in 35 (53.8%) of these children the period was between 20 and 28h. Peak SpO2 was reached (acrophase) at 3:14pm±16min, while the lowest value (bathyphase) was at 5:16am±48min. At the same time, the highest and lowest SpO2 values had averages of 96.49±0.07 and 93.71±0.14%SpO2, respectively, and the maximal differences reached an average of 2.77±0.14%SpO2.
.")
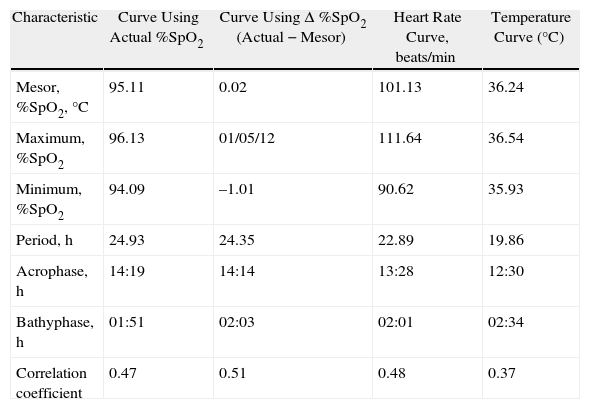
When we grouped all the SpO2 measurements from all the children who had circadian changes, we found that they were adjusted to a single sinusoidal curve with the correlation coefficient r=0.47 (Table 1 and Fig. 3A). This coefficient was greater when, instead of using the original SpO2 values, we used the differences of each value compared with its respective mesor. Thus, with this latter approach, the resulting sinusoidal curve had an r=0.51, with the formula y=0.022+1.032cos(6.192x−3.671) (Table 1 and Fig. 3B). According to this equation, the period had a duration of 24h 21min and the acrophase was reached in the afternoon (2:14pm), while the bathyphase occurred in the early morning (2:03am). The difference between the highest and lowest SpO2 value was 2.06 percentage points.
Characteristics of the Curves for SpO2, ΔSpO2, Heart Rate and Tympanic Temperature, Calculated After Grouping the Data for All the Children and Calculating a Single Sinusoidal Function for Each Variable.
| Characteristic | Curve Using Actual %SpO2 | Curve Using Δ %SpO2 (Actual−Mesor) | Heart Rate Curve, beats/min | Temperature Curve (°C) |
| Mesor, %SpO2,°C | 95.11 | 0.02 | 101.13 | 36.24 |
| Maximum, %SpO2 | 96.13 | 01/05/12 | 111.64 | 36.54 |
| Minimum, %SpO2 | 94.09 | –1.01 | 90.62 | 35.93 |
| Period, h | 24.93 | 24.35 | 22.89 | 19.86 |
| Acrophase, h | 14:19 | 14:14 | 13:28 | 12:30 |
| Bathyphase, h | 01:51 | 02:03 | 02:01 | 02:34 |
| Correlation coefficient | 0.47 | 0.51 | 0.48 | 0.37 |
Acrophase: time of day at which the maximum value was reached; bathyphase: time at night when the minimal value was reached.
 Each circle corresponds to the actual value of each SpO2 measurement. (B) As the individual curves of each child could be situated at different SpO2 levels (meaning higher or lower than the Y axis), the actual SpO2 values for each child were adjusted to the mesor of the same child, and so the position of the curves is homogenized and the circadian variability is better illustrated.")
Global SpO2 values obtained from the 65 children who had a sinusoidal pattern. (A) Each circle corresponds to the actual value of each SpO2 measurement. (B) As the individual curves of each child could be situated at different SpO2 levels (meaning higher or lower than the Y axis), the actual SpO2 values for each child were adjusted to the mesor of the same child, and so the position of the curves is homogenized and the circadian variability is better illustrated.
Regarding heart rate and body temperature, we also obtained sinusoidal patterns when we grouped all the measurements of the children (Table 1). In the case of heart rate, the sinusoidal function equation was y=101.13+10.51cos(6.59x−3.70), the period was 22h 54min and the acrophase and bathyphase occurred at 1:28pm and 2:01am, respectively. For body temperature, the function was y=36.24+0.30cos(7.59x−3.95), with a period of 19h 52min, acrophase at 12:30pm and bathyphase at 2:34am.
Upon dividing the SpO2 of the 82 children into 4 intervals of 6h each, there was an observed progressive modification in their values, reaching the maximum between 2:00pm and 8:00pm (Fig. 4).
Discussion
Living organisms frequently present changes at the biochemical, cell and/or functional level during the 24h cycle, and the presence of this biological clock is an important advantage for adapting to an environment.16 The cardiovascular system and the respiratory tract present this type of circadian variation.17,18 Nevertheless, one of the possible consequences, which is the circadian modification of SpO2, has not been fully explored. In a previous study done in children who were hospitalized due to non-cardiopulmonary diseases, it was found that SpO2 had a circadian variation.15 In the present study, we have evaluated whether this phenomenon is also present in clinically healthy children. Our results corroborate the fact that there is a circadian variation in SpO2 and that it reaches maximal values in mid-afternoon and minimal values in the early hours of the morning. The present study, however, shows some differences compared with the previous study: the hospitalized children had a slightly lower mesor (mean 94.2%SpO2), a greater amplitude in the circadian rhythm (mean 1.6%SpO2) and the acrophase was reached later (mean 4:53pm). Although part of these differences could be due to the fact that the age range was greater (23 days to 16 years; mean, 6.9 years), there is also the possibility that the hospital setting could have been an influence.
Although in the study we did not research the causes of this daytime–nighttime variation in SpO2, it is possibly due to changes in the two main factors that determine the degree of oxygenation in blood: ventilation (V′) and pulmonary circulation (Q′) in the so-called V′/Q′ ratio. As for the ventilation, it is known that the caliber of the airways reaches their maximum aperture at around 4pm, and the minimum at 4am.19,20 Some of the neurohormonal factors that influence pulmonary circulation also follow a circadian pattern. For example, it is known that vagal tone and plasma concentration of histamine, capable of producing vasodilation of the lung microcirculation, are higher in the early morning and lower in mid-afternoon.21 Conversely, the sympathetic tone and plasma concentrations of adrenalin and suprarenal steroids, which are factors that promote vasoconstriction, are lower in the early morning and higher in the mid-afternoon.22,23 Therefore, the fluctuations in alveolar ventilation and pulmonary circulation over the course of a 24-h day can lead to progressive changes in the V′/Q′ ratio and, consequently, in SpO2.15 The maximal imbalance of this relation (meaning lower ventilation with higher perfusion) would translate into a decrease in SpO2 which would theoretically be reached during the early morning.
The results found in this study could have implications in clinical practice. In our study, the difference between the peak and low SpO2 was an average of 2.77 percentage points, which seems a relatively small difference. However, there were children who reached differences of up to 6%SpO2, and a fall of that magnitude could be clinically relevant in patients with cardiopulmonary affectations. On the other hand, its has recently been proposed that if all newborns undergo pulse oximetry 24h after birth and before leaving the hospital, potentially severe congenital heart disease could be detected among those who present SpO2 values less than or equal to 90%–95%, which would help prevent higher morbidity and mortality in these children.24–26 Obviously, the limit that is set should take into account the circadian variation of SpO2.
Altitude above sea level is the main determinant of absolute oxygen pressure in inhaled air and, therefore, of the quantity of alveolar oxygen available for diffusion toward the bloodstream. Due to this, it has been widely confirmed that SpO2 values slowly decrease from ∼97% at sea level to ∼87% at an altitude of 4000m.27 The present study was done in Mexico City, located at 2240m above sea level, therefore the absolute values of SpO2 could be different at other altitudes. Nevertheless, we consider it very likely that the circadian variability of SpO2 will continue to be present, regardless of altitude and atmospheric oxygen pressure.
There are oximeters on the market that can store the SpO2 determinations continuously for 24h or more. However, their use in the circadian analysis of SpO2 is still uncertain as there would be no way of knowing the conditions of the child (whether he/she was playing, coughing, eating, sleeping, crying, etc.).
In conclusion, in the present study of clinically healthy children, we found a circadian variation in the oximetry values of healthy subjects, with an average period of close to 21h and higher values of SpO2 in the afternoon (∼3:14pm) and lower values in the early morning (∼5:16am).
Conflict of InterestsThe authors declare that they have no conflict of interests.
The authors would like to thank the authorities and the staff at the Centro Nacional Modelo de Atención, Investigación y Capacitación Casa Cuna Tlalpan as well as the Dirección General de Rehabilitación y Asistencia Social del Sistema Nacional para el Desarrollo Integral de la Familia for their invaluable support in order to complete this study.
Please cite this article as: Vargas MH, et al. Variabilidad circadiana de la oximetría de pulso en niños sanos menores de 7 años. Arch Bronconeumol. 2012;48:202–6.


