


The beneficial impact of an 8-month competitive season on the ventilatory profile response to exercise in soccer players has never been evaluated.
Material and methodsVentilatory profile (evaluated by determining individual tidal volume [VT] relative to minute ventilation [VE] inflection points during exercise) and metabolic responses to incremental exercise were evaluated in 2 professional soccer teams before and after an 8-month competitive season.
ResultsNo differences between teams in anthropometric characteristics or in resting cardiopulmonary variables, included oxygen uptake (VO2) and heart rate (HR), before and during the competitive season were found. At iso-speed, there were overall improvements in carbon dioxide output (VCO2), VE/VO2, VE/VCO2, VE and respiratory frequency (fR) during the season. The VT/VE inflection points 1 and 2 occurred with greater exercise time, HR, VO2, VCO2, VE and VT during the competitive season.
ConclusionsDespite very high baseline performance and a negligible improvement in VO2, an 8-month competitive season improved ventilatory profile response to exercise in elite athletes.
El efecto beneficioso de una temporada de competición de 8meses sobre el perfil ventilatorio en respuesta al esfuerzo no se ha evaluado en jugadores de fútbol.
Material y métodosSe evaluó el perfil ventilatorio (analizando los puntos de inflexión específicos de la razón entre el volumen corriente [VT] y la ventilación [VE] durante el esfuerzo) y la respuesta metabólica al esfuerzo gradual en 2 equipos de fútbol profesional, antes y después de una temporada de competición de 8meses.
ResultadosNo se observaron diferencias entre equipos en las características antropométricas ni en las variables cardiopulmonares en reposo, incluidos el consumo de oxígeno (VO2) y la frecuencia cardíaca (FC). Durante la temporada de competición, a velocidad estándar (iso), se observaron mejorías globales en la producción de dióxido de carbono (VCO2), las razones VE/VO2 y VE/VCO2, la VE y la frecuencia respiratoria (FR). Los puntos de inflexión 1 y 2 de la razón VT/VE se observaron tras un mayor tiempo de ejercicio y mayores FC, VO2, VCO2, VE y VT durante la temporada de competición.
ConclusionesA pesar del elevado rendimiento inicial y de la escasa mejoría del VO2, la temporada de competición de 8meses mejoró el perfil ventilatorio en respuesta al esfuerzo de estos deportistas de élite.
Training programs that include exercising the leg muscles with walking, stationary cycling, or treadmill exercise are commonly used in sedentary populations1 and patients suffering from chronic obstructive pulmonary disease (COPD), chronic heart failure (CHF) and pulmonary arterial hypertension (PAH) to improve exercise performance, reduce symptom perception (shortness of breath and leg discomfort) and improve quality of life.1–3
The effects of training on the cardiovascular, metabolic and ventilatory adaptation/response to exercise are largely known in these populations3–5 and also in sport elite athletes.1,6,7
The ventilatory response to exercise can be evaluated in terms of ventilatory demand, ventilatory efficiency and ventilatory profile. Ventilatory demand can be assessed as the relative contribution of tidal volume (VT) and respiratory frequency (fR) to total ventilation (VE), ventilatory efficiency as the rate of increase of VE with respect to carbon dioxide production (VCO2) (i.e., the VE/VCO2 slope and ratio), and ventilatory response profile as the VT to VE inflection points during exercise, which are usually determined by examining individual Hey plots.8 In healthy subjects, 1 and sometimes 2 inflection points (VT/VE inflection 1 and 2) can be observed.8 In addition, the VT/VE inflection point corresponds to the attainment of critical constraints on VT expansion, and marks the point where both dyspnea intensity and selection of perceived unsatisfied inspiration escalate sharply in asthma and COPD patients.9–11
Little is known of the effects of training on the ventilatory profile during exercise, and whether this may affect exercise performance in elite athletes. The aim of this study, therefore, was to evaluate the effects of 8 months of training and competition on the ventilatory profile response to treadmill exercise in elite athletes from the Italian soccer “Serie A” league.
We hypothesized that 8 months of training and competition would have a beneficial impact (reduction) on the ventilatory response to exercise in these athletes by postponing the occurrence of VT/VE inflection 1 and 2, thus ameliorating the ventilatory profile. This, in turn, would likely help improve exercise performance under these circumstances.
Material and MethodsStudy Design and SubjectsThis is an exploratory, observational, follow-up study of 14 professional male soccer players, aged between 21 and 33 years, belonging to 2 Italian “Serie A” league soccer teams. The population was examined before the start of the championship (July 2014) and after 8 months of competition during the championship (March 2015) according to a standardized protocol consisting of clinical and functional assessment parameters. The clinical assessment included history of risk behavior and physical examination, and the functional assessment included spirometry and ergospirometry. After receiving the description of the procedures and potential risks, all subjects gave their written informed consent. The study was approved by the Internal Institutional Review Boards of both teams. All procedures performed in the study complied with the ethical standards of the Internal Institutional Review Board Committee and with the 1964 Helsinki declaration and its subsequent amendments or with comparable ethical standards.
Spirometry and ErgospirometryA pneumotachograph was used to measure dynamic volume indices such as forced vital capacity (FVC) and indices derived from it such as the forced expiratory volume in 1s (FEV1) and its correlation with FVC (FEV1/FVC ratio). The observed values were expressed as a percentage of the predicted values based on the American Thoracic Society/European Respiratory Society reference values.12 For heart rate (HR) monitoring, a polar heart rate monitor was used (Polar, Kempele, Finland).
For the ergospirometric test (Vmax Encore, Yorba Linda, CA, USA), a “ramp” protocol at a constant treadmill incline (1%) (starting at 8km/h and increasing speed by 1km/h every 60s) was used. Using “breath by breath” analysis of the flows and concentrations of respiratory inhaled and exhaled gases (VO2 and VCO2) obtained via mass flow and fast-responding gas analyzers (fuel cell and infrared analyzers), the following variables were obtained: oxygen uptake (VO2) and its relationship to heart rate (oxygen pulse or VO2/HR), the derived ventilatory variables (VE and VT) and the ventilatory equivalents for O2 and CO2 (VE/VO2, VE/VCO2). The anaerobic threshold (AT or ventilatory threshold) was evaluated using non-invasive measurements of respiratory variables derived from the VCO2/VO2 slope method13 and verified against the increase in VE/VO2 without change in VE/VCO2 during exercise.14
The VO2 test was rigorously performed to verify the attainment of maximal VO2 (V′O2max), accordingly to established procedures.15
The breathing respiratory reserve (BRR) was expressed as the difference in liters between the maximum voluntary ventilation (MVV) of each athlete and ventilation achieved at peak exercise (VE peak), where the predicted MVV was defined as FEV1×40. Exercise tolerance was expressed as the maximum speed reached (maximal exercise velocity: MEV), adjusted according to a modified Kuiper's equation (Eq. (1)):
where vl represents the speed achieved on the last exercise step, and n the number of seconds attained during the last stage.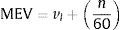
The VT inflection point of each subject was manually identified on the VT/VE graph.
All functional measurements were performed before and after 8 months of competition during the championship. Specialized sports physicians individualized the training regimens for each player. Both soccer clubs specifically requested that investigators be blinded to their physical training programs to prevent any disclosure of these regimens. All measurements were performed according to standardized criteria of the American Thoracic Society and American College of Chest Physicians (ATS/ACCP).16
Statistical AnalysisWe studied 14 soccer players with a normal body mass index (BMI) and no spirometric evidence of obstructive ventilatory defects.17 This sample size provides an 80% power to detect a significant difference (2-tailed, α=0.05) in V′E measured at a standardized speed (iso-speed) during incremental cardiopulmonary exercise testing, on the basis of a relevant difference in VE of ∼8–10L/min, based on the use of a standard deviation of ∼9–12L/min for V′E changes in published studies.3
Data are reported as mean±standard deviation. Baseline differences between groups were evaluated using independent sample Mann–Whitney U tests. Differences before and after 8 months of competition were evaluated using related samples Wilcoxon signed rank tests. A P-value of less than .05 was used as the threshold of statistical significance. All analyses were performed using SPSS version 21 (IBM, USA). Four main evaluation time points during the treadmill exercise were considered for comparisons between “before and after 8 months of competition”: iso-speed (16km/h), VT/VE inflection 1, VT/VE inflection 2 and peak exercise. Iso-speed (16km/h) was chosen to compare each variable of interest in each test for each athlete at a standardized stimulus “before and after 8 months of competition” to reveal the real effects of training, thus avoiding the confounding factors related to a potential amelioration in VO2 peak and MEV after 8 months of training and competition.
ResultsBaseline Characteristics and Changes in Cardiopulmonary Response After TrainingThe 14 soccer players were non-smokers (never smokers), with normal blood hemoglobin, with no respiratory or cardiac conditions (asthma and other). None were taking medication/treatment, such inhalers or other therapies.
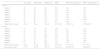
Anthropometric characteristics of the subjects are shown in Table 1.
Anthropometric, Demographic and Resting Physiological Characteristics of the Study Population.
| Age (years) | Weight (kg) | Height (cm) | BMI | FEV1 Pre-training (L) | FEV1 Post-training (L) | |
|---|---|---|---|---|---|---|
| Team 1 | ||||||
| Athlete 1 | 29 | 88 | 194 | 23.4 | 5.39 | 5.65 |
| Athlete 2 | 24 | 83 | 187 | 23.7 | 5.04 | 5.33 |
| Athlete 3 | 26 | 88 | 191 | 24.1 | 5.01 | 5.61 |
| Athlete 4 | 30 | 78 | 177 | 24.9 | 3.82 | 4.34 |
| Athlete 5 | 30 | 80 | 177 | 25.5 | 3.36 | 3.88 |
| Athlete 6 | 23 | 80 | 182 | 24.1 | 4.43 | 4.94 |
| Athlete 7 | 30 | 88 | 183 | 26.3 | 4.96 | 5.17 |
| Mean (SD) for team 1 | 27 (3) | 84 (4) | 184 (7) | 24.5 (1.0) | 4.57 (0.74) | 4.99 (0.66)* |
| Team 2 | ||||||
| Athlete 1 | 25 | 79 | 179 | 24.6 | 5.5 | 5.74 |
| Athlete 2 | 33 | 84 | 183 | 25.1 | 5.33 | 5.68 |
| Athlete 3 | 21 | 80 | 182 | 24.1 | 5.03 | 4.99 |
| Athlete 4 | 23 | 74 | 180 | 22.8 | 4.52 | 4.42 |
| Athlete 5 | 23 | 63 | 165 | 23.1 | 3.84 | 3.86 |
| Athlete 6 | 28 | 87 | 186 | 25.1 | 5.94 | 5.99 |
| Athlete 7 | 27 | 86 | 186 | 24.8 | 5.74 | 5.54 |
| Mean (SD) for team 2 | 26 (4) | 79 (8) | 180 (7) | 24.3 (0.9) | 5.13 (0.74) | 5.17 (0.8) |
| Overall mean (SD) | 27 (7) | 81 (7) | 182 (7) | 24.4 (1.0) | 4.85 (0.77) | 5.08 (0.70)* |
Values are means±SD.
Abbreviations: BMI, body mass index; FEV1, forced expiratory volume at first second; SD, standard deviation.
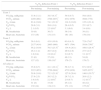
Tables 2 and 3 summarize the differences observed during exercise before and after 8 months of training and competition in team 1 and team 2 and in the study population as a whole (Fig. 1). Analyzing exercise responses according to teams allowed us to better appreciate the amplitude of training- and competition-related response to exercise in each variable.
Cardiopulmonary Measurements During Incremental Cycle Exercise, Before and After Training.
| Baseline (8km/h) | Iso-Speed (16km/h) | Peak Exercise | ||||
|---|---|---|---|---|---|---|
| Pre-training | Post-training | Pre-training | Post-training | Pre-training | Post-training | |
| Team 1 | ||||||
| MEV, km/h | 19.1 (0.8) | 19.3 (0.9) | ||||
| VO2, ml/kg/min | 17.3 (4.9) | 18.5 (8.3) | 55.5 (4.1) | 54.2 (3.9) | 62.5 (4.2) | 64.1 (3.5) |
| VO2, % predicted | 154 (12) | 159 (11) | ||||
| VCO2, ml/min | 1114 (46) | 1080 (188) | 4507 (611) | 4372 (402) | 5505 (246) | 5749 (280)P=.06 |
| VE, L/min | 35.2 (7.1) | 35.3 (14.3) | 119.2 (14.3) | 110.9 (11)* | 150 (17.2) | 156.1 (10.0) |
| VE/VCO2 | 31.5 (5.7) | 32.4 (10.9) | 26.5 (1.7) | 25.4 (1.1)* | 27.2 (2.8) | 27.2 (0.9) |
| VT, L | 1.4 (0.4) | 1.5 (0.4) | 2.9 (0.4) | 3.0 (0.5)* | 3.2 (0.6) | 3.1 (0.2) |
| fR, breaths/min | 30 (11) | 23 (6) | 43 (8) | 38 (6)* | 48 (7) | 51 (6) |
| HR, beats/min | 97 (8) | 90 (15) | 166 (8) | 165 (5) | 179 (4) | 181 (4) |
| HR, % predicted | 94 (2) | 95 (2) | ||||
| VO2/HR, ml/beat | 15.3 (2.4) | 19.2 (8.7) | 27.9 (1.8) | 27.5 (2.7) | 30.1 (1.9) | 30.2 (2.7) |
| VO2/HR, % predicted | 169 (13) | 169 (14) | ||||
| Team 2 | ||||||
| MEV, km/h | 17.7 (1.1) | 19.5 (0.8)* | ||||
| VO2, ml/kg/min | 12.8 (8.6) | 16.4 (5.8) | 58.5 (4.3) | 61.6 (4.4) | 65.0 (3.8) | 75.7 (3.6)* |
| VO2, % predicted | 158 (14) | 182 (11)* | ||||
| VCO2, ml/min | 860 (313) | 1043 (216) | 4658 (769) | 4466 (447) | 5603 (875) | 6357 (777)* |
| VE, L/min | 25.1 (12.7) | 28.0 (4.6) | 125.6 (24.1) | 117.1 (18.8)* | 165 (32.5) | 179.8 (27.6) |
| VE/VCO2 | 29.2 (9.7) | 31.3 (3.4) | 27.0 (3.0) | 26.1 (2.6) | 29.3 (2.5) | 28.2 (2.2) |
| VT, L | 0.9 (0.5) | 1.2 (0.3) | 2.8 (0.7) | 2.7 (0.7) | 3.2 (1.0) | 3.2 (0.7) |
| fR, breaths/min | 25 (7) | 25 (7) | 47 (11) | 45 (9)P=.05 | 53 (9) | 57 (7)* |
| HR, beats/min | 80 (16) | 82 (16) | 171 (4) | 169 (8) | 185 (6) | 183 (7) |
| HR, % predicted | 97 (4) | 96 (4) | ||||
| VO2/HR, ml/beat | 11.6 (6.6) | 15.5 (4.0) | 27.0 (3.7) | 28.7 (3.3)* | 28.7 (3.8) | 32.8 (4.2)* |
| VO2/HR, % predicted | 168 (11) | 192 (9)* | ||||
| All subjects | ||||||
| MEV, km/h | 18.4 (1.2) | 19.4 (0.9)* | ||||
| VO2, ml/kg/min | 15.1 (7.1) | 17.5 (7.0) | 57.0 (4.3) | 57.9 (5.6) | 63.8 (4.1) | 69.9 (6.9)* |
| VO2, % predicted | 156 (13) | 170 (16)* | ||||
| VCO2, ml/min | 987 (252) | 1061 (195) | 4582 (672) | 4419 (411)P=.08 | 5554 (620) | 6053 (644)* |
| VE, L/min | 30.2 (11.2) | 32.1 (11.1) | 122.4 (19.4) | 114.0 (15.1)* | 157.5 (26.2) | 168.0 (23.4)P=.07 |
| VE/VCO2 | 30.3 (7.7) | 30.2 (8.3) | 26.8 (2.4) | 25.8 (2.0)* | 28.3 (2.8) | 27.7 (1.7) |
| VT, L | 1.2 (0.5) | 1.3 (0.4) | 2.8 (0.6) | 2.9 (0.6) | 3.2 (0.8) | 3.1 (0.5) |
| fR, breaths/min | 27 (9) | 24 (6) | 45 (10) | 41 (8)* | 50 (8) | 54 (7)* |
| HR, beats/min | 89 (15) | 86 (15) | 169 (6) | 167 (7) | 182 (6) | 182 (5) |
| HR, % predicted | 95 (3) | 96 (3) | ||||
| VO2/HR, ml/beat | 13.5 (5.1) | 17.4 (6.8) | 27.4 (2.8) | 28.1 (2.9) | 29.4 (3.0) | 31.5 (3.6)* |
| VO2/HR, % predicted | 169 (12) | 181 (16)* | ||||
Abbreviations: fR, respiratory frequency; HR, heart rate; MEV, maximal exercise velocity; SD, standard deviation; VO2, oxygen consumption; VO2/HR, oxygen pulse; VCO2, carbon dioxide production; VE, minute ventilation; VE/VO2, ventilatory equivalent for oxygen; VE/VCO2, ventilatory equivalent for carbon dioxide; VT, tidal volume. VO2 predicted from: Wasserman K, Hansen JE, Sue DY, Stringer WW, Whipp BJ: Principles of Exercise Testing and Interpretation. Fourth edition. Philadelphia: Lippincott Williams and Wilkins; 2005; HR predicted from: Tanaka H, Monahan KD, Seals DR. Age-predicted maximal heart rate revisited. J Am Coll Cardiol. 2001 Jan;37(1):153–6; VO2/HR predicted derived from VO2 predicted/HR predicted.
Respiratory and Metabolic Variables at VT/VE Inflection Points 1 and 2, Pre- and Post-training.
| VT/VE Inflection Point 1 | VT/VE Inflection Point 2 | |||
|---|---|---|---|---|
| Pre-training | Post-training | Pre-training | Post-training | |
| Team 1 | ||||
| VO2/kg, ml/kg/min | 33.9 (11.1) | 38.5 (9.3)* | 54.9 (9.7) | 59.8 (8.0) |
| VCO2, ml/min | 2289 (861) | 2788 (807)* | 4332 (979) | 4944 (778) |
| VE, L/min | 63.4 (24.8) | 74.1 (21.9)* | 114.2 (24.9) | 125.4 (21.4) |
| VE/VCO2 | 28.0 (3.1) | 26.6 (1.6) | 26.4 (0.5) | 25.3 (0.7) |
| VT, L | 2.1 (0.5) | 2.5 (0.6)* | 3.1 (0.6) | 3.4 (0.6) |
| fR, breaths/min | 30 (9) | 30 (7) | 39 (14) | 39 (11) |
| Heart rate, beats/min | 133 (16) | 131 (15) | 161 (10) | 170 (10) |
| Team 2 | ||||
| VO2/kg, ml/kg/min | 36.1 (6.1) | 43.8 (10.8) | 61.6 (4.3) | 72.6 (7.6)* |
| VCO2, ml/min | 2157 (414) | 2665 (860) | 4971 (704) | 5819 (756)* |
| VE, L/min | 56.2 (10.9) | 70.5 (23.5)* | 134.4 (26.1) | 160.8 (28.4)* |
| VE/VCO2 | 26.1 (1.2) | 26.5 (2.8) | 26.9 (2.6) | 27.5 (2.5) |
| VT, L | 1.8 (0.4) | 2.0 (0.4)* | 2.8 (0.7) | 3.1 (0.7)* |
| fR, breaths/min | 33 (6) | 37 (10) | 49 (11) | 54 (9) |
| Heart rate, beats/min | 127 (12) | 136 (10)* | 176 (7) | 179 (7) |
| All subjects | ||||
| VO2/kg, ml/kg/min | 35.0 (8.7) | 41.1 (10.1)* | 59.2 (7.1) | 67.2 (9.9)* |
| VCO2, ml/min | 2223 (653) | 2726 (804)* | 4739 (830) | 5455 (857)* |
| VE, L/min | 59.8 (18.8) | 72.3 (21.9)* | 127.0 (26.4) | 146.0 (30.7)* |
| VE/VCO2 | 27.0 (2.5) | 26.5 (2.2) | 26.7 (2.1) | 26.6 (2.2) |
| VT, L | 1.9 (0.5) | 2.2 (0.6)* | 2.9 (0.7) | 3.2 (0.7)* |
| fR, breaths/min | 31 (8) | 33 (9) | 45 (12) | 48 (12) |
| Heart rate, beats/min | 130 (14) | 134 (13) | 171 (11) | 175 (9)* |
Abbreviations: VO2, oxygen consumption, VCO2, carbon dioxide production, VE, minute ventilation, VE/VCO2, ventilatory equivalent for carbon dioxide, VT, tidal volume, fR, respiratory frequency; SD, standard deviation.
, heart rate (HR, upper right panel), ventilation (VE, lower left panel) and ventilatory equivalents of CO2 (VE/VCO2, lower right panel) are plotted in response to symptom-limited treadmill exercise in all study subjects before (filled circles) and after (open circles) 8 months of training and competition. The graph shows mean values at baseline (starting at 8km/h), iso-speed (16km/h), VT/VE inflection 1, VT/VE inflection 2 and peak exercise. P values before vs after training and competition at the same measurement point are shown in Tables 2 and 3. Abbreviations: L, liters; min, minutes; kg, kilograms.")
Oxygen uptake (VO2, upper left panel), heart rate (HR, upper right panel), ventilation (VE, lower left panel) and ventilatory equivalents of CO2 (VE/VCO2, lower right panel) are plotted in response to symptom-limited treadmill exercise in all study subjects before (filled circles) and after (open circles) 8 months of training and competition. The graph shows mean values at baseline (starting at 8km/h), iso-speed (16km/h), VT/VE inflection 1, VT/VE inflection 2 and peak exercise. P values before vs after training and competition at the same measurement point are shown in Tables 2 and 3. Abbreviations: L, liters; min, minutes; kg, kilograms.
There were no differences in baseline age, weight, height and BMI between teams. FEV1 increased significantly after 8 months of training and competition in team 1, but not in team 2.
Table 2 shows the cardiopulmonary measurements during incremental treadmill exercise at baseline (8km/h), at iso-speed, and at maximum exercise before and after 8 months of training and competition.
Overall, there were no differences in resting cardiopulmonary variables before and after 8 months of training and competition, except for a decrease in VE/VCO2. At iso-speed, there were overall improvements in VCO2, VE/VO2, VE/VCO2, VE and fR after 8 months of training and competition. VO2 at ventilatory threshold was comparable before training and competition between teams (59.7±4.9 vs 58.6±5.7ml/kg/min respectively, P=.7); after training and competition, VO2 at ventilatory threshold increased significantly only in team 2 (58.6±5.7 vs 72.3±5.4ml/kg/min respectively, P=.004) compared with team 1 (59.7±4.9 vs 60.8±6.8ml/kg/min respectively, P=.7). After 8 months of training and competition there were overall improvements in MEV, VO2 at ventilatory threshold, peak VO2, peak VCO2, peak fR and peak O2-pulse. These changes were driven by subjects from team 2, who showed greater improvements after 8 months of training and competition than subjects from team 1.
Change in VT/VE Inflection Points After TrainingIndividual Hey plots8 showed that VT/VE inflection point 1 was discernible in all athletes, whereas VT/VE inflection point 2 was discernible only in 11/14 athletes before training and in 12/14 after 8 months of training and competition.
When considering all subjects, VT/VE inflection point 1 occurred with greater exercise time, VO2 and VCO2 and, notably, with greater VE and VT (Table 3 and Fig. 2) after 8 months of training and competition.
 is plotted as a function of ventilation (VE) in response to symptom-limited treadmill exercise in all study subjects before (filled circles) and after (open circles) 8 months of training and competition. The graph shows mean values at baseline (starting at 8km/h), iso-speed (16km/h), VT/VE inflection 1, VT/VE inflection 2 and peak exercise. P values before vs after training and competition at the same measurement point are shown in Tables 2 and 3. Abbreviations: L, liters; min, minutes; km, kilometers; h, hours.")
Tidal volume (VT) is plotted as a function of ventilation (VE) in response to symptom-limited treadmill exercise in all study subjects before (filled circles) and after (open circles) 8 months of training and competition. The graph shows mean values at baseline (starting at 8km/h), iso-speed (16km/h), VT/VE inflection 1, VT/VE inflection 2 and peak exercise. P values before vs after training and competition at the same measurement point are shown in Tables 2 and 3. Abbreviations: L, liters; min, minutes; km, kilometers; h, hours.
Similarly, VT/VE inflection point 2 also occurred with greater exercise time, VO2, VCO2, VE and VT, but also with higher HR.
DiscussionThe main findings of this study are as follows: (1) exercise performance (peak symptom-limited VO2 and MEV) significantly improved and ventilatory demand to treadmill exercise diminished at a given speed in the sample as a whole after 8 months of training and competition; (2) ventilatory profile was characterized by a significant delay in the appearance of VT/VE inflection points during exercise after 8 months of training and competition.
Peak symptom-limited VO2, VO2 at ventilatory threshold and MEV significantly increased by approximately 10%, 14% and 5% respectively after 8 months of training and competition (Table 2). We were satisfied that exercise tests were maximal in the sample as a whole: RER was greater than 1.15 at the peak of exercise, and athletes generally demonstrated significant encroachment on their cardiac and metabolic reserves. Although the improvement of exercise performance was likely multifactorial and the proximate cause likely varied among athletes (effect and intensity of training, initial exercise performance at the beginning of the training session, etc.), significant improvement in the ventilatory response to exercise in terms of ventilatory demand, ventilatory efficiency and ventilatory profile were evident in the majority.
Our findings of an ameliorated ventilatory demand and efficiency after 8 months of training and competition in our athletes confirm previously published training-related studies in patients with cardiopulmonary diseases3 and in athletes.1,6,7 VE decreased significantly by approximately 8–10L/min at a given submaximal treadmill speed (iso-speed), and was accompanied by an increased VT at iso-speed. The mechanisms of the ameliorated ventilatory response to exercise are likely to be multifactorial, but as they were beyond the scope of the present study they were not fully clarified. Nevertheless, it is conceivable that a combination of factors may have contributed to this, such as (1) increased FEV1 after 8 months of training and competition, which allowed athletes to increase their “ventilatory ceiling” during exercise and to better adapt VT expansion and fR; (2) the known effects of locomotor muscle training on reduced ventilatory demand via reduced metaboreceptor and mechanoreceptor stimulation after training5; and (3) improved ventilatory efficiency, as demonstrated by reduced VE/VCO2 and VE/VO2, which may reflect better ventilation/perfusion coupling during exercise in our soccer players after 8 months of training and competition. Other factors contributing to the ventilatory demand on exercise, such as the arterial partial pressure of carbon dioxide (PaCO2) set point and the dead space-to-tidal volume ratio (VD/VT), were not assessed in this study, and our data give no insight into the relative contribution of these different factors to reducing exercise ventilation in our athletes.
However, the finding of a modified ventilatory profile after 8 months of training and competition is new and novel and deserves some discussion. The contribution of VT and fR to the ventilatory response to incremental exercise can be usefully discerned from the VE/VT relationship,8,18,19 although it is now more usual in clinical practice for VT to be plotted as a function of VE (VT/VE relationship).10
Two and sometimes even 3 ranges can normally be discerned in the VT/VE relationship. In normal unfit subjects, VE initially increases linearly with respect to VT (range 1) up to ∼50%–60% of vital capacity (VC), with the contribution of fR being modest in this range.8,19–22
When subjects train with a constant fR despite increasing work rate, the VT/VE relationship typically becomes markedly steeper (range 2); this increase in VE is achieved largely by progressive increases in fR.8,18 As peak exercise approaches, especially in extremely fit subjects, VT may be seen to actually decrease (range 3), with the increasing VE being sustained by disproportionately large increases in fR.23,24 The point at which range 1 becomes range 2 and range 2 becomes range 3 can be taken as VT/VE inflection point 1 and VT/VE inflection point 2, respectively. We can only speculate on the mechanisms behind this behavior in both normal healthy subjects or elite athletes, but they may include: the influence of respiratory-mechanical factors related to the disproportionately large increase in the elastic work of breathing as VT encroaches on the flatter region of the pulmonary compliance curve, especially as respiratory compensation for metabolic acidosis develops above the ventilatory threshold (or lactic threshold) and volume-related activation of vagal pulmonary mechanoreceptors.6,7,21 The disproportionately large contribution of fR to the VE response that is often seen in mild to more severe COPD,10,11,25,26 in restrictive lung disease,25,27 in asthma,9 in CHF28 and PAH29 is also associated with a disproportionately large increase in fR during exercise, and supports these suggestions.
In our study, VT/VE inflection point 1 was discernible in all elite athletes, whereas VT/VE inflection point 2 was discernible only in 11/14 athletes before training. After 8 months of training and competition, VT/VE inflection point 1 occurred at a greater exercise time and treadmill speed than before start of training. Notably, VT/VE inflection point 2 was discernible in 12/14 athletes after 8 months of training and competition, and also occurred with greater exercise time and treadmill speed than before start of training. What possible benefit could there be in delaying the appearance of VT/VE inflection point 1 and 2 in elite sport athletes after 8 months of training and competition? The answer is unclear, but we speculate that it may be related to: (1) an attempt to delay attainment of a disproportionately large increase in the elastic and resistive work of breathing as VT encroaches on the flatter region of the pulmonary compliance curve, especially as respiratory compensation for metabolic acidosis develops above the ventilatory threshold; and (2) an attempt to delay or hamper the VT-related activation of vagal pulmonary mechanoreceptors. However, these hypotheses are speculative, and our data provide no insight into the relative contribution of these different factors to amelioration of the ventilatory profile/behavior in our athletes after training.
Regardless of the mechanisms, the improved ventilatory profile after training likely contributed to the greater exercise performance in our soccer athletes as a whole, despite no significant changes in heart rate at a standardized speed and a negligible improvement in VO2 and MEV after 8 months of training and competition.
Study LimitationsThis study has certain limitations that must be acknowledged. First, lack of measurement of PaCO2 and VD/VT during exercise prevented us from reaching a definite conclusion on the relative contributions of these different factors to improved ventilatory demand and efficiency during exercise in our athletes after 8 months of training and competition. Second, the lack of respiratory mechanics-related pressure measurements, the absence of dynamic lung volume measurements during exercise, and the lack of measurements of locomotor muscle oxygenation and lean body mass prevented us from reaching a definite conclusion on the relative contribution of these different factors to the improved ventilatory profile/behavior during exercise in our athletes after 8 months of training and competition. However, it should be noted that these choices were largely justified by the exploratory nature of the study, our efforts to restrict the study to observational data, the tight time schedule imposed by each football club on each athlete (these soccer players had “no time” to come to our laboratory and perform a complete study involving measures of inspiratory and expiratory pressure, lactates and so on; therefore, the investigators had to conduct exercise testing in their respective football clubs. This was done as rigorously as possible, given the time restraints and limited equipment). Last but not least, investigators were blinded to the physical training program used by each soccer team (as specifically requested by each football club to prevent disclosure of these regimens). This was an important limitation, given that the ventilatory improvement seen cannot be attributed to any particular exercise protocol; this, therefore, greatly limits the applicability, feasibility and potential benefits of these protocols in patients with cardiorespiratory disorders.
PerspectivesTo the best of our knowledge, this is the first study to report the effects of 8 months of training and competition on the ventilatory profile response to treadmill exercise in elite soccer athletes. The ventilatory effects were more pronounced than the effects on the cardiovascular and metabolic systems in these athletes. As such, this study paves the way for training programs that focus more on recording and assessing ventilatory profile response and breathing activity than heart rate, lactic threshold and other metabolic variables that may not change significantly. The subjects included in this study were elite athletes who started the training season with an above-normal cardiovascular and metabolic capacity. However, as observed, the benefits to the ventilatory system were largely out of proportion to those obtained by the cardiovascular and metabolic systems.
The lung plays a fundamental role in exercise performance in patients with ventilatory limitations. This is quite often neglected in athletes (except for those presenting with exercise-induced bronchospasm), in healthy subjects and in some patients suffering from cardiorespiratory disorder such as CHF and PAH, because it is erroneously believed that the ventilatory system has enough “reserve” to cope with exercise. This may not, in fact, be the case in some healthy asymptomatic subjects and in some endurance athletes, in whom expiratory flow limitation and diaphragm fatigue can impair exercise performance as much as dynamic lung hyperinflation and mechanical constraints on tidal volume expansion can impair exercise performance in patients with cardiovascular and respiratory disorders.
Despite this, ventilatory response to exercise has never been considered a crucial tool for assessing performance. Further evidence of this is shown by a PubMed search using the terms “Exercise, Athletes, Heart”, which retrieved 1536 studies in the last ten years, compared to 157 studies retrieved when “Heart” is replaced with “Lung”. In addition, attention is almost always focused on the lung as a “gas exchanger” rather than on the “ventilatory response to exercise”.
In light of this, the assessment of ventilation, its response and profile/behavior to exercise using measurements derived from tidal breathing and respiratory frequency (such as cardiopulmonary exercise testing) could perhaps complement heart rate-based training programs, provide a simple, accurate picture of the status of the respiratory system, and help reveal the mechanisms behind improved exercise performance in elite athletes. This should also prompt respiratory physicians focused on respiratory pathophysiology to (1) address the important question of whether ventilatory changes during exercise represent a physiological mechanism for the improvement seen in patients after pulmonary rehabilitation; (2) attach more importance to the role the ventilatory system may play in some patients in whom it is not thought (erroneously) to contribute to exercise limitation.
Further studies are required to determine whether evaluation of the ventilatory response to exercise could give insight into the potential improvement of technical, tactical, psychological and athletic skills in these elite athletes.30
In summary, this is the first study to demonstrate that an improved ventilatory profile response after training likely contributes to the greater exercise performance observed in our soccer athletes, despite no significant changes in heart rate at a given speed and a negligible improvement in VO2 and MEV after 8 months of training and competition.
AuthorshipAll the authors meet the ICMJE Recommendations requirements for authorship. Adriano Di Paco and Bruno-Pierre Dubé have equally contributed to the paper and are both first authors.
FundingThis study did not receive any funding.
Conflict of InterestAdriano Di Paco received personal fees for consulting from Juventus FC and Genoa CFC.
Bruno-Pierre Dubé and Pierantonio Laveneziana declare no conflict of interests.
We thank Simone Folletti (the athletic performance head coach of Juventus FC), Alessandro Pilati (the athletic performance head coach of Genoa CFC), and all study participants from Juventus FC and Genoa CFC for their contribution to this study.
Please cite this article as: Di Paco A, Dubé B-P, Laveneziana P. Cambios en la respuesta ventilatoria al esfuerzo en deportistas entrenados: efectos beneficiosos sobre la fisiología respiratoria más allá del rendimiento cardiovascular. Arch Bronconeumol. 2017;53:237–244.


