


Alternatives metrics or altmetrics are non-traditional measurements of scientific production that reflect a publication’s influence in social networks and similar channels of dissemination. The aim of this study was to analyze the media impact of Archivos de Bronconeumología according to 2 altmetric aggregators and website visits.
MethodsThis was an observational study of the original articles and review and consensus articles published in Archivos de Bronconeumología during the period 2014–2018. Data from the PlumX Metrics and Altmetric aggregators and visits to the Archivos de Bronconeumología website were analyzed. Five comparisons were made: by specialty area, by funding received, by number of participating centers, by document type, and by topic. In a subanalysis, altmetrics were correlated with the conventional citation system.
ResultsWe analyzed 273 publications, of which 186 were original articles (68.1%). The papers that achieved greater media impact in the two aggregators analyzed, and in terms of website visits, were pulmonology papers and review and consensus articles. The mean Altmetric Attention Score (AAS) was 1.9 ± 4.4 (range 0–59), which is above average for the date of publication of the paper. A statistically significant weak to moderate correlation was identified between altmetrics and conventional citations.
ConclusionsReview articles, consensus documents, and pulmonology papers had a greater media impact. Mean Altmetric Attention Score was higher than the average based on the date of publication. A weak to moderate correlation between altmetrics and conventional citations was identified.
Las métricas alternativas o altmetrics son todas aquellas mediciones de la producción científica diferentes a los indicadores clásicos y recogen su influencia mediática en redes sociales y canales de difusión similares. El objetivo del estudio fue analizar el impacto mediático de Archivos de Bronconeumología en 2 agregadores de altmetrics y de las visitas a su página web.
MétodosEstudio observacional de los artículos originales, de revisión y de consenso de Archivos de Bronconeumología durante el periodo 2014-2018. Se analizaron los agregadores PlumX Metrics y Altmetric, y las visitas a la página web de Archivos de Bronconeumología. Se realizaron 5 comparaciones: por especialidad firmante, por financiación recibida, por número de centros participantes, por tipología documental y por área temática. Como subanálisis, se correlacionaron las altmetrics con las citaciones convencionales.
ResultadosSe analizaron 273 publicaciones de las que 186 fueron artículos originales (68,1%). Las publicaciones de Neumología y las de revisión y consenso obtuvieron mayor impacto mediático en los 2 agregadores analizados, así como en las visitas a la página web. El score medio de atención de Altmetric fue de 1,9 ± 4,4 (rango 0-59), por encima del promedio para la antigüedad de la publicación. Se documentó una correlación estadísticamente significativa débil a moderada entre las altmetrics y las citaciones clásicas.
ConclusionesLas publicaciones de revisión, de consenso y las de Neumología tuvieron mayor impacto mediático. El AAS medio fue superior al promedio en función de la antigüedad de las publicaciones. Se objetivó una correlación débil a moderada de las altmetrics con las citaciones convencionales.
The term “altmetrics”, coined in 2010,1 refers to all measurements of scientific output not included in conventional bibliometric indicators such as the impact factor (IF). Given the impossibility of closely monitoring the exponential growth of scientific output, altmetrics quantify the use of the Internet and social networks. Since this concept was introduced, it has captured the attention of higher impact scientific journals, which report altmetrics alongside their usual indicators. Since altmetrics do not measure the quality of a publication but concentrate rather on the attention paid to an article in the media,2 they can access, filter, and highlight articles that generate interest from the very moment they are published at a staggering rate of approximately 2.5 million articles per year — a figure that is doubling every 9 years, and is humanly impossible to follow.3
Archivos of Bronconeumologia (AB), the official organ of the Spanish Society of Pulmonology and Thoracic Surgery (SEPAR) and the Latin American Chest Association (ALAT), is the Spanish language respiratory journal with greatest impact worldwide, with an IF 4.214 that ranks it in the first quartile according to the 2018 edition of the Journal of Citation Reports (JCR). In line with other respiratory journals with an impact factor, such as the American Thoracic Society Journals,4 AB has decided to record its altmetrics, which are quantified using specific programs known as aggregators. The aggregator used by AB is PlumX Metrics, created in 2011, but another important aggregator, created in 2012, is Altmetric. The main objective of this study was to conduct an analysis of altmetrics using the Altmetric and PlumX Metrics aggregators, and of AB website traffic during a 5-year period.
MethodsDescriptionWe conducted a bibliometric study of the altmetrics of AB in the period 2014–2018. We included original articles, special articles, review articles, and consensus documents, as these are publications for which increased traffic and media dissemination might be expected (Fig. 1). A manual search was conducted in PlumX Metrics and Altmetric between March 21 and 23, 2019, and AB website traffic to both its Spanish and English versions was also documented. Finally, conventional citation data were collected on March 21, 2019 from the Science Citation Index Expanded (SCI-E) database of the Web of Science, owned by Clarivate Analytics, which is the database from which the JCR journal IF is annually calculated by dividing the total number of citations obtained in a given year by the number of articles published in that journal in the 2 previous years. For example, AB received a total of 472 citations in 2018, and published a total of 112 citable articles in 2016 and 2017, so their IF in 2018 was 472/112 = 4.214. No sample size calculation was made, and the study period was determined on the basis that prior to 2014 AB publications had little media impact, possibly because the analyzed aggregators had existed for only a short period. Before we specify the items, we should mention 2 basic bibliometric concepts. The first is that a mention or a citation is not the same as a reference. If article A mentions article B in its list of references, A has referenced B, and B has received a citation from A, so these are not interchangeable concepts. In other words, citations are received from subsequent publications, and references are made to previous ones. The second concept is that there are a number of bibliographic databases that collect the citations received by scientific studies. One of these is the SCI-E mentioned above, and another is Scopus, owned by Elsevier, that calculates its own impact indicator called the CiteScore.
Altmetric aggregators
The following items for each publication were retrieved from PlumX Metrics:
- •
Citations: contains citations from the bibliographic databases Scopus and CrossRef (the latter is property of Linking Association Inc.).
- •
Usage: includes clicks, downloads, views, or video plays.
- •
Captures: contains articles tagged by users as “favorite”, or bookmarked in reference management software such as Mendeley or CiteULike.
- •
Social media: contains the number of publications in Twitter, Facebook or other similar networks that include a link to the article in question.
- •
Mentions: measures instances when a publication is mentioned in blogs, Wikipedia, or the written or digital press.
The following items for each publication were retrieved from Altmetric:
- •
Mentioned by: includes all mentions of the article in social networks such as Twitter or Facebook, blogs, written and digital press, Wikipedia and video plays, among others. In this study, Twitter and Facebook networks were differentiated, as they are the most widely used in the case of AB publications.
- •
Citations: contains citations to other on-line journals using the Dimensions domain.
- •
Readers on: includes readership in reference managers such as Mendeley or CiteULike.
Altmetric uses these data to calculate its own attention index, the Attention Altmetric Score (AAS). This is a whole number that does not have a specific classification scale, but a value of 1 is considered an average impact for the date and source the publication, and values above this level are considered higher than average impact (Appendix B Table 1, additional material). Moreover, both recent citations obtained in the last 2 years and total citations are recorded in the Dimensions domain. A total impact index in the field when compared with publications of the same age (Field Citation Ratio), and a relative index that compares the speed of obtaining citations compared to other publications in the same field (Relative Citation Ratio) are also calculated.
ComparisonsFive comparisons were made: by specialty of the first author of the publication (pulmonology or other specialties according to the Specialist Training Programs in Health Sciences of the Ministry of Health, Consumption and Social Welfare5); by number of institutions (single-center or multicenter trial); by funding (funded or not); by document type (original articles, reviews, guidelines, and special articles); and by SEPAR areas of interest. As time since publication is an important factor for receiving citations, because the longer the article has been published, the more most likely it is to be cited, median time was calculated for the 5 proposed comparisons and analyzed using the log-rank statistic.
StatisticsThe Statistical Package for the Social Sciences (SPSS, Chicago, IL, USA), version 20 was used for statistical analysis. Qualitative variables are presented as absolute numbers and percentages, and quantitative variables as mean ± standard deviations or ranges. The difference between dichotomous variables was analyzed using the Chi-squared test. Normal distribution of the variables was evaluated using the Kolgomorov–Smirnov test. As the variables did not follow a normal distribution, we used the Mann–Whitney U test and Kruskal–Wallis test for 2 samples or for more than 2 samples, respectively. A Spearman’s correlation subanalysis was conducted to compare the number of views and aggregator scores with conventional citations. For the purposes of graphical representation, given the considerable variability of the altmetrics, logarithmic transformation was performed. Statistical significance was set at P < 0.05.
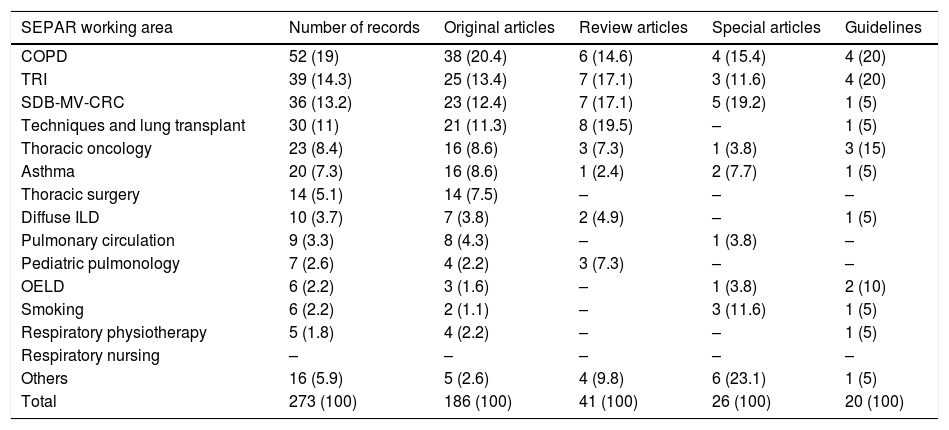
ResultsWe included 273 documents between the years 2014–2018: 186 (68.1%) original articles, 41 (15%) reviews, 26 (9.5%) special articles, and 20 (7.3%) guidelines. Thus, review articles (guidelines, reviews, and special articles), with 87 articles, accounted for 32% of the total. COPD was the area that generated most documents, with 52 articles (19%), followed by tuberculosis and respiratory infections with 39 (14.3%), and sleep-disordered breathing/mechanical ventilation/critical respiratory care with 36 (13.2%). Table 1 shows the contribution of the remaining areas, by document type. Pulmonology was the specialty of the first author of 175 (64.1%) papers, and specialists in 22 different Spanish Health System areas were listed as the first author of the remaining articles. Overall, 70 (25.6%) papers were funded, and more than one institution participated in 226 (82.8%). Median time since publication of all papers was 50.9 months (interquartile range 47.2–54.5), and there were no significant differences in any of the 5 comparisons studied.
Distribution of publications by SEPAR area and document type.
| SEPAR working area | Number of records | Original articles | Review articles | Special articles | Guidelines |
|---|---|---|---|---|---|
| COPD | 52 (19) | 38 (20.4) | 6 (14.6) | 4 (15.4) | 4 (20) |
| TRI | 39 (14.3) | 25 (13.4) | 7 (17.1) | 3 (11.6) | 4 (20) |
| SDB-MV-CRC | 36 (13.2) | 23 (12.4) | 7 (17.1) | 5 (19.2) | 1 (5) |
| Techniques and lung transplant | 30 (11) | 21 (11.3) | 8 (19.5) | – | 1 (5) |
| Thoracic oncology | 23 (8.4) | 16 (8.6) | 3 (7.3) | 1 (3.8) | 3 (15) |
| Asthma | 20 (7.3) | 16 (8.6) | 1 (2.4) | 2 (7.7) | 1 (5) |
| Thoracic surgery | 14 (5.1) | 14 (7.5) | – | – | – |
| Diffuse ILD | 10 (3.7) | 7 (3.8) | 2 (4.9) | – | 1 (5) |
| Pulmonary circulation | 9 (3.3) | 8 (4.3) | – | 1 (3.8) | – |
| Pediatric pulmonology | 7 (2.6) | 4 (2.2) | 3 (7.3) | – | – |
| OELD | 6 (2.2) | 3 (1.6) | – | 1 (3.8) | 2 (10) |
| Smoking | 6 (2.2) | 2 (1.1) | – | 3 (11.6) | 1 (5) |
| Respiratory physiotherapy | 5 (1.8) | 4 (2.2) | – | – | 1 (5) |
| Respiratory nursing | – | – | – | – | – |
| Others | 16 (5.9) | 5 (2.6) | 4 (9.8) | 6 (23.1) | 1 (5) |
| Total | 273 (100) | 186 (100) | 41 (100) | 26 (100) | 20 (100) |
COPD: chronic obstructive pulmonary disease; DILD: diffuse interstitial lung disease; OELD: occupational and environmental lung diseases; SEPAR: Spanish Society of Pulmonology and Thoracic Surgery; TRI: tuberculosis and respiratory infections; SDB-MV-CRC: sleep-disordered breathing-mechanical ventilation-critical respiratory care.
Results presented as number of cases (percentages). Chi-squared = 69.09; P = 0.02.
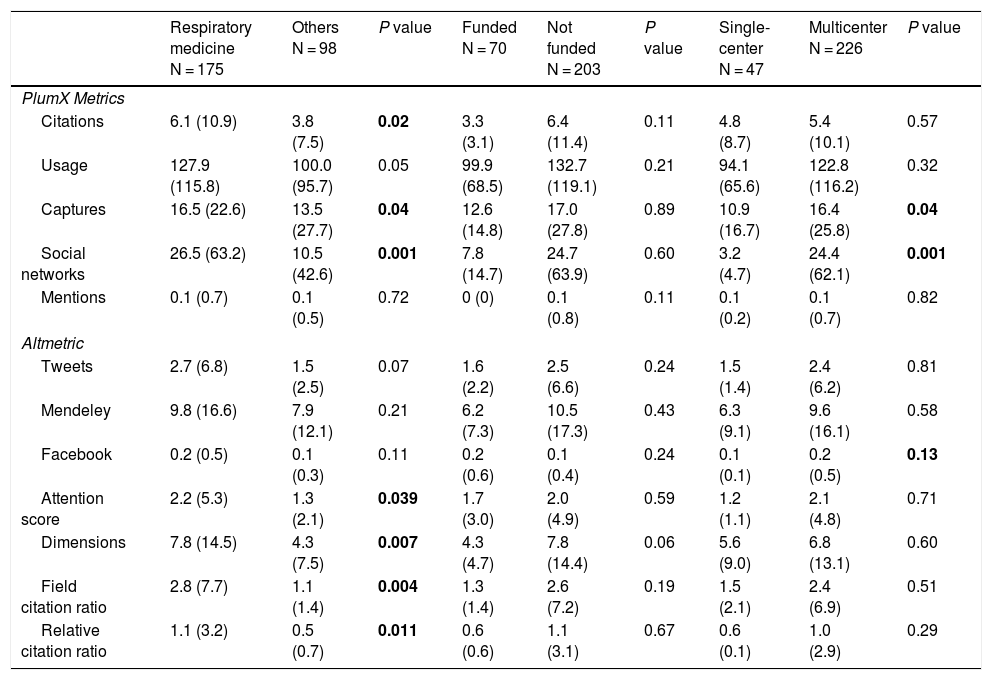
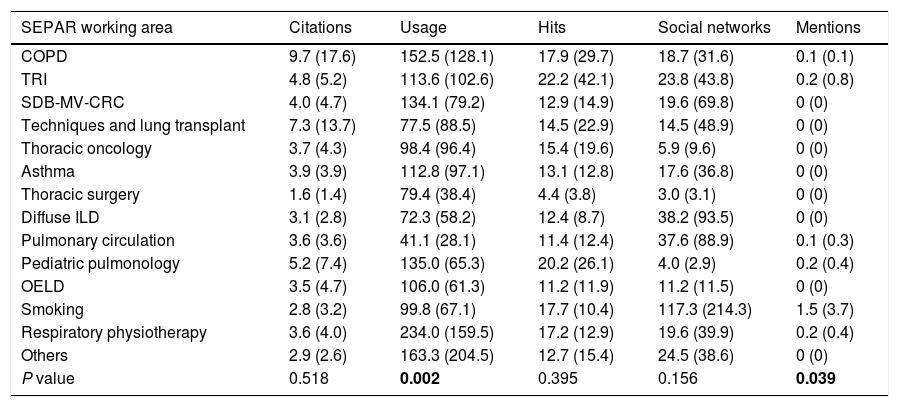
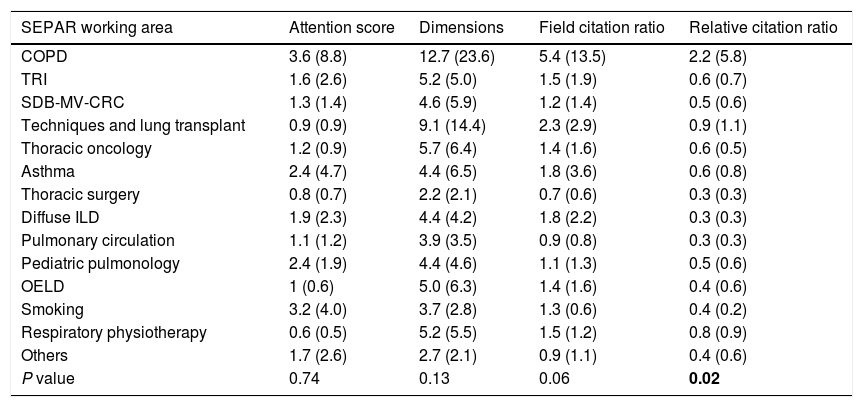
The documents whose first author was a pulmonologist received more media attention in most of the PlumX Metrics and Altmetric categories and, in PlumX Metrics, multicenter publications received more attention with more captures (16.4 ± 25.8) and more views in social networks (24.4 ± 62.1) (Table 2). Table 3 shows the PlumX Metrics media impact by SEPAR area, where smoking received the most mentions (1.5 ± 3.7) and physical therapy the most usage (234 ± 159.5) (Fig. 2). Table 4 shows that the relative rate of citation in Altmetric was greater for the area of COPD (2.2 ± 5.8).
Media impact by PlumX Metrics and Altmetrics categories according to specialty involved, funding, or number of participating institutions.
| Respiratory medicine N = 175 | Others N = 98 | P value | Funded N = 70 | Not funded N = 203 | P value | Single-center N = 47 | Multicenter N = 226 | P value | |
|---|---|---|---|---|---|---|---|---|---|
| PlumX Metrics | |||||||||
| Citations | 6.1 (10.9) | 3.8 (7.5) | 0.02 | 3.3 (3.1) | 6.4 (11.4) | 0.11 | 4.8 (8.7) | 5.4 (10.1) | 0.57 |
| Usage | 127.9 (115.8) | 100.0 (95.7) | 0.05 | 99.9 (68.5) | 132.7 (119.1) | 0.21 | 94.1 (65.6) | 122.8 (116.2) | 0.32 |
| Captures | 16.5 (22.6) | 13.5 (27.7) | 0.04 | 12.6 (14.8) | 17.0 (27.8) | 0.89 | 10.9 (16.7) | 16.4 (25.8) | 0.04 |
| Social networks | 26.5 (63.2) | 10.5 (42.6) | 0.001 | 7.8 (14.7) | 24.7 (63.9) | 0.60 | 3.2 (4.7) | 24.4 (62.1) | 0.001 |
| Mentions | 0.1 (0.7) | 0.1 (0.5) | 0.72 | 0 (0) | 0.1 (0.8) | 0.11 | 0.1 (0.2) | 0.1 (0.7) | 0.82 |
| Altmetric | |||||||||
| Tweets | 2.7 (6.8) | 1.5 (2.5) | 0.07 | 1.6 (2.2) | 2.5 (6.6) | 0.24 | 1.5 (1.4) | 2.4 (6.2) | 0.81 |
| Mendeley | 9.8 (16.6) | 7.9 (12.1) | 0.21 | 6.2 (7.3) | 10.5 (17.3) | 0.43 | 6.3 (9.1) | 9.6 (16.1) | 0.58 |
| 0.2 (0.5) | 0.1 (0.3) | 0.11 | 0.2 (0.6) | 0.1 (0.4) | 0.24 | 0.1 (0.1) | 0.2 (0.5) | 0.13 | |
| Attention score | 2.2 (5.3) | 1.3 (2.1) | 0.039 | 1.7 (3.0) | 2.0 (4.9) | 0.59 | 1.2 (1.1) | 2.1 (4.8) | 0.71 |
| Dimensions | 7.8 (14.5) | 4.3 (7.5) | 0.007 | 4.3 (4.7) | 7.8 (14.4) | 0.06 | 5.6 (9.0) | 6.8 (13.1) | 0.60 |
| Field citation ratio | 2.8 (7.7) | 1.1 (1.4) | 0.004 | 1.3 (1.4) | 2.6 (7.2) | 0.19 | 1.5 (2.1) | 2.4 (6.9) | 0.51 |
| Relative citation ratio | 1.1 (3.2) | 0.5 (0.7) | 0.011 | 0.6 (0.6) | 1.1 (3.1) | 0.67 | 0.6 (0.1) | 1.0 (2.9) | 0.29 |
Results are expressed as means (standard deviation) per record.
Statistically significant P values are shown in bold (i.e., <0.05).
Media impact according to PlumX Metrics categories for SEPAR working areas.
| SEPAR working area | Citations | Usage | Hits | Social networks | Mentions |
|---|---|---|---|---|---|
| COPD | 9.7 (17.6) | 152.5 (128.1) | 17.9 (29.7) | 18.7 (31.6) | 0.1 (0.1) |
| TRI | 4.8 (5.2) | 113.6 (102.6) | 22.2 (42.1) | 23.8 (43.8) | 0.2 (0.8) |
| SDB-MV-CRC | 4.0 (4.7) | 134.1 (79.2) | 12.9 (14.9) | 19.6 (69.8) | 0 (0) |
| Techniques and lung transplant | 7.3 (13.7) | 77.5 (88.5) | 14.5 (22.9) | 14.5 (48.9) | 0 (0) |
| Thoracic oncology | 3.7 (4.3) | 98.4 (96.4) | 15.4 (19.6) | 5.9 (9.6) | 0 (0) |
| Asthma | 3.9 (3.9) | 112.8 (97.1) | 13.1 (12.8) | 17.6 (36.8) | 0 (0) |
| Thoracic surgery | 1.6 (1.4) | 79.4 (38.4) | 4.4 (3.8) | 3.0 (3.1) | 0 (0) |
| Diffuse ILD | 3.1 (2.8) | 72.3 (58.2) | 12.4 (8.7) | 38.2 (93.5) | 0 (0) |
| Pulmonary circulation | 3.6 (3.6) | 41.1 (28.1) | 11.4 (12.4) | 37.6 (88.9) | 0.1 (0.3) |
| Pediatric pulmonology | 5.2 (7.4) | 135.0 (65.3) | 20.2 (26.1) | 4.0 (2.9) | 0.2 (0.4) |
| OELD | 3.5 (4.7) | 106.0 (61.3) | 11.2 (11.9) | 11.2 (11.5) | 0 (0) |
| Smoking | 2.8 (3.2) | 99.8 (67.1) | 17.7 (10.4) | 117.3 (214.3) | 1.5 (3.7) |
| Respiratory physiotherapy | 3.6 (4.0) | 234.0 (159.5) | 17.2 (12.9) | 19.6 (39.9) | 0.2 (0.4) |
| Others | 2.9 (2.6) | 163.3 (204.5) | 12.7 (15.4) | 24.5 (38.6) | 0 (0) |
| P value | 0.518 | 0.002 | 0.395 | 0.156 | 0.039 |
COPD: chronic obstructive pulmonary disease; DILD: diffuse interstitial lung disease; OELD: occupational and environmental lung diseases; SDB-MV-CRC: sleep-disordered breathing-mechanical ventilation-critical respiratory care; SEPAR: Spanish Society of Pulmonology and Thoracic Surgery; TRI: tuberculosis and respiratory infections.
Results are expressed as means (standard deviation) per record.
Statistically significant P values are shown in bold (i.e., <0.05).

Distribution of usage by paper according to SEPAR areas in the PlumX Metrics platform. COPD: chronic obstructive pulmonary disease; DILD: diffuse interstitial lung disease; OELD: occupational and environmental lung diseases; SEPAR: Spanish Society of Pulmonology and Thoracic Surgery; SDB: sleep disordered breathing; TRI: tuberculosis and respiratory infections.
Media impact according to Altmetric categories for SEPAR working areas.
| SEPAR working area | Attention score | Dimensions | Field citation ratio | Relative citation ratio |
|---|---|---|---|---|
| COPD | 3.6 (8.8) | 12.7 (23.6) | 5.4 (13.5) | 2.2 (5.8) |
| TRI | 1.6 (2.6) | 5.2 (5.0) | 1.5 (1.9) | 0.6 (0.7) |
| SDB-MV-CRC | 1.3 (1.4) | 4.6 (5.9) | 1.2 (1.4) | 0.5 (0.6) |
| Techniques and lung transplant | 0.9 (0.9) | 9.1 (14.4) | 2.3 (2.9) | 0.9 (1.1) |
| Thoracic oncology | 1.2 (0.9) | 5.7 (6.4) | 1.4 (1.6) | 0.6 (0.5) |
| Asthma | 2.4 (4.7) | 4.4 (6.5) | 1.8 (3.6) | 0.6 (0.8) |
| Thoracic surgery | 0.8 (0.7) | 2.2 (2.1) | 0.7 (0.6) | 0.3 (0.3) |
| Diffuse ILD | 1.9 (2.3) | 4.4 (4.2) | 1.8 (2.2) | 0.3 (0.3) |
| Pulmonary circulation | 1.1 (1.2) | 3.9 (3.5) | 0.9 (0.8) | 0.3 (0.3) |
| Pediatric pulmonology | 2.4 (1.9) | 4.4 (4.6) | 1.1 (1.3) | 0.5 (0.6) |
| OELD | 1 (0.6) | 5.0 (6.3) | 1.4 (1.6) | 0.4 (0.6) |
| Smoking | 3.2 (4.0) | 3.7 (2.8) | 1.3 (0.6) | 0.4 (0.2) |
| Respiratory physiotherapy | 0.6 (0.5) | 5.2 (5.5) | 1.5 (1.2) | 0.8 (0.9) |
| Others | 1.7 (2.6) | 2.7 (2.1) | 0.9 (1.1) | 0.4 (0.6) |
| P value | 0.74 | 0.13 | 0.06 | 0.02 |
COPD: chronic obstructive pulmonary disease; DILD: Diffuse interstitial lung disease; OELD: occupational and environmental lung diseases; SDB-MV-CRC: sleep-disordered breathing-mechanical ventilation-critical respiratory care; SEPAR: Spanish Society of Pulmonology and Thoracic Surgery; TRI: tuberculosis and respiratory infections.
Results are expressed as means (standard deviation) per record.
Statistically significant P values are shown in bold (i.e., <0.05).
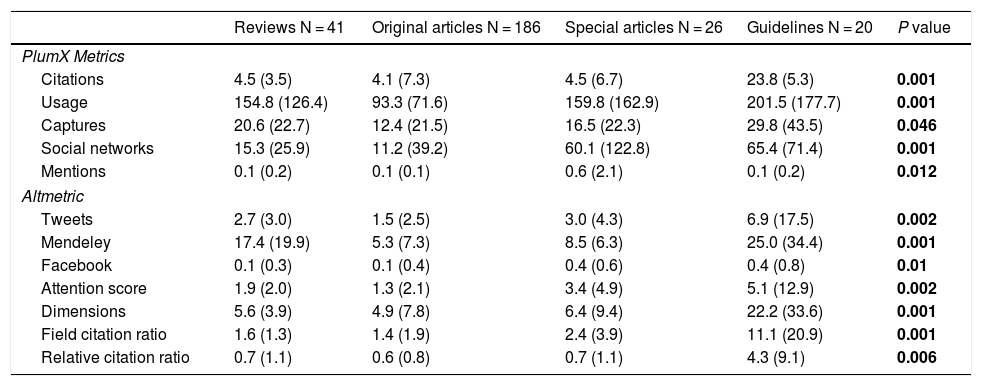
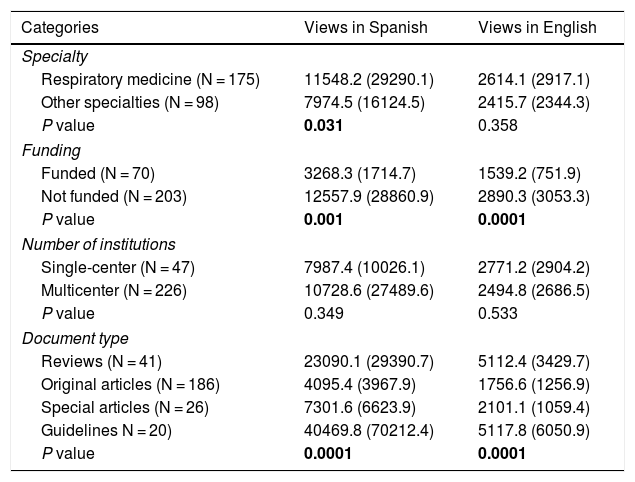
With respect to document type, guidelines received more media attention in almost all categories analyzed (Table 5). With respect to the website, publications with a pulmonologist as first author, without funding, and reviews or guidelines received more views (Table 6). Single-center or multicenter participation did not influence the amount of traffic, and no differences were found in terms of SEPAR area, regardless of the language of the article viewed (Appendix B Table 2, additional material).
Media impact by PlumX Metrics and Altmetric categories according to document type included in the study.
| Reviews N = 41 | Original articles N = 186 | Special articles N = 26 | Guidelines N = 20 | P value | |
|---|---|---|---|---|---|
| PlumX Metrics | |||||
| Citations | 4.5 (3.5) | 4.1 (7.3) | 4.5 (6.7) | 23.8 (5.3) | 0.001 |
| Usage | 154.8 (126.4) | 93.3 (71.6) | 159.8 (162.9) | 201.5 (177.7) | 0.001 |
| Captures | 20.6 (22.7) | 12.4 (21.5) | 16.5 (22.3) | 29.8 (43.5) | 0.046 |
| Social networks | 15.3 (25.9) | 11.2 (39.2) | 60.1 (122.8) | 65.4 (71.4) | 0.001 |
| Mentions | 0.1 (0.2) | 0.1 (0.1) | 0.6 (2.1) | 0.1 (0.2) | 0.012 |
| Altmetric | |||||
| Tweets | 2.7 (3.0) | 1.5 (2.5) | 3.0 (4.3) | 6.9 (17.5) | 0.002 |
| Mendeley | 17.4 (19.9) | 5.3 (7.3) | 8.5 (6.3) | 25.0 (34.4) | 0.001 |
| 0.1 (0.3) | 0.1 (0.4) | 0.4 (0.6) | 0.4 (0.8) | 0.01 | |
| Attention score | 1.9 (2.0) | 1.3 (2.1) | 3.4 (4.9) | 5.1 (12.9) | 0.002 |
| Dimensions | 5.6 (3.9) | 4.9 (7.8) | 6.4 (9.4) | 22.2 (33.6) | 0.001 |
| Field citation ratio | 1.6 (1.3) | 1.4 (1.9) | 2.4 (3.9) | 11.1 (20.9) | 0.001 |
| Relative citation ratio | 0.7 (1.1) | 0.6 (0.8) | 0.7 (1.1) | 4.3 (9.1) | 0.006 |
Results are expressed as means (standard deviation) per record.
Statistically significant p values are shown in bold (i.e., <0.05).
Media impact of Archivos de Bronconeumologia website traffic according to the specialty of author, funding, number of institutions, and document type.
| Categories | Views in Spanish | Views in English |
|---|---|---|
| Specialty | ||
| Respiratory medicine (N = 175) | 11548.2 (29290.1) | 2614.1 (2917.1) |
| Other specialties (N = 98) | 7974.5 (16124.5) | 2415.7 (2344.3) |
| P value | 0.031 | 0.358 |
| Funding | ||
| Funded (N = 70) | 3268.3 (1714.7) | 1539.2 (751.9) |
| Not funded (N = 203) | 12557.9 (28860.9) | 2890.3 (3053.3) |
| P value | 0.001 | 0.0001 |
| Number of institutions | ||
| Single-center (N = 47) | 7987.4 (10026.1) | 2771.2 (2904.2) |
| Multicenter (N = 226) | 10728.6 (27489.6) | 2494.8 (2686.5) |
| P value | 0.349 | 0.533 |
| Document type | ||
| Reviews (N = 41) | 23090.1 (29390.7) | 5112.4 (3429.7) |
| Original articles (N = 186) | 4095.4 (3967.9) | 1756.6 (1256.9) |
| Special articles (N = 26) | 7301.6 (6623.9) | 2101.1 (1059.4) |
| Guidelines N = 20) | 40469.8 (70212.4) | 5117.8 (6050.9) |
| P value | 0.0001 | 0.0001 |
Results are expressed as means (standard deviation) per record.
Statistically significant P values are shown in bold (i.e., <0.05).
Mean AAS for all publications was 1.9 ± 4.4 (range 0–59). A total of 77 publications (28.2%) had a score of 0 and the most repeated value was 1, documented in 97 (35.5%) papers. The SEPAR area with the highest AAS was COPD with 3.6 ± 8.8, and the lowest AAS was in the area of respiratory physical therapy with 0.6 ± 0.5, with no statistically significant differences between all areas (P = 0.74). In terms of specialty, pulmonology papers showed a more statistically significant AAS of 2.2 ± 5.3 compared to other specialties which had 1.3 ± 2.1 (P = 0.04). Funded publications had an AAS of 1.7 ± 3.0, and those without funding had 1.9 ± 4.9 (P = 0.59). Multicenter studies presented a score of 2.1 ± 4.8 in comparison to single-center studies with 1.2 ± 1.1 (P = 0.71). Finally, by document type, guidelines achieved the highest AAS with 5.1 ± 12.9 and original articles scored 1.3 ± 2.1 (P = 0.002).
Subanalysis of SCI-E citationsA moderate statistically significant correlation between SCI-E citations and AB website traffic was determined, with a Spearman’s correlation coefficient of 0.598 (95% CI: 0.497–0.678; P = 0.01) (Fig. 3). In the remaining domains, a very weak significant correlation was observed with AAS (ρ = 0.157; 95% CI: 0.005–0.306; P = 0.036), a weak correlation with PlumX Metrics captures (ρ = 0.239; 95% CI: 0.118–0.358; P = 0.0001), moderate with PlumX Metrics usage (ρ = 0.420; 95% IC: 0.304–0.533; P = 0.0001), and very strong with PlumX Metrics citations (ρ = 0.832; 95% CI 0.778–0.874; P = 0.0001). Social networks in PlumX Metrics were not significantly correlated (ρ = −0.015; 95% CI: −0.157 to 0.123; P = 0.815).
Discussion
The most significant finding of our study was that the documented AAS was above average for the date of the publication, although approximately a quarter of publications did not generate media impact. It was also interesting to note that, in general terms, publications with a pulmonologist as first author, and guidelines, reviews, and special articles, received more media attention in the aggregators analyzed and according to AB website traffic.
As these types of articles are more numerous, they could be more likely to obtain media impact and conventional impact. Pulmonology is the specialty that has historically been most published in AB, accounting for more than 60% of all papers.6 Although time since publication is a highly important variable in bibliometric studies for estimating the true impact of an article in the scientific community and in a given discipline,7,8 we did not find any significant differences in our study, possibly due to the relatively short follow-up period. Like previous authors, we found in our study that review and consensus articles attracted more media attention than original articles, although they do not contain original content and are possibly over-representated in this type of analysis.9,10 Articles of this type accounted for 32% of the papers included in our study, a percentage similar to that of other recent bibliometric analyses of the historically most cited articles in biomedical disciplines and topics, such as dermatology (25%),11 oral leukoplakia (37%),12 and stroke (36%).13
Multicenter studies achieved higher media attention in the usage and social network domains of PlumX Metrics and in Facebook usage in Altmetric. In an analysis of the 101 neurointervention articles with the greatest media impact, papers in which more disciplines and centers participated had higher altmetric scores.14 Although multicenter does not necessarily mean multidisciplinary, the greater impact observed might be explained by the involvement of more centers with their own channels of dissemination. Finally, the COPD area showed a higher relative citation rate in Altmetric. That said, it should be noted that the 2017 update of the GesEPOC guidelines15 is probably responsible for the AAS impact of 59, nearly three times that of the next highest AAS score of 21 for asthma.
Another important finding was that altmetrics behave differently from conventional metrics. With the exception of PlumX Metrics citations, the correlation with other domains ranged from very weak to moderate. The correlation documented for the 200 most cited articles on emergency medicine (0.31)16 was also weak, and moderate for the 100 most cited articles in nursing research (0.438).17 This may mean that these articles are consulted, but not published, so citations are reduced. Citations documented by PlumX Metrics warrant special attention because, as expected, they showed a very strong correlation with conventional metrics, as they pursue common objectives, but PlumX Metrics include non-IF journals, for which reason the correlation is lower than the recorded figure of 0.832. The fact that these metrics did not correlate closer with conventional metrics does not mean that they do not have sufficient impact. For a start, IF is not the perfect bibliometric indicator, and moreover, we might still not know how to analyze the true effect of altmetrics among the scientific community and the general public. In any case, the growth of almetrics in recent years has been exponential and their potential is almost unlimited, so care must be taken to avoid giving them too much weight to the detriment of quality in scientific production. They should instead be agents of change and responsible scientific communication.
Similarly to a JCR, Altmetric published the list of 100 articles with the greatest media impact in 2018. The spectrum is highly diverse, ranging from topical issues, such as climate change or gender differences, to the fact that the wine glasses in England have doubled in size over the past 300 years,18 highlighting the complexity of both scientific production and consumption. Indeed, one of these publications states that scientists are interested in disseminating the results of their research through Twitter, but that beyond a threshold of 1000 followers, the recipients of the information do not necessarily have extensive scientific training. Thus, reaching such a wide audience can on the one hand be exciting, but at the same time a matter of concern.19 Researchers are therefore responsible for the social impact of the results of their publications and the exponential dissemination offered by social networks,20 and must aim to combine the social impact of their results with the publication of qualitatively and quantitatively accurate evidence in their dissemination and communication strategies.21
The potential of immediate disclosure via media and social networks is undeniable, and previous studies have explored the sustainability of the process in which consultation was not in fact the first option.22 When talking about numbers, whether website traffic or general consultations using search engines, the difference with conventional citations, where growth is more sluggish, is enormous.23 It is clear that the higher impact journals are paying increasing attention to these indicators and dedicate considerable space to them in their websites, but platforms such as Open Access (OA) journals may generate a greater number of consultations or higher readership, although in the case of OA, there is no guarantee that the highest quality scientific content is being accessed. It has been suggested that OA journals (AB is not OA) have a greater media impact for the obvious reason that they are available to any Internet user, even those who are not health professionals.16,17 Be that as it may, in this age of fake news and post-truth, to which medical science is unfortunately not immune, we scientists are obliged to compare and critically evaluate the enormous amount of information to which we are exposed.24
It has been suggested that altmetrics should not be used because they are more easily manipulated than conventional metrics: they can be swayed by the strategies used by journals to publicize their articles on social networks,25 and they are not exempt from the issues that plague conventional citations, such as self-citation.26 Between 2014 and 2016, AB published 1 tweet for each article, and these were counted by the aggregators used in this study, but now it publishes 1 tweet per number, instead of per article. We do not believe or suppose this to be common practice among scientific journals, although a recent study of altmetrics in microbiology found that more than half of the Twitter accounts disseminating publications in the field were “bots”, software that automatically performs repetitive tasks via the Internet.27 As mentioned above, human beings are complex creatures, not only as producers and consumers of science, but also, in the case of social networks, as disseminators. A recent logarithmic analysis of Twitter found that only 41% of recommended publications are effectively read, or to put it another way, 6 of every 10 suggestions we make are not even read,28 with the result that headline-grabbing titles achieve a high media impact, even though the verification of their content might be limited.
LimitationsAn important limitation of this study was that, to our knowledge, no similar study has been published in other respiratory medicine journals, so we are unable to compare our findings. Moreover, the dizzying pace at which these indicators can change means that this analysis is no more than a mere snapshot of what happened over a 3-day period, and may not be representative of their real dynamics. Altmetrics are not the only modern indicators to be proposed, and now the contributions of the first and last author, the year of the first publication of the first author, or only those who have more than 10 citations are taken into account.29 An inherent limitation of altmetrics involves the behavior of the Internet user, who can opine positively or negatively on any publication; this is not comparable with a conventional citation, which can always be assumed to be positive and is usually the quality indicator of a magazine or publication.30 However, the interest of the scientific community in these metrics is clearly growing, and this study may be a starting point for developing the use of these indicators in AB.
StrengthsAlthough this study involved 1 specific journal, it covers an acceptable time period that encompasses the growth of social networks and aggregators. In this, it differs from other studies that arbitrarily selected the most cited publications, thus offering a biased overview by including only their best works, if, that is, citations received can be considered the appropriate parameter for that purpose. Another strength of our study is that we analyzed more than 1 aggregator, and included journal website traffic, giving a more complete picture of the situation.
ConclusionsIn our study we found that consensus articles and those published by pulmonologists as the first author had the greatest media impact. We cannot conclude that one aggregator is superior to another because their differences make them complementary. We do not believe that these altmetrics are superior to conventional metrics, although they will probably become synchronous methods for assessing the impact of scientific publications on a large and small scale. These aggregators are important because they offer the opportunity of determining the desires and preferences of Internet and social network users, which includes nearly all of us in the 21st century. Archivos de Bronconeumologia is not immune to this trend, and we must monitor closely this interesting direction in scientific production which has revolutionized the conventional approach to publications.
AuthorshipDaniel López-Padilla participated in data collection and is responsible for the integrity and accuracy of the analysis. He also contributed to the study design, interpretation, analysis and drafting of the final document. Marta Pérez-Gallan contributed to data collection and interpretation, and drafting the final document. Luis Puente Maestú and Gonzalo Segrelles-Calvo contributed to the interpretation and drafting of the final document. Francisco García-Río, Adolfo Alonso-Arroyo and José Ignacio Granda-Orive contributed substantially to the study design, interpretation, analysis, and drafting of the final document.
Conflict of interestsThe authors state that they have no conflict of interests.
The following is Supplementary data to this article:
Please cite this article as: López-Padilla D, García-Río F, Alonso-Arroyo A, Pérez Gallán M, Puente Maestú L, Segrelles-Calvo G, et al. Análisis de las métricas alternativas de Archivos de Bronconeumología durante el periodo 2014-2018. Arch Bronconeumol. 2020;56:298–305.


