

To evaluate the role of ultrasonography (USG) in the diagnosis of bleomycin-induced pulmonary toxicity (BT).
Material and methodsThe study included patients with suspected BT during treatment with bleomycin due to various oncologic diseases between June 2015 and May 2017. The patients initially underwent clinical and high-resolution computed tomography (HRCT) examinations and pulmonary function tests (PFT)-diffusing capacity of the lung for carbon monoxide (DLCO), followed by registration of USG findings—number of comet tail artifact (CTA) images by a different pulmonologist. We compared the findings from USG, HRCT, and PFT–DLCO tests between BT and non-BT groups. With the diagnosis based on clinical-radiologic and PFT–DLCO assessments taken as the gold standard, we determined the sensitivity and specificity of the USG outcomes for diagnosis of BT.
ResultsThe study included a total of 30 patients. Nine patients were diagnosed as having BT according to their clinical and radiologic findings and PFT–DLCO measurements. The mean number of CTA images was 68.7±22 in patients with BT vs 28.2±9.3 in those without BT (P<.001). The difference in CTA images between the patients with and without ground glass density was statistically significant (28.3±9.5 and 64.6±24.5, respectively, P<.001). In patients with BT, there was a negative correlation between the number of CTAs and DLCO% and FVC% values (P=.004; P=.016). USG had a sensitivity of 100%, and a specificity of 95% diagnosing BT in selected patients.
ConclusionIn bleomycin-induced toxicity, USG findings are correlated with HRCT and PFT–DLCO findings, with a remarkably increased number of CTAs in BT. Thoracic USG examination is a diagnostic tool with a high sensitivity and specificity for diagnosing BT.
evaluar el papel de la ecografía en el diagnóstico de la toxicidad pulmonar inducida por bleomicina (BT).
Materiales y métodosse incluyeron pacientes con sospecha de BT durante el tratamiento con bleomicina por enfermedad oncológica entre junio de 2015 y mayo de 2017. Se les sometió a evaluación clínica inicial y tomografía computarizada de alta resolución (TACAR), así como a pruebas de función pulmonar (PFP, prueba de difusión de monóxido de carbono [DLCO]). Se recopilaron los hallazgos ecográficos obtenidos por otro neumólogo (número de imágenes de artefacto en cola de cometa [CTA]). Se compararon los resultados de las ecografías, TACAR y PFP–DLCO entre los grupos con y sin BT. Con el diagnóstico basado en las valoraciones clínico-radiológicas y de PFP–DLCO como gold standard, se determinó la sensibilidad y especificidad de la ecografía para diagnosticar BT.
ResultadosSe incluyeron 30 pacientes. Se diagnosticó BT en nueve por los hallazgos clínicos y radiológicos y de PFP–DLCO. El número medio de imágenes CTA fue 68.7±22 en pacientes con BT vs. 28.2±9.3 en aquellos sin BT (p<0.001). La diferencia en imágenes CTA entre los pacientes con y sin densidades en vidrio esmerilado fue estadísticamente significativa (28.3±9.5 and 64.6±24.5, respectivamente, p<0.001). En pacientes con BT, se observó una correlación negativa entre el número de CTA y los valores porcentuales de DLCO y de CVF (p=0.004; p=0.016). La USG tuvo una sensibilidad del 100% y una especificidad del 95% para el diagnóstico de la BT en pacientes seleccionados.
ConclusiónEn la toxicidad inducida por bleomicina, los hallazgos de US se correlacionan con los de TACAR y PFT–DLCO, con un incremento remarcable en el número de CTA en BT. La exploración torácica mediante USG es una herramienta de diagnóstico con elevada sensibilidad y especificidad para el diagnóstico de la BT.
Bleomycinis is an antineoplastic agent that is effectively used for the treatment of cancers such as germ cell tumors, lymphomas, and cervical carcinoma.1 One of the most common adverse effects is pulmonary toxicity, which leads to diffuse alveolar damage in the lungs. The toxic effect occurs in two phases. During the initial phase, there is an accumulation of neutrophils, lymphocytes, and macrophages in the interstitial and alveolar areas. In the second phase, damage occurs in the pulmonary interstitial tissue mediated by reactive oxygen molecules and proteases, as well as fibrosis, along with the initiation of a repair process for this damage.2,3 Experimental studies provided evidence for infiltration of inflammatory cells such as neutrophils, macrophages, and lymphocytes, accumulation of collagen into the lungs, and myofibroblast activation, with increased release of cytokines, chemokines, and profibrotic mediators in bronchoalveolar lavage fluid.4
Bleomycin-induced toxicity (BT) is a rare condition, but has a high morbidity and mortality.5 Thus, early diagnosis and treatment is important.6 It is clinically/radiologically diagnosed through clinical symptoms such as shortness of breath and dry cough, which occur during the course of treatment; crepitant rales during the physical examination; changes in high-resolution computed tomography (HRCT) of the lung not seen in prior radiologic imaging that cannot be attributed to any other cause, and which are consistent with interstitial lung diseases; and decreased diffusing capacity of the lung for carbon monoxide (DLCO), which cannot be explained by another cause in patients who received bleomycin.7
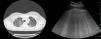
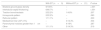
Thoracic ultrasonography (USG) is widely used for the diagnostic procedures in the field of chest diseases.8 Another little known area of use is for diagnosis of diseases involving the interstitium, mainly interstitial lung disease (ILD) and pulmonary edema. Interstitial inflammation, fibrosis, thickened interstitial surface, and thickened interlobular septa are common in diseases involving the interstitium of the lung.9 High-frequency sound waves are transmitted to tissues using USG. An image is generated on the monitor when these sound waves are reflected or refracted back to the USG probe. Multiple sound waves traveling back and forth between the tissue and probe or between two tissues is called reverberation artifact. In the absence of any pathology, a normal lung cannot be imaged well sonographically because it contains air. However, ILD involves the interstitium of the lung. The changes associated with this involvement and thickening interlobular septa lead to comet tail artifact (CTA), a type of reverberation artifact that can be detected using USG. CTA occurs when a sound beam meets a reflective surface. A dense tail image is generated behind the bouncing echoes that return to the transducer, with a tapering echogenic line10,11 (Fig. 1).
This study was designed to evaluate the diagnostic value of thoracic USG, an easy and readily available and reproducible imaging procedure without radiation exposure in the assessment of BT.
Material and MethodsPatient PopulationThis prospective cross-sectional study was designed according to the International Helsinki Declaration. Upon receipt of approval of the local ethics committee, patients referred to the thoracic diseases inpatient/outpatient service of our hospital due to suspected BT during treatment with bleomycin for several oncologic diseases between June 2015 and May 2017 were enrolled in the study. Patients with a prior diagnosis of ILD and congestive heart failure were excluded. Patients were initially evaluated through a comprehensive clinical examination for BT, physical examination (PE), HCRT, pulmonary function test (PFT), and DLCO by a pulmonologist. A clinical and radiologic diagnosis of BT was made based on clinical symptoms such as shortness of breath and dry cough, which were previously not seen, but occurred during the course of treatment, crepitant rales during PE, changes in HRCT not seen in prior radiologic imaging that could not be attributed to any other cause, and which were consistent with ILD, and decreased diffusing capacity (DLCO), which could not be explained by another cause.12 Then, a different pulmonologist, who only knew the clinical examination results before HCRT and PFT–DLCO findings, detected and registered the number of CTAs in thoracic USG.
High-Resolution Computerized TomographyHRCTs were obtained after deep inspiration using a high-resolution technique from the axial plane, starting with the apex toward the end of the diaphragm, with 15-mm table movement, at 120kV, 200mA, with a section thickness of 2mm, at a 512×512 matrix and bone algorithm using a Siemens Medical Solutions-2010 (Forchheim, Germany) device without the use of contrasting agent. Images were obtained with a window width of 1200 Hounsfield units (HU), at a window level of 700 HU.
Pulmonary Function Test and Carbon Monoxide Diffusion TestThe PFT–DLCO tests of the participants were conducted according to the Guidelines of the American Thoracic Society (ATS) and European Respiration Society (ERS) for the standardization of pulmonary function tests.13,14 The SFT and DLCO measurement tests were performed on a Sensor Medics Vi-Max 22, Care Fusion (San Diego, California) device using the single breath technique. With normal test values falling between 80 and 120% of the predicted value for each lung volume, forced vital capacity (FVC), forced expiratory volume in one second (FEV1), and FEV1/FVC values were recorded in liters and percentages. The ratio of DLCO (mL/min/mmHg/Lt) and DLCO/alveolar ventilation (VA) (DLCO/VA, %) was recorded in liters and percentages with normal test values falling between 80 and 120% of the predicted value for each lung volume.
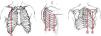
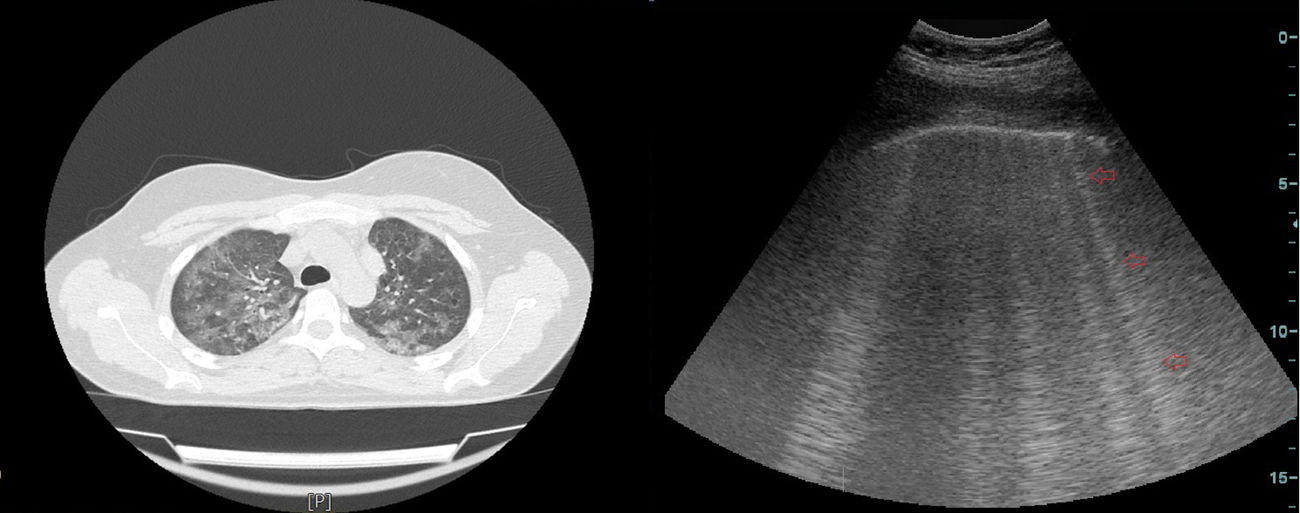
Thoracic USGThoracic USG was performed by an experienced pulmonologist using a General Electric (GE) Logic 7 system with a 3.5MHz convex probe in the abdominal mode. Sonographic screening of the thorax was conducted on predefined anatomic lines. One of these anatomic lines was the linea mid-clavicularis, a vertical line passing through the midpoint of the claviclein anterior thorax. Another one was the linea axillaris anterior, passing through the plica axillaris anterior in the lateral side of the thorax; the linea axillaris media, a vertical line originating from the apex of the axilla and the linea axillaris posterior. Finally, in the posterior part of the thorax, the lines were the linea scapularis, a vertical line passing through the angulus inferior scapula, and the linea paravertebralis, which runs parallel to the vertebral column (Fig. 2).
Definition of CTA and Clinical-ultrasonographic Diagnosis of BT
CTA was defined as an hyperechogenic coherent bundle, starting at a narrow basis from the visceral pleural space, and enlarging and extending to the periphery along the screen provided that USG probe, which was located at the intercostal interval10 (Diagram 1). The probe was moved longitudinally along the intercostal spaces in line with each predefined anatomic line, with patients in the sitting position in order to determine the area with the highest number of CTAs. The number of CTAs in this area was recorded. Those with a CTA number of <3 were considered normal. The clinical-ultrasonographic diagnosis of bleomycin-induced toxicity was made in patients with three or more CTAs, and clinically in the presence of findings consistent with BT.15
With a BT diagnosis based on clinical, radiologic, and spirometric characteristics considered as the gold standard, the sensitivity, specificity, and positive and negative predictive values of the clinical-ultrasonographic modality in diagnosing BT were evaluated. We compared the clinical, radiologic, spirometric, and ultrasonographic (number of CTAs) findings of the patients with a final diagnosis of BT with those of patients without BT.
Statistical AnalysisStatistical analysis was performed using the SPSS 17.0 (IBM Inc., Released 2008, SPSS Statistics for Windows; Chicago, USA) software program. In descriptive statistics, continuous variables are expressed as mean±standard deviation, and categorical variables as percentages. For normal distribution tests, we used the Kolmogorov–Smirnov test. Group data were evaluated using the Mann–Whitney U-test. A correlation analysis was performed to evaluate the relationship between PFT–DLCO parameters and the number of CTAs in patients. The correlation coefficient is expressed as r. A P-value of <.05 was considered statistically significant in all tests.
ResultsThe study included 30 of 32 patients who presented to the Outpatient Clinic of Chest Diseases with suspected BT; two patients were excluded due to prior diagnosis of congestive heart failure. The mean age of the patients was 40.2±14.2 years (range, 22–69 years). Nine (30%) were female, and 21 (70%) were male. Thirteen (43.3%) patients were ex-smokers and 17 (56.7%) were non-smokers. The mean history of smoking was 18.6±13.1 pack-years (range, 2–45 pack-years). A review of the distribution of primary diseases showed that 17 (56.7%) patients had Hodgkin's lymphoma, 9 (30%) had testis tumors, and 4 (13.3%) had non-Hodgkin's lymphoma. Twenty (66.7%) patients had no symptoms of chest diseases, but 6 (20%) had new-onset shortness of breath, 3 (10%) had new-onset cough, and 1 (3.3%) patient had chest pain. Physical examination showed that 24 (80%) patients had normal PE. Five patients (16.7%) had bilateral basilar rales, and one (3.3%) patient had decreased breathing sounds.
Nine patients were diagnosed as having BT based on the clinical and radiologic findings and PFT–DLCO values. BT was not considered in 21 patients. The mean number of CTAs as determined using thoracic USG was 68.7±22 in patients diagnosed with BT vs 28.2±9.3 in those without BT (P<.001) (Table 1).
Distribution of CTA Images by Anatomy.
| With BT (n=9) | Without BT (n=21) | P value | |
|---|---|---|---|
| Linea para vertebralis, right | 6.5±2.8 | 1.6±1 | <.001 |
| Linea scapularis, right | 7.2±3.1 | 2.2±1.4 | <.001 |
| Linea axillaris posterior, right | 5.4±1.8 | 3.1±1.4 | .004 |
| Linea axillaris media, right | 7±3 | 2.9±1.9 | .001 |
| Linea axillaris anterior, right | 6.2±3.4 | 2.3±1.1 | .003 |
| Linea midclavicularis, right | 4.4±1.8 | 2.1±1.3 | .002 |
| Linea para vertebralis, left | 5.6±2.9 | 1.7±1.1 | <.001 |
| Linea scapularis, left | 7.6±3.2 | 2.2±1.4 | <.001 |
| Linea axillaris posterior, left | 5.2±2.6 | 3±1.1 | .012 |
| Linea axillaris media, left | 5.2±1.7 | 2.7±1.3 | .001 |
| Linea axillaris anterior, left | 4±2 | 1.9±1.2 | .004 |
| Linea midclavicularis, left | 3.4±2.4 | 1.9±0.9 | .104 |
| Mean CTA | 68.7±22 | 28.2±9.3 | <.001 |
| No. of CTA images per ICI | 5.6±1.8 | 2.3±0.7 | <.001 |
CTA: comet tail artifact. ICI: intercostal interval.
HRCT findings showed that in those with BT, nine (100%) patients had bilateral ground glass densities, six (66.7%) had interlobular septal thickening, and two (22.2%) patients each had honeycomb pattern and traction bronchiectasis. None of the patients in the group without BT showed evidence suggesting interstitial involvement in HRCT (Table 2).
HRCT Findings of Patients.
| With BT (n=9) | Without BT (n=21) | P value | |
|---|---|---|---|
| Bilateral ground glass density | 9/100% | – | <.001 |
| Interlobular septal thickening | 6/66.7% | – | <.001 |
| Traction bronchiectasis | 2/22.2% | 1/4.8% | .207 |
| Honeycomb pattern | 2/22.2% | – | .083 |
| Reticular pattern | 1/11.1% | – | .300 |
| Mediastinal-hilar LAP (n/%) | – | 3/14.3% | .534 |
| Parenchymal nodules greater than 1cm | – | 4/19% | .287 |
| Other | 1/11.1% | 3/14.3% | .519 |
LAP: lymphadenopathy.
In HRCT, the difference in the number of CTAs between patients without interlobular septal thickening and those with interlobular septal thickening was statistically significant (32.2±16.3 and 73.3±18.2, respectively, P<.001). The difference in the number of CTAs between patients without ground glass densities and those with ground glass densities in HRCT was statistically significant (28.3±9.5 and 64.6±24.5, respectively; P<.001).
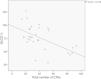
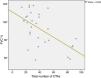
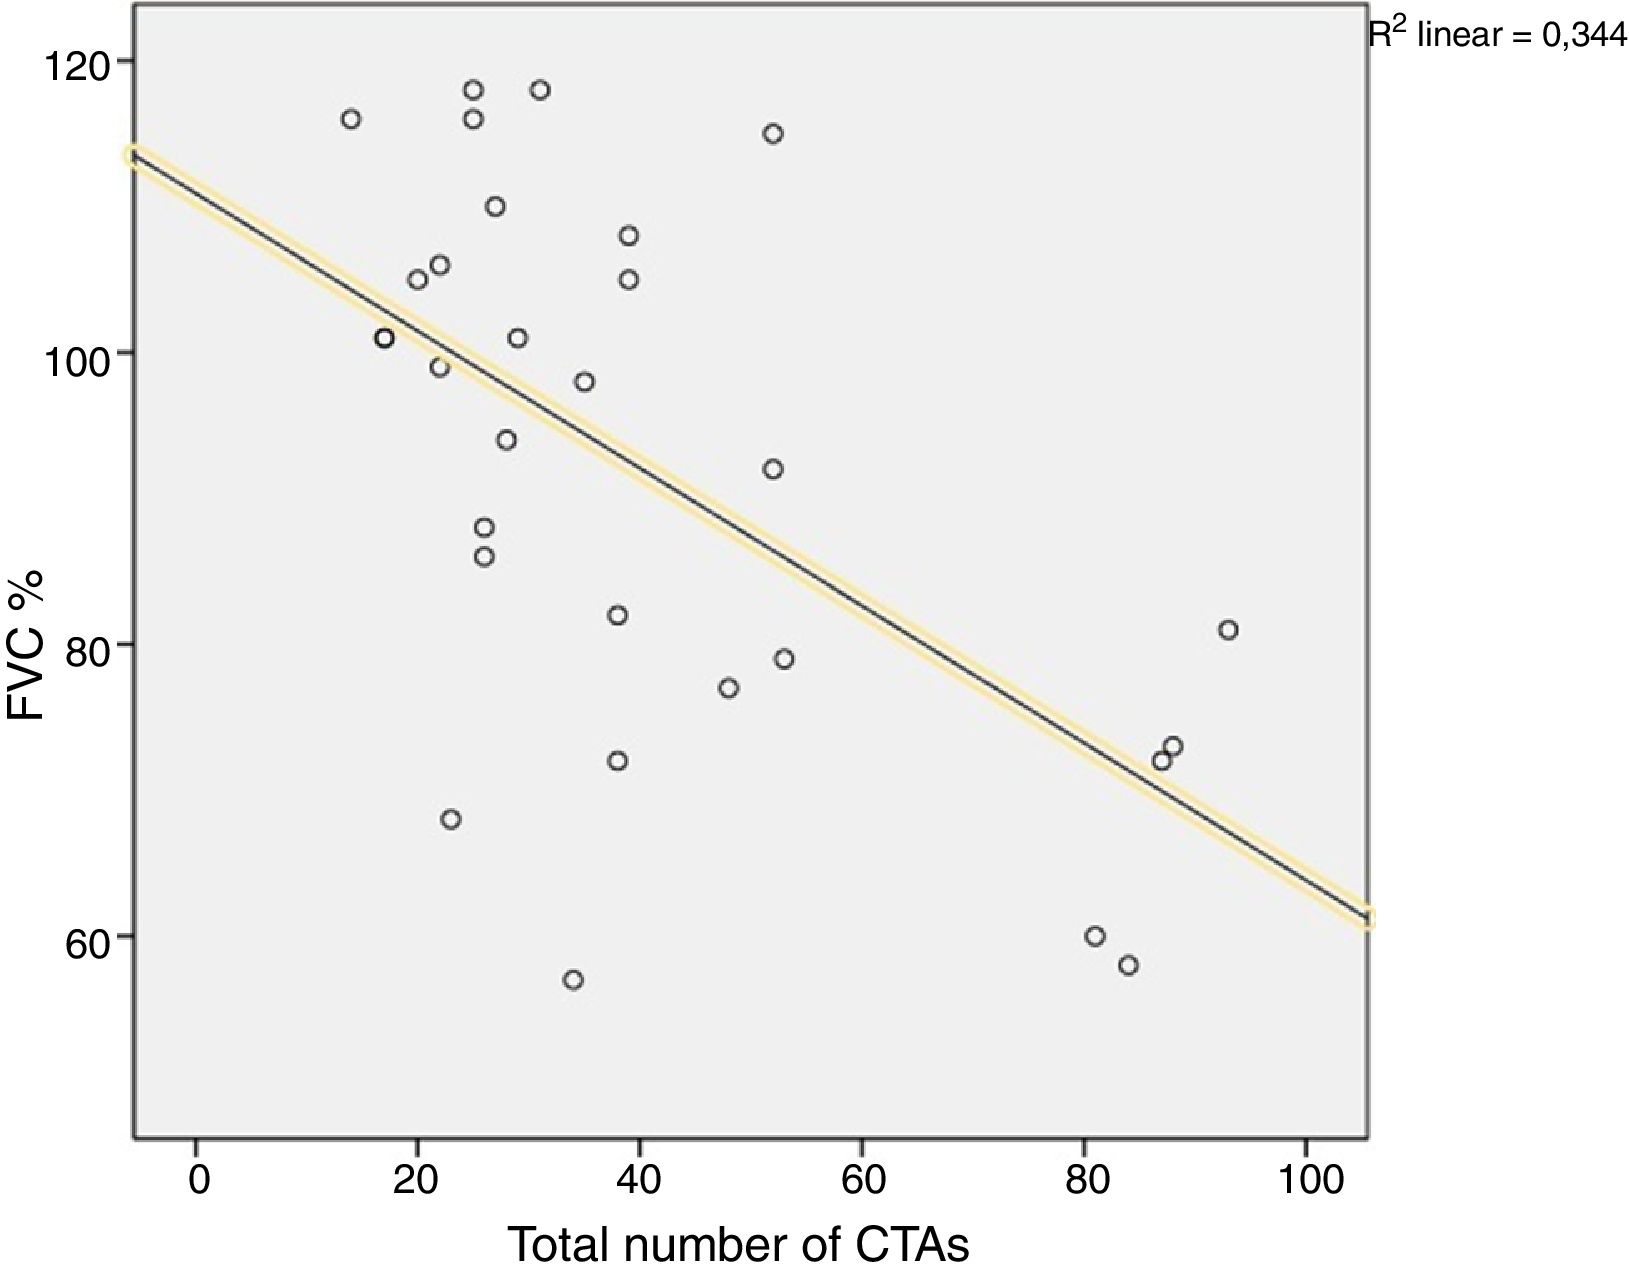
A comparison of PFT and DLCO findings between the two groups showed that FVC% and DLCO% values were significantly lower in the group with BT compared with the non-BT group (76 and 98%, respectively, P=.003; 51 and 86%, respectively, P<.001). The PFT–DLCO values of the patients are given in detail in Table 3. A negative correlation was found between the number of CTAs and DLCO percentages (P=.004; r=−0.51) (Fig. 3). The difference in the number of CTAs was statistically significant between patients with a DLCO% of <70 and those >70 (62±27.3 and 29.6±10.8, respectively; P=.002). A negative correlation was found between the number of CTAs and FVC percentages (P=.016; r=−0.43) (Fig. 4). In PFT, the difference in the number of CTAs was statistically significant between patients with an FVC percentage of <80 and those >80 (59.5±25.6 and 32.2±17.3 respectively, P=.006).
PFT–DLCO Measurements of Patients.
| With BT (n=9) | Without BT (n=21) | P value | |
|---|---|---|---|
| FEV1/FVC (mean/SD) | 79.5±4.8 | 76.5±8.1 | .114 |
| FEV1(Lt) (mean/SD) | 2.57±0.85 | 3.3±0.85 | .063 |
| FEV1% (mean/SD) | 75±19.8 | 89±12.2 | .070 |
| FVC(Lt) (mean/SD) | 3±1 | 4±0.8 | .019 |
| FVC% (mean/SD) | 76.1±18.6 | 98.6±17.7 | .003 |
| DLCO (mL/min/mmHg) (mean/SD) | 5.1±2.1 | 7.9±2.7 | .004 |
| DLCO% | 51.7±18.9 | 86±16.3 | <.001 |
| DLCO/VA (mL/min/mmHg/Lt) (mean/SD) | 1.2±0.2 | 1.6±0.2 | .003 |
| DLCO/VA% | 79.2±19.5 | 97.2±19.1 | .094 |
DLCO: carbon monoxide diffusion capacity; FVC: forced vital capacity; FEV1: forced expiratory volume in 1 second; VA: alveolar volume.

Ten patients received a clinical-ultrasonographic diagnosis of BT and 20 patients had no BT. In patients with BT whose diagnoses were based on clinical-radiologic and DLCO findings, the sensitivity, specificity, and positive and negative predictive values of thoracic USG were found as 100, 95, 90, and 100%, respectively.
DiscussionWe found that the patients whose BT was diagnosed based on their clinical, radiologic, PFT, and DLCO characteristics had a significantly greater number of CTAs as determined using thoracic USG. There was a negative correlation between DLCO% and FVC% values and CTAs in patients with BT. HRCT showed that in patients with ground glass densities and interlobular septal thickening, the number of CTAs was statistically significantly higher. Thoracic USG had a 100% sensitivity and 95% specificity in diagnosing BT. Our study is important because it draws attention to the role of thoracic USG, a reliable, non-invasive, easily available imaging modality performed by a pulmonologist and with no radiation exposure to the physician and the patient, as a potential modality in the diagnosis of BT.
Thickening of interlobular septa is seen in diseases involving the interstitium of the lung such as ILDs and pulmonary edema. CTAs are detected sonographically through the bouncing of sound waves from thickened interlobular septa. Three or more CTAs as sonographically detected from the area between two costas suggest interstitial involvement.16–20 In our study, the mean number of CTAs was 2.3 in the non-BT group vs 5.6 in the BT group (P<.001). As a result of the acute exudative phase, which begins with cell accumulation in the interstitial area in BT and the organization period in which a repair process is observed, HRCT shows patchy or diffuse ground glass opacities, interlobular septal thickening, and fibrosis. Progression of fibrosis results in the development of a honeycomb appearance.21 In thoracic USG, the number of CTAs is increased with parenchymal changes such as fibrosis and interlobular septal thickening, and these penetrate ultrasonic sound waves in lungs, which typically contain air.22 Lichtenstein et al.23 in 1997 were the first to show that the number of CTAs increased in patients developing diffuse interstitial fibrosis using USG. In comparative studies with HRCT, HRCT being the gold standard, in diseases leading to pulmonary fibrosis, mainly connective tissue diseases revealed increased numbers of CTAs with thoracic USG, thereby demonstrating its value as an imaging modality, and many studies demonstrated that the number of CTAs increased significantly in the presence of findings consistent with ILD in HRCT.24–26 Gargani et al.27 reported that the number of CTAs was positively correlated with the degree of pulmonary fibrosis in HRCT. In our study, the main HRCT findings in patients with BT included bilateral ground glass densities (100%) and interlobular septal thickening (66.7%). In a study evaluating the role of thoracic USG in the diagnosis of ILD in patients with systemic sclerosis, Barskova et al.15 found that the presence of CTAs was correlated with ILD in HRCT. In their study, there was a statistically significant difference in the number of CTAs between patients with and without ILD on HCRT (P<.001). Similarly, the number of CTAs was significantly higher in patients with ground glass densities compared with those with none on HCRT (P<.05). Our findings are consistent with those of Barskova et al. In our study, the number of CTAs was 64 in patients with BT who had ground glass densities vs 28 in patients with no ground glass densities on HRCT (P<.001).
Although they are no established criteria for monitoring BT along with respiratory function tests and DLCO tests, reductions of more than 15%–25% in vital capacity and DLCO values, which were previously normal in PFT–DLCO as well as cough, shortness of breath, which cannot be explained by any other cause, bilateral crepitant rales, and other unexplained changes in HRCT suggest BT.14,28 Bleomycin is associated with necrosis of type 2 pneumocytes and alveolar epithelial cells, resulting in diffuse alveolar damage in the lungs.29 With a pathophysiologic mechanism similar to other ILDs, there is an accumulation of inflammatory and immune effector cells within the alveolar-capillary unit in BT. Progression of resulting alveolitis and initiation of repair mechanisms naturally lead to fibrosis.4 These changes in the alveolar-capillary unit disrupt gas exchange in the alveolar-capillary membrane and manifest with changes such as decreased lung volumes (vital capacity) and reduction in DLCO.30 This damage to the interstitium of the lung results in increased capillary permeability, interstitial edema, hyaline membranes during the acute period, and proliferation of type 2 pneumocytes, changes in interstitial connective tissue, interlobular septal thickening, and interstitial fibrosis during the late period. A normal lung exhibits permeability to ultrasonic sound waves because it contains air in its tissue, thus USG has poor imaging performance. With the interstitial changes due to diffuse alveolar damage by bleomycin as described above, there are increased CTAs in BT. Many studies showed that there was a reverse correlation between the number of CTAs determined using USG in ILD and FVC and DLCO values.15 In a study evaluating the efficacy of thoracic USG in patients with systemic sclerosis, Edis et al.16 examined a total of 48 patients using thoracic USG and showed a negative correlation between DLCO values and the number of CTAs (r=−0.56; P=.0001). In a prospective study, Hasan and Makhlouf22 compared CTAs determined using thoracic USG in ILD with HRCT and PFT findings and showed a negative correlation between DLCO values and frequency of CTAs (r=−0.817, P<.001). The authors concluded that thoracic USG might be of benefit in evaluating ILDs.
Our study was designed to demonstrate that thoracic USG might be a new imaging modality in diagnosing BT. HRCT and PFT–DLCO are certainly very valuable methods in the diagnosis of BT, which is a disease with high morbidity and mortality. However, HRCT cannot be repeated frequently due to a radiation exposure equivalent to 250–300 chest radiographs with 5–7mSv, and being relatively expensive.31 PFT–DLCO tests may not always be used because it requires a patient's cooperation, it is always difficult to perform in older patients, and it may not be available in the early period in patients with rapidly worsening manifestations, particularly with BT.32 Thoracic USG, which can be repeated frequently and does not expose the patient and physician to radiation, is relatively inexpensive, easy to perform at the patient's bedside, and easy to use by well-trained pulmonologists, can have advantages over HRCT and PFT–DLCO because of all these reasons. On the other hand, the disadvantages of thoracic USG are that it is operator-dependent, it is difficult to obtain images in obese patients, and CTAs are not specific to BT (they can be seen in pulmonary edema or a different ILD).
Almost all USG studies conducted in patients with ILD have investigated diagnostic usability of USG imaging.33 A literature search revealed two case presentations investigating the usability of chest USG in the follow up of ILD and in the assessment of the response to treatment. One of these case presentations is about a patient with scleroderma. Buda et al.34 demonstrated a reduction in the number of CTAs in this patient following cyclophosphamide treatment for 6 months. The other patient was diagnosed with rheumatoid arthritis-associated ILD, and Laria et al.35 reported that CTAs were no more detectable by USG, following treatment with methotrexate and prednisone. These cases suggest that USG may be used in combination with HRCT, in patient follow and in the assessment of responses to treatment, considering that patients mostly recover from bleomycin toxicity, particularly if detected and treated earlier. Randomized controlled studies demonstrating reductions in the number of CTAs detectable by USG may provide further clarification.
This study has some limitations. It was conducted with a small number of patients, reflecting experience only in a single center; therefore, the results cannot be generalized. Another limitation is that the inter-observer variability is unknown because thoracic USG was performed by a single pulmonologist.
In conclusion, thoracic USG performed by a chest physician has a high sensitivity and specificity in diagnosing BT. Use of thoracic USG in follow up of BT can be demonstrated if studies are conducted showing decreased numbers of CTAs in patients monitored using thoracic USG, which are further supported by clinical-radiologic examinations and PFT–DLCO values. Although healthy lung parenchyma cannot be visualized using USG, we believe that diffuse lung parenchyma involvement such as ILD can be well evaluated using USG.
Conflict of InterestsThe authors declare that they have no conflict of interests.
We thank MD İlker Akin for his contribution with his illustrations.


