


The aim of this study was to assess the performance of the National Early Warning Score 2 (NEWS2) in predicting a short-term complicated outcome in stable patients with acute symptomatic pulmonary embolism (PE). We also studied the ability of the NEWS2 score compared with the simplified Pulmonary Embolism Severity Index (sPESI) for identifying low-risk patients with acute PE.
MethodsWe performed a retrospective analysis of a prospective cohort composed of 848 patients with acute PE. The NEWS2 and the sPESI were calculated for each patient according to different clinical variables. We assessed the predictive accuracy of these scores for a 30-day complicated outcome using the C statistic, which was obtained by logistic regression models and ROC curves. We also assessed the test and performance characteristics of the low-risk versus high-risk categories of each prediction rule.
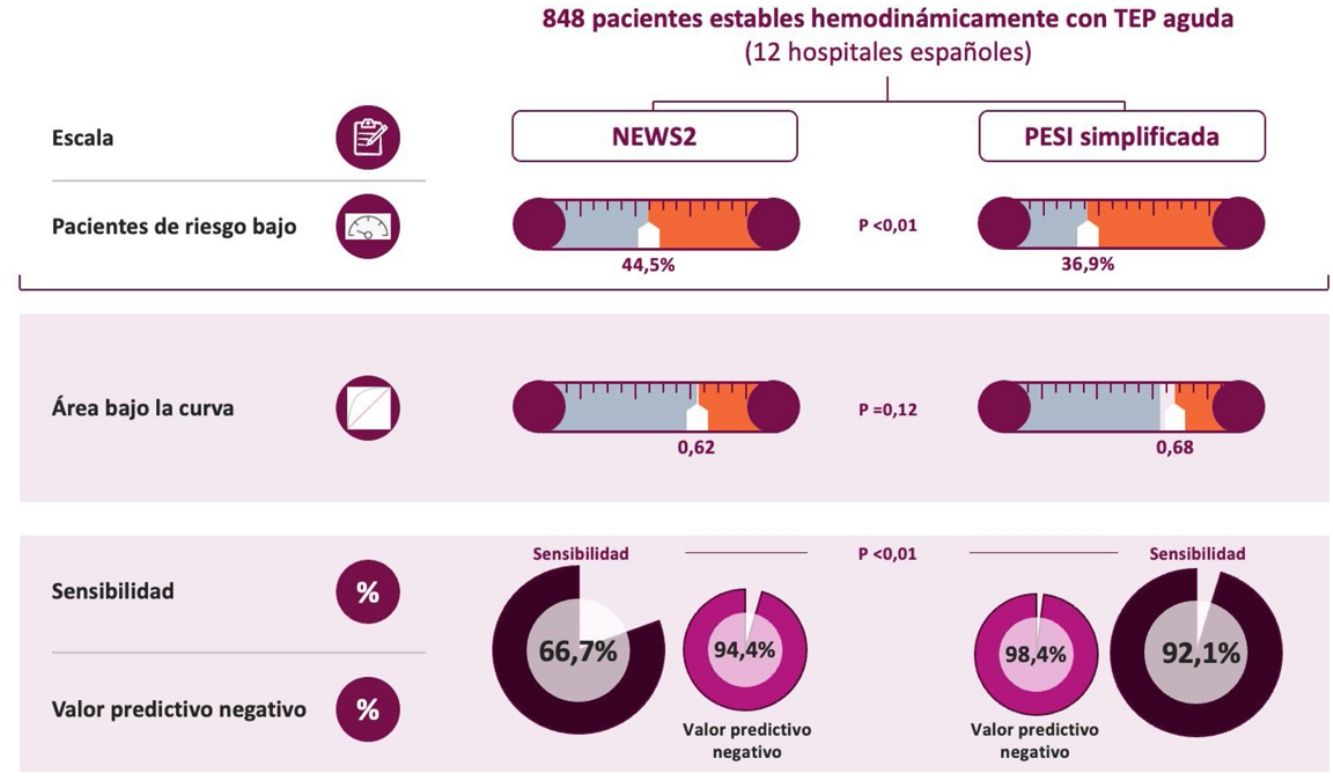
ResultsOverall, 63 out of 848 patients died (7.4%; 95% confidence interval, 5.7%-9.2%) during the first month of follow-up. Both scores showed a similarly poor predictive value for 30-day complicated outcome (C statistic, 0.68 and 0.62). The sPESI classified fewer patients as low-risk (36.9% versus 44.5%; P<0.01). Compared with the NEWS2 score, the sPESI showed significantly higher sensitivity (92.1% versus 66.7%) and a better negative predictive value (98.4% versus 94.4%).
ConclusionBoth scores provide similar information for stratifying the risk of a complicated outcome in stable patients with PE. The sPESI identified low-risk patients with PE better than the NEWS2 score.
Clinical practice guidelines recommend early prognostic stratification of hemodynamically stable patients with acute symptomatic pulmonary embolism (PE).1,2 Risk stratification of stable patients with PE helps identify individuals at high risk of early death or complications associated with PE (intermediate-to-high risk PE) who could benefit from close monitoring or even reperfusion therapy.3,4 Alternatively, patients at low risk of early complications (death, thrombotic recurrences, and major bleeding) (low-risk PE) could be discharged early or even treated on an outpatient basis.5,6
The simplified Pulmonary Embolism Severity Index (sPESI) was developed to estimate early mortality in patients with acute symptomatic PE.7 It includes variables such as age (>80 years), history of cancer, history of chronic cardiopulmonary disease, heart rate (≥110 beats per minute), systolic blood pressure (SBP) (<100mmHg), and oxyhemoglobin saturation (<90%). A score of 0 for all the above variables is required to classify patients as low-risk. This score has been extensively validated for identifying patients with low-risk PE who could be treated on an outpatient basis.8,9
The National Early Warning Score 2 (NEWS2) is an early warning system that predicts clinical deterioration in patients with acute disease.10 It includes respiratory rate, oxyhemoglobin saturation, SBP, heart rate, level of consciousness, and temperature. Although it has been used in different clinical settings,11,12 only one small study has been published that evaluated the association between length of hospital stay and this predictive score in 391 patients with PE.13 However, it has not been extensively validated for the identification of patients with low-risk PE who could be treated on an outpatient basis.
The aim of this study was to validate the NEWS2 score and compare it with the sPESI score in a cohort of hemodynamically stable patients diagnosed with acute symptomatic PE. As a secondary objective, we assessed the usefulness of NEWS2 compared to sPESI in the identification of patients with low-risk PE.
MethodDesignFor this observational study, we used data from the PROgnosTic ValuE of Computed Tomography Scan in Hemodynamically Stable Patients with Acute Symptomatic Pulmonary Embolism (PROTECT) study. Both the methodology and the main results of the PROTECT study have been published elsewhere.14,15 Briefly, this is a prospective, multicenter study that recruited stable patients with PE from 12 hospitals throughout Spain.
Patients and selection criteriaPROTECT included adult patients diagnosed with acute symptomatic PE using multidetector computed tomography angiography (angio-CT) of the chest. Patients who were hemodynamically unstable at diagnosis (SBP<90mmHg, cardiogenic shock, or need for vasopressor or inotropic drugs), those who required reperfusion therapy at diagnosis, pregnant patients, patients with difficulty complying with long-term follow-up, and individuals with a life expectancy of less than 3 months were excluded, at the discretion of the treating physician.
Prognostic scoresThe sPESI and NEWS2 risk scores were calculated from the clinical characteristics collected in the emergency department at the time of diagnosis of PE. The score established by each of the models was assigned to each of the variables. The total score for each of the patients was calculated by adding the models obtained for each of the prognostic variables included in the scale. The cut-off point for identifying high-risk patients is >0 for the sPESI score and >4 for NEWS2 score (or the presence of any variable with a score of 3).
Episodes analyzedThe primary endpoint was defined as the occurrence of a complicated clinical outcome in the month following diagnosis. Secondary endpoints were all-cause mortality, PE mortality, objectively confirmed non-fatal thromboembolic recurrences, and non-fatal major bleeding in the month following diagnosis. An independent committee, blinded to the prognostic test results of the patients, adjudicated all adverse events.
In this study, a complicated clinical outcome was defined as all-cause death, hemodynamic collapse (SBP<90mmHg for at least 15min, need for catecholamines due to hypotension or shock, need for fibrinolysis, need for orotracheal intubation, or need for cardiopulmonary resuscitation) after study inclusion, or recurrent PE within 1 month of diagnosis. The diagnosis of recurrent PE was confirmed by the presence of at least 1 new intraluminal filling defect on chest angiogram.16 Major bleeding was defined as clinical evidence of bleeding accompanied by 1 or more of the following criteria: drop in hemoglobin of at least 2g/dL; need for transfusion of at least 2 units of packed red blood cells; hemodynamic compromise requiring urgent intervention (administration of fluids or blood products, inotropic support, surgery, or other invasive procedures); intracranial, retroperitoneal, or critical site bleeding; or bleeding contributing to death.16
Statistical analysisCategorical variables are expressed as percentages and compared using the chi-square test. Continuous variables are expressed as mean±standard deviation or median (interquartile range) and compared using the Student t test or Mann–Whitney U test (for variables with non-normal distribution).
We assessed the discriminatory capacity of risk models for each of the clinical events using the C statistic. In general, a model with a C statistic>0.70 has an acceptable discriminatory capacity.17 To estimate the predicted probability of the event in question, we used logistic regression models to calculate the C statistic, introducing each of the clinical events as a dependent variable and each of the scores as a continuous quantitative independent variable.18 We then plotted that probability against the occurrence of the event in a receiver operating characteristic (ROC) curve to obtain the area under the curve or the C statistic, with its corresponding 95% confidence interval (CI).19 The C statistics of both risk models were compared using a non-parametric test developed by DeLong et al.20
For both scores, the occurrence of clinical events for each risk class (low and high) was estimated from the cumulative incidence (defined as the ratio between the number of events and the total number of patients at risk) during the follow-up period. Sensitivity, specificity, predictive values, and likelihood ratios were calculated for each scale. The exact 95% CI limits were estimated using the Wilson method.
For statistical analysis, we used SPSS (version 26, SPSS), and to compare the areas under the ROC curve of the models for clinical events we used MedCalc software (version 11.6.1, MedCalc Software). A 2-tailed P-value of <0.05 was considered statistically significant.
ResultsOf the 999 patients evaluated, 42 (4.2%) were excluded due to hemodynamic instability. Sixty-five patients (6.8%) were excluded because they did not have a technically adequate angio-CT or echocardiography. Other reasons for exclusion were the impossibility of long-term follow-up (n=23) and refusal to give informed consent (n=21). The study included the remaining 848 patients (416 men and 432 women). As the proportion of missing data was less than 2%, we analyzed the observed data (analysis of complete cases).
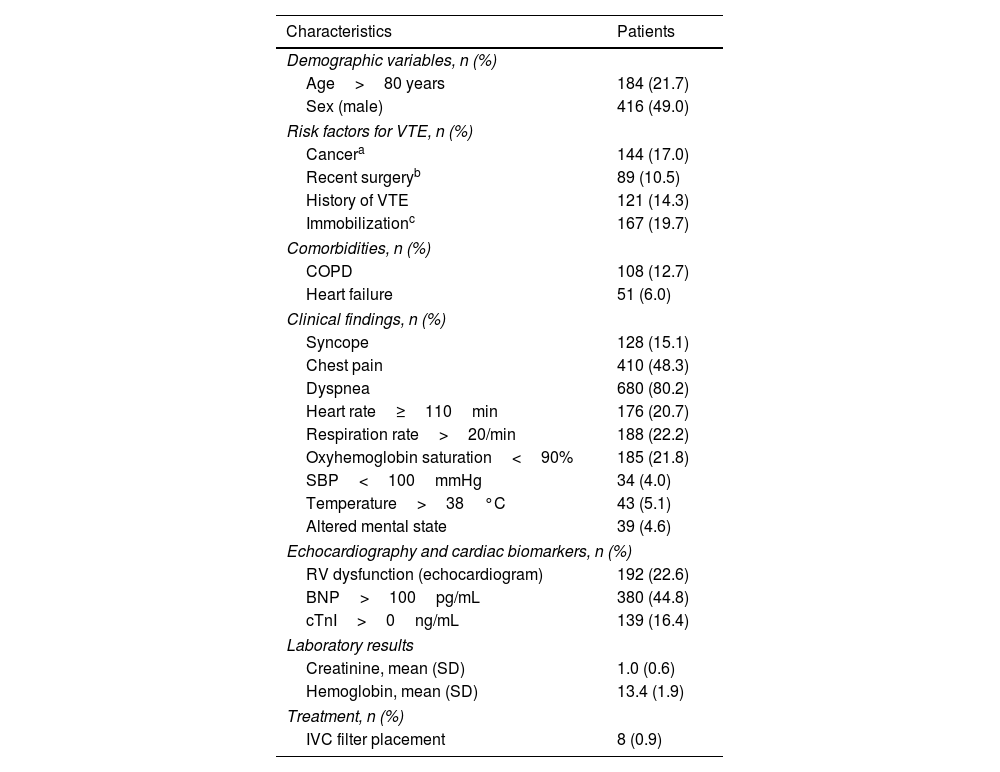
The characteristics of the patients included in the study are shown in Table 1. Of the 848 patients included, 192 (22.6%; 95% CI, 19.8–25.5%) had right ventricular echocardiographic dysfunction, 139 (16.4%; 95% CI, 13.9–18.9%) had raised cardiac troponin I levels, and 380 (44.8%; 95% CI, 41.5–48.2%) had raised brain natriuretic peptide levels. The number of patients treated with inferior vena cava filters was small (0.9%; 8 of 848 patients).
Baseline characteristics of the 848 patients included in the study.
| Characteristics | Patients |
|---|---|
| Demographic variables, n (%) | |
| Age>80 years | 184 (21.7) |
| Sex (male) | 416 (49.0) |
| Risk factors for VTE, n (%) | |
| Cancera | 144 (17.0) |
| Recent surgeryb | 89 (10.5) |
| History of VTE | 121 (14.3) |
| Immobilizationc | 167 (19.7) |
| Comorbidities, n (%) | |
| COPD | 108 (12.7) |
| Heart failure | 51 (6.0) |
| Clinical findings, n (%) | |
| Syncope | 128 (15.1) |
| Chest pain | 410 (48.3) |
| Dyspnea | 680 (80.2) |
| Heart rate≥110min | 176 (20.7) |
| Respiration rate>20/min | 188 (22.2) |
| Oxyhemoglobin saturation<90% | 185 (21.8) |
| SBP<100mmHg | 34 (4.0) |
| Temperature>38°C | 43 (5.1) |
| Altered mental state | 39 (4.6) |
| Echocardiography and cardiac biomarkers, n (%) | |
| RV dysfunction (echocardiogram) | 192 (22.6) |
| BNP>100pg/mL | 380 (44.8) |
| cTnI>0ng/mL | 139 (16.4) |
| Laboratory results | |
| Creatinine, mean (SD) | 1.0 (0.6) |
| Hemoglobin, mean (SD) | 13.4 (1.9) |
| Treatment, n (%) | |
| IVC filter placement | 8 (0.9) |
Abbreviations: BNP, brain natriuretic peptide; COPD, chronic obstructive pulmonary disease; cTnI, cardiac troponin I; IVC, inferior vena cava; RV, right ventricle; SBP, systolic blood pressure; SD, standard deviation; VTE, venous thromboembolic disease.
In the month following diagnosis, 38 patients died (4.5%; 95% CI, 3.1–5.9%). Death was attributed to PE itself in 11 patients (28.9% of all deaths; 95% CI, 14.5–43.4%), cancer in 11 (28.9%), other cardiopulmonary diseases in 9 (23.7%), bleeding in 3 (7.9%), and other causes in 4 (10.5%). Three patients (0.3%; 95% CI, 0–0.7%) were diagnosed with recurrent PE (2 fatal and 1 non-fatal), 19 patients (2.2%; 95% CI, 1.2–3.2%) had a major bleed, and 63 patients (7.4%; 95% CI, 5.7–9.2%) had a complicated clinical outcome. In addition to the 38 deaths (including 2 deaths due to recurrent PE), complicated outcomes were due to hemodynamic collapse in 28 patients and non-fatal recurrent PE in 1 patient (Table 2).
Clinical events during the first month of follow-up in 848 stable patients with acute symptomatic PE.
| Episodes, n (%) | PatientsN=848 |
|---|---|
| All-cause mortality | 38 (4.5%) |
| PE death | 11 (1.3%) |
| Recurrent PE | 3 (0.3%) |
| Major bleeding | 19 (2.2%) |
| Complicated outcomea | 63 (7.4%) |
| Hemodynamic collapseb | 28 (3.3%) |
| Recurrent non-fatal PE | 1 (0.1%) |
Abbreviations: PE, pulmonary embolism.
Defined as one or more of the following: catecholamine administration for sustained hypotension or shock; orotracheal intubation; cardiopulmonary resuscitation; rescue fibrinolysis, percutaneous thrombectomy, or surgical embolectomy.
Three patients presented hemodynamic collapse and died, and 1 patient presented recurrent non-fatal PE associated with hemodynamic collapse.
Fig. 1 shows the area under the ROC curve for a complicated 30-day outcome with each of the risk models. Discrimination using the sPESI and NEWS2 for a complicated 30-day outcome was 0.68 (95% CI, 0.63–0.74) and 0.62 (0.55–0.69), respectively (P=0.12) (Fig. 1). The discriminative capacity of the risk models for predicting all-cause mortality was 0.74 (95% CI, 0.67–0.80) and 0.59 (0.50–0.68), respectively. Fig. 1 shows the results of the Hosmer–Lemeshow goodness-of-fit test, which evaluates the calibration of the sPESI score and the NEWS2 score for predicting the risk of a complicated clinical outcome.

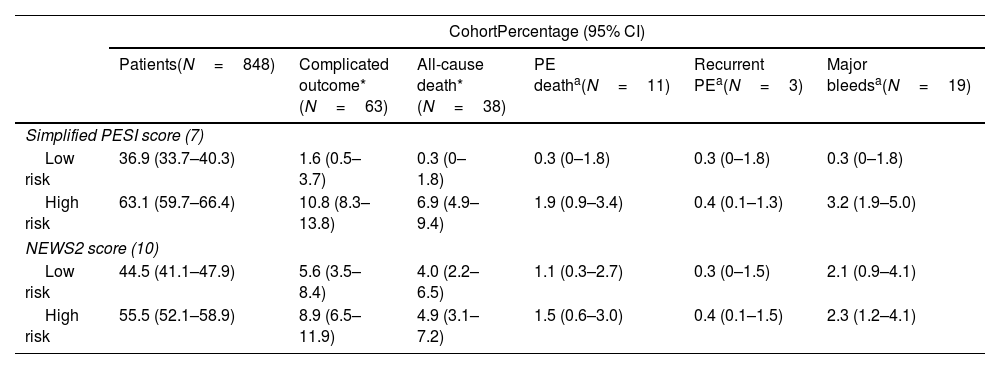
The sPESI score classified a significantly lower proportion of patients as low-risk (36.9% [313/848], 95% CI, 33.7–40.3%) compared with the NEWS2 model (44.5% [377/848], 95% CI, 41.1–47.9%) (P<0.01) (Table 3). Patients classified as low-risk according to the NEWS2 score had a greater probability of a complicated clinical outcome compared with those classified as low-risk according to the sPESI score (5.6% [21/377] vs 1.6% [5/313]) (P<0.01) (Table 3). The probability of a complicated clinical outcome in the group classified as high-risk according to the sPESI score did not differ significantly from that of the group of patients classified as high-risk according to the NEWS2 score (10.8% [58/535] vs 8.9% [42/471]), respectively (P=0.34) (Table 3). The proportion of all-cause deaths was significantly lower in the sPESI low-risk group compared with the low-risk NEWS2 group (1/313; 0.3% [95% CI, 0–1.8%] vs 15/377; 4.0% [95% CI, 2.2–6.5%]) (P<0.01). The distribution of the other secondary events by risk group is shown in Table 3.
Distribution of adverse events.
| CohortPercentage (95% CI) | ||||||
|---|---|---|---|---|---|---|
| Patients(N=848) | Complicated outcome*(N=63) | All-cause death*(N=38) | PE deatha(N=11) | Recurrent PEa(N=3) | Major bleedsa(N=19) | |
| Simplified PESI score (7) | ||||||
| Low risk | 36.9 (33.7–40.3) | 1.6 (0.5–3.7) | 0.3 (0–1.8) | 0.3 (0–1.8) | 0.3 (0–1.8) | 0.3 (0–1.8) |
| High risk | 63.1 (59.7–66.4) | 10.8 (8.3–13.8) | 6.9 (4.9–9.4) | 1.9 (0.9–3.4) | 0.4 (0.1–1.3) | 3.2 (1.9–5.0) |
| NEWS2 score (10) | ||||||
| Low risk | 44.5 (41.1–47.9) | 5.6 (3.5–8.4) | 4.0 (2.2–6.5) | 1.1 (0.3–2.7) | 0.3 (0–1.5) | 2.1 (0.9–4.1) |
| High risk | 55.5 (52.1–58.9) | 8.9 (6.5–11.9) | 4.9 (3.1–7.2) | 1.5 (0.6–3.0) | 0.4 (0.1–1.5) | 2.3 (1.2–4.1) |
Abbreviations: CI, confidence interval; NEWS, National Early Warning Score; PE, pulmonary embolism; PESI, Pulmonary Embolism Severity Index.
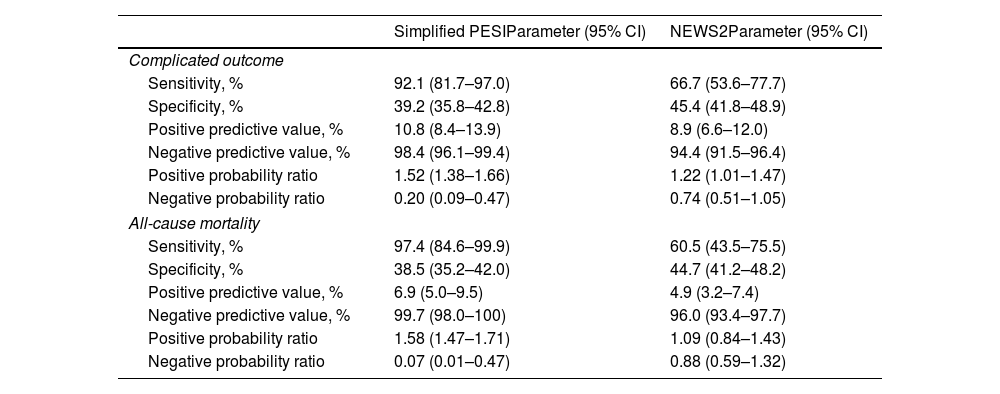
The sPESI score had greater sensitivity, negative predictive value, and negative likelihood ratio for the prediction of a complicated 30-day clinical outcome than the NEWS2 score (Table 4). When all-cause mortality at 30 days was examined, the negative predictive value for the sPESI score was 99.7%, compared with 96.0% for the NEWS2 score (Table 4).
Simplified PESI and NEWS2 quality indices for predicting 30-day adverse events.
| Simplified PESIParameter (95% CI) | NEWS2Parameter (95% CI) | |
|---|---|---|
| Complicated outcome | ||
| Sensitivity, % | 92.1 (81.7–97.0) | 66.7 (53.6–77.7) |
| Specificity, % | 39.2 (35.8–42.8) | 45.4 (41.8–48.9) |
| Positive predictive value, % | 10.8 (8.4–13.9) | 8.9 (6.6–12.0) |
| Negative predictive value, % | 98.4 (96.1–99.4) | 94.4 (91.5–96.4) |
| Positive probability ratio | 1.52 (1.38–1.66) | 1.22 (1.01–1.47) |
| Negative probability ratio | 0.20 (0.09–0.47) | 0.74 (0.51–1.05) |
| All-cause mortality | ||
| Sensitivity, % | 97.4 (84.6–99.9) | 60.5 (43.5–75.5) |
| Specificity, % | 38.5 (35.2–42.0) | 44.7 (41.2–48.2) |
| Positive predictive value, % | 6.9 (5.0–9.5) | 4.9 (3.2–7.4) |
| Negative predictive value, % | 99.7 (98.0–100) | 96.0 (93.4–97.7) |
| Positive probability ratio | 1.58 (1.47–1.71) | 1.09 (0.84–1.43) |
| Negative probability ratio | 0.07 (0.01–0.47) | 0.88 (0.59–1.32) |
Abbreviations: CI, confidence interval; NEWS, National Early Warning Score; PESI, Pulmonary Embolism Severity Index.
This study compares the ability of the sPESI score and the NEWS2 score to predict the risk of events following an episode of acute symptomatic PE. In our series, both scores showed similar discriminatory capacity for a complicated 30-day clinical outcome. However, the sPESI score was significantly more accurate in identifying patients with PE and a low risk of early complications.
Prognostic stratification is a fundamental tool in the management of patients with acute symptomatic PE, and several prognostic models have been developed and validated for this purpose.6,7,21,22 Some of these scales are particularly useful for identifying patients with PE and a low risk of complications who may benefit from short-term hospital stays or even home-based treatment of their disease.6,7 Other scales have been developed and validated for the identification of patients with intermediate or high risk of complications, who may benefit from close monitoring or even reperfusion therapy.21,22
Our results indicate that while the overall performance of both models is similar, the sPESI score is significantly better than the NEWS2 score in terms of high sensitivity. In fact, the negative predictive value and the negative probability ratio of the sPESI scale are significantly higher. When it comes to identifying patients for home treatment of PE, a very sensitive model is of interest because a false negative is very costly, and this is the advantage of the sPESI. The greater flexibility of the cut-off point in the NEWS2 score vs the sPESI score could explain the difference between the risk models.
When comparing predictive models, their simplicity in terms of clinical applicability should also be considered. In this respect, the comparison also favors the sPESI score, which uses a far simpler scoring system (the presence of any of the variables identifies a high-risk patient) than the NEWS2 model.
This study has several limitations. First, although the PROTECT researchers collected all the variables prospectively, this is a retrospective analysis of a multicenter study and is subject to the biases inherent to this type of study. Secondly, the choice of a complicated clinical outcome as the primary endpoint could be questioned. However, a complicated clinical outcome combines adverse events that contraindicate the outpatient treatment of patients with acute symptomatic PE. Finally, the main limitation of risk models is that they have been designed for group predictions rather than individual predictions. Even if their capacity for discrimination is high, they will never be perfect. For this reason, their use in a specific patient is only useful for guidance, since they can help anticipate a particular risk but cannot unequivocally predict the final clinical outcome.
In conclusion, our results show that the sPESI score is safer than the NEWS2 score for identifying patients with PE and a low risk of complicated clinical outcome. Well-designed studies are needed to evaluate whether NEWS2 can be used to identify patients at high risk for early PE complications (intermediate-to-high risk).
ContributionsConception and design: Rodríguez, Moisés, Jiménez.
Data acquisition, data analysis and interpretation, statistical analysis: Rodríguez, Durán, Retegui, Briceño, González, Castillo, Jara, Ponte, Moisés, Morillo, Jiménez.
Preparation of the manuscript: Rodríguez, Durán, Moisés, Jiménez.
Critical review of the manuscript: Rodríguez, Durán, Retegui, Briceño, González, Castillo, Jara, Ponte, Moisés, Morillo, Jiménez.
Study supervision: Jiménez.
The corresponding author, David Jiménez, has had full access to all study data and has the final responsibility for its submission for publication.
Conflict of interestThe authors have no conflicts of interest related to the content of this article.
This study has been partially funded by FIS 08/0200 and SEPAR 2008 grants.
The following are the supplementary data to this article:


