


The risk factors for having frequent exacerbations are not well documented in cohort studies of patients with asthma on existing therapy. The objective of the present study was to compare the clinical and inflammatory characteristics of patients with exacerbation-prone asthma (EPA) with a history of two or more exacerbations in the previous year with those who had presented just one or no exacerbation.
MethodsAn ambispective observational study was conducted in a tertiary hospital. Patients diagnosed with moderate or severe asthma and ongoing therapy, whose inflammatory profile was determined by means of allergy and atopy status, blood eosinophilia and induced sputum were included. Patients were classified according to the number of asthma exacerbations in EPA (≥2 exacerbations in the previous year) vs. non-exacerbators (≤1 exacerbation in the previous year). Clinical, lung function and inflammatory characteristics of the two groups were compared.
ResultsThree hundred ten patients were visited in the Asthma Unit in 2018 and the combination of atopy and allergy status, blood eosinophilia and induced sputum was obtained in 96 (31%) patients. Of this latter group, 46 patients (47%) presented EPA compared to 50 (53%) non-exacerbators. Airway and blood eosinophilic inflammation did not differ between EPA and non-exacerbators in patients with asthma and ongoing therapy, and it was not a risk factor for EPA in our cohort.
ConclusionAirway or blood type 2 inflammation status is not a valid tool for recognizing EPA or predicting asthma exacerbations in asthma patients following controller therapy.
Asthma is a chronic heterogenous airway disease characterized by excessive airway calibre fluctuation, which usually develops with local inflammation.1 Despite multiple classificatory phenotypes, recent guidelines have strengthened the utility of determining the inflammatory phenotype, especially in severe asthma, in order to establish the best therapeutic approach.1,2 The coexistence of asthma and comorbidities is also very frequent. In fact, the widespread treatable traits approach along with local and international consensus documents emphasize the need to identify coexisting comorbidities with the aim of treating them to achieve adequate asthma control.3
Interestingly, exacerbations are one the most relevant predictors of poor prognosis in asthma.4 Sex, age, race, lung function, smoking habit and exposure to respiratory viruses have been related to a higher prevalence of asthma exacerbations, although the causality is not clear.5–9 In this line, many authors have reported the predominance of the type 2 (T2) inflammatory phenotype in exacerbation-prone asthma (EPA)7,10,11 In fact, large population studies have reported blood eosinophils and exhaled nitric oxide levels (FeNO) as risk factors for the prevalence of exacerbation.12,13 However, the risk of having frequent exacerbations is less well documented in cohort studies of patients with severe asthma on existing therapy. Moreover, other aspects including frequent comorbidities, such as bronchiectasis, atopy status or an occupational origin of asthma could have an impact on the development of exacerbations, beyond the presence or absence of the T2 endotype.
Thus, the objective of the present study was to compare the clinical and inflammatory characteristics of patients with moderate or severe asthma with a history of two or more exacerbations in the previous year vs. those who present just one or no exacerbation.
MethodsStudy Population and DesignAn ambispective observational study was conducted. From January 1st to December 31st 2018 all patients with moderate or severe asthma followed in the Severe Asthma Unit of a tertiary hospital were identified. Patients older than 18 years, diagnosed with moderate or severe asthma according to steps 3, 4 and 5 of the Global Initiative for Asthma (GINA) criteria, and in whom the inflammatory profile could be determined by means of allergy and atopy status, blood eosinophilia and induced sputum (IE) cellular analysis, were included.1 The baseline characteristics, lung function values, and the blood and sputum inflammatory profile of the patients included were analyzed. The characteristics of patients presenting greater than or equal to two exacerbations in the previous year (defined as EPA) were compared with those presenting one or no exacerbation. While the number of exacerbations was collected retrospectively, complementary tests (immunoglobulin E (IgE), atopy status, blood eosinophils and induced sputum) to determine the inflammatory phenotype and high-resolution computed tomography (HRCT) were performed prospectively.
Diagnosis and Severity of AsthmaThe diagnosis of asthma was confirmed according to the GINA guideline at the time of diagnosis.1 Asthma was diagnosed in patients with symptoms such as episodic breathlessness, cough, chest tightness and wheezing, and with spirometry results showing bronchial reversibility of 12% and 200mL from the prebronchodilator value, or airway hyperresponsiveness as a 20% decrease in forced expiratory volume in 1s (FEV1) induced by a methacholine challenge test with a cumulative dose less than or equal to 8mg.14 Moderate and severe asthma were defined based on GINA guidelines, which corresponded to patients on treatment steps 4 and 5 receiving at least an equivalent of 200μg of budesonide plus a long-acting beta-2 agonist.1
Definition of ExacerbationsAn exacerbation was defined as a worsening of asthma symptoms that led to either hospitalization, an emergency department visit resulting in the use of systemic corticosteroids for three or more consecutive days or the need for systemic corticosteroids for three or more consecutive days.
Sputum Induction and ProcessingInduced sputum was obtained using an ultrasonic nebulizer (OMRON, Hoofddorp, Netherlands) with an output of 1mL/min at room temperature. All patients were instructed to blow their nose and rinse their mouth thoroughly to minimize saliva contamination. The test was completed by inhalation of a stepwise hypertonic solution (3%, 4% and 5%) for mouth breathing for 7min keeping the nosed clipped. A deep cough and expectoration were indicated after each exposure to facilitate the obtention of a sputum sample. In all cases, the induction procedures were only taken in cases in which the FEV1 was greater than 1.5L.
The sputum samples obtained were immediately processed using a previously standardized protocol.15,16 In summary, the selected expectorate sputum sample was first weighed and treated four times with a working solution containing 0.1% dithiothreitol (DTT) (Sigma-Aldrich) and then gently vortexed for 10min. A further four-fold volumes of PBS buffer were added to stop the effect of DTT on cell suspension. The sample solution was filtrated through a 40mm nylon gauze (Falcon). A small portion (12μL) was collected to determine cell viability in a Neubauer chamber using the trypan blue exclusion method. The rest of the sample was centrifuged at 1000×g 4°C for 10min to separate the supernatant from the cell pellet. The cell pellet was resuspended, and two slides were prepared by cytospin (Shandon) and were stained with May-Grunwald and Giemsa for differential cell counts by counting at least 400 non-squamous cells. The supernatant was aliquoted and stored at −80°C for later assay.17
Definition of Eosinophilic and Neutrophilic Airway InflammationThe type of inflammation was determined by sputum differential cell count. The neutrophilic inflammation was defined by the presence of ≥65% neutrophils and <3% eosinophils; the eosinophilic inflammation by ≥3% eosinophils and <65% neutrophils; the mixed phenotype by the presence of ≥3%, eosinophils and ≥65% neutrophils, and the paucigranulocytic inflammation was defined by both <3% eosinophils and <65% neutrophils.18
Definition of the Asthma PhenotypeT2 PhenotypesAllergic phenotype (T2/TH2) was defined by atopy (skin prick test (SPT) or specific immunoglobulin E (ImmunoCAP positive)) and allergic symptoms (rhinitis, conjunctivitis, dermatitis, etc.) related to the positive antigen, independently of eosinophil count in blood or sputum; non-allergic eosinophilic phenotype (T2/ILC2) was defined by ≥300 eosinophils in blood and/or ≥3% eosinophils in sputum and no atopy.18
Non-T2 PhenotypesNeutrophil phenotype (T2-low) was defined by <300 eosinophils in peripheral blood and ≥65% neutrophils and <3% eosinophils in induced sputum; paucigranulocytic phenotype (T2-low) was defined by <300 eosinophils in peripheral blood and <65% neutrophils and <3% eosinophils in induced sputum.18
Skin Prick TestsSPTs were performed following EAACI recommendations. Histamine hydrogen chloride 10mg/mL was used as positive control and physiologic saline as negative control.19 The panel included the most common aeroallergens in our area: Dermatophagoides pteronyssinus, Alernaria alternata, Parietaria judaica, Artemisia vulgaris, Salsola kali, Chenopodium album, Plantago lanceolata, Betula verrucosa, Corylus avellana, Platanus acerifolia, Cupressus arizonica, Olea europaea, Phleum pratense, Cynodon dactylon, …). Papules were measured at 15min, with a positive result defined as a wheal ≥3mm diameter.
Pulmonary Function TestsSpirometry was performed using a MasterLab device (MasterLab, Jaeger, Germany) following European Respiratory Society (ERS) and American Thoracic Society (ATS) guidelines.20 The reference values used were those proposed by the Global Lung Initiative.21
HRCT and Diagnosis of BronchiectasisHRCT was performed in all patients presenting moderate or severe asthma corresponding to stages 3, 4 and 5 of the GINA guidelines.
HRCT was performed with 1mm slices at 10mm intervals in maximum inspiration. All the HRCT images were analyzed by two pulmonologists working in the Severe Asthma Unit. When there was discrepancy of criteria, another HRCT radiologist was consulted to make the final decision.
The diagnosis of bronchiectasis was performed according to the Spanish Society of Pulmonology and Thoracic Surgery (SEPAR) guidelines by comparing the internal bronchial lumen diameter with the adjacent artery calibre in HRCT images.22
Morphological characteristics of BQ, including bronchodilation, bronchial wall thickening, dilatation type and lobe extension were reviewed and assessed according to the modified Reiff score in six lobes (18 points in total): 1–6 mild, 7–12 moderate, and ≥13 severe.23
Statistical AnalysisThe results are expressed as absolute numbers and their corresponding percentages for qualitative variables, as the mean and standard deviation for quantitative variables with a normal distribution and as the median and 25th to 75th percentiles for quantitative variables with a non-normal distribution.
The comparison of demographic and clinical variables of patients with two or more asthma exacerbations in the previous year and those presenting less than two asthma exacerbations was performed using the chi-square test for qualitative variables (or the Fisher exact test when one of the expected effects was less than 5), by means of an unpaired t-test for quantitative variables with normal distribution, a Mann–Whitney U-rank test for quantitative variables without normal distribution, as appropriate.
Finally, stepwise multivariate logistic regression modelling was performed to analyze the independent association between patient characteristics and asthma exacerbation (two or more), including as exposures all variables with a p-value <0.2 in the bivariable analysis. Results were reported using odds ratios (OR) and 95% confidence intervals (CI).
Data analysis was conducted using Stata 12.1 (StataCorp, College Station, TX, USA).
Ethics Approval and Consent to ParticipateThe study was approved by the Ethics Committee of the Hospital Vall d’Hebron (Reference number: PR (AG) 50/2019). All patients provided written informed consent prior to participating. All methods were performed in accordance with current guidelines and regulations.
ResultsThree hundred ten patients were visited in the Severe Asthma Unit in 2018. In 214 (69%) patients the sputum differential cell count was not obtained due to impossibility to perform SI in the context of FEV1 values <1.5L, or unsuccessful SI manoeuvre or patient refusal to undergo SI. In 96 (31%) patients the total IgE, atopy status, blood eosinophils and sputum differential cell count were obtained. There were no statistically significative differences in terms of basal characteristics between excluded patients and the 96 patients corresponding to the included population. In this latter group 46 patient (47%) presented EPA while 50 (53%) patients presented 1 or no exacerbations (Fig. 1).

There were no differences between patients with EPA vs. non-exacerbators regarding the prevalence of the T2 inflammatory phenotype (n=26 (56.5%) vs. n=30 (60%) respectively 19.6; p=0.730) (Fig. 2). Neither were there differences related to IgE, blood eosinophil counts or blood neutrophil counts. The prevalence of atopy was lower in the EPA group compared to non-exacerbators.

There were no differences in terms of FeNO or airway eosinophil count in SI in patients with EPA vs. non-exacerbators. No differences were found between the two groups in terms of the sputum neutrophil counts (Table 2 and Fig. 3).
, in blood (a and b) and in sputum (c and d). Abbreviation: EPA: exacerbation-prone asthma.")
There were no significant differences in age, sex, age at diagnosis, smoking habit, or body mass index between the two groups.
Bronchiectasis was more common in the EPA group, although there were no differences in the Reef grade between groups.
EPA patients had lower asthma control test (ACT) values and were more frequently treated with long-acting muscarinic antagonists (LAMA), azithromycin, nebulized colistin, and oral corticosteroids compared to patients presenting one or no moderate or severe exacerbation (Table 1).
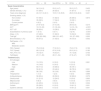
Basal Characteristics of the Study Population.
| Alln=96 | Non-EPAn=50 | EPAn=46 | p | |
|---|---|---|---|---|
| Basal characteristics | ||||
| Age (years) | 54.3 (14.2) | 53.2 (14.7) | 55.5 (13.7) | 0.432 |
| Gender (female), n (%) | 57 (59.4) | 26 (52.0) | 31 (67.4) | 0.125 |
| Years since diagnosis | 24.3 (11.9–40.1) | 19.5 (11.9–39.9) | 28.8 (10.6–40.4) | 0.431 |
| Smoking status, n (%) | ||||
| Non-smoker | 57 (59.3) | 31 (62.0) | 26 (56.5) | 0.874 |
| Ex-smoker | 35 (36.5) | 17 (34.0) | 18 (39.1) | |
| Current smoker | 4 (4.2) | 2 (4.0) | 2 (4.0) | |
| BMI (kg/m2) | 27.97 (4.6) | 27.4 (3.9) | 28.6 (5.3) | 0.215 |
| ACT | 19 (13–23) | 21 (18–24) | 14 (10–19) | <0.001 |
| ACT <20 | 58 (60.4) | 19 (38.0) | 39 (84.8) | <0.001 |
| Exacerbations in previous year | 1 (0–3) | 0 (0–1) | 3 (2–6) | <0.001 |
| Atopy, n (%) | 47 (48.9) | 31 (62.0) | 16 (34.8) | 0.008 |
| Total IgE | 222 (92–595) | 289 (131–607) | 161 (57–555) | 0.200 |
| Bronchiectasis, n (%) | 55 (57.3) | 21 (42.0) | 34 (73.9) | 0.002 |
| Reiff grade, n (%) | ||||
| Mild | ||||
| Moderate–severe | ||||
| FEV1(%pred) | 75.8 (16.8) | 77.8 (16.1) | 73.6 (17.5) | 0.199 |
| FVC (%pred) | 85.5 (15.9) | 87.6 (15.6) | 83.3 (16.1) | 0.180 |
| FEV1/FVC (%) | 70.5 (8.7) | 70.8 (8.7) | 70.1 (8.8) | 0.753 |
| FeNO(ppb) | 27 (11–50) | 28 (11–54) | 27 (9–47) | 0.769 |
| Treatment,n(%) | ||||
| ICS (dosage) | ||||
| Low | 13 (13.5) | 8 (16.0) | 5 (10.9) | 0.661 |
| Medium | 14 (14.6) | 8 (16.0) | 6 (13.0) | |
| High | 69 (71.9) | 34 (68.0) | 35 (76.1) | |
| LAMA | 59 (61.5) | 23 (46.0) | 36 (78.3) | 0.001 |
| LABA | 96 (100) | 50 (100) | 46 (100) | 0.999 |
| Theophylline | 1 (1.0) | 1 (2.0) | 0 (0.0) | 0.999 |
| Antileukotrienes | 58 (60.4) | 26 (52.0) | 32 (69.6) | 0.079 |
| Omalizumab | 21 (21.9) | 12 (24.0) | 9 (19.6) | 0.600 |
| Mepolizumab | 8 (8.3) | 3 (6.0) | 5 (10.9) | 0.474 |
| Azithromycin | 24 (25.0) | 6 (12.0) | 18 (39.1) | 0.004 |
| Colistin | 25 (26.0) | 6 (12.0) | 19 (41.3) | 0.001 |
| Systemic steroids | 25 (26.0) | 6 (12.0) | 19 (41.3) | 0.001 |
Data are presented as n (%), median (p25–p75) or mean (SD).
Abbreviations: BMI: body mass index; ACT: asthma control test; IgE: immunoglobulin E; FEV1: forced expiratory volume in 1s; FVC: forced vital capacity; FeNO: exhaled fraction of nitric oxide; ICS: inhaled corticosteroids; LABA: long-acting beta-adrenergic agonists; LAMA: long-acting muscarinic antagonists.
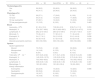
Inflammatory Characteristics of the Study Population.
| Alln=96 | Non-EPAn=50 | EPAn=46 | p | |
|---|---|---|---|---|
| T2 phenotype,n(%) | ||||
| Yes | 56 (58.3) | 30 (60.0) | 26 (56.5) | 0.730 |
| No | 40 (41.7) | 20 (40.0) | 20 (43.5) | |
| Phenotype,n(%) | ||||
| T2-Th2 | 26 (27.1) | 17 (34.0) | 9 (19.6) | 0.112 |
| T2-ILC2 | 30 (31.3) | 13 (26.0) | 17 (36.9) | 0.247 |
| T2-low neutrophilic | 27 (28.1) | 12 (24.0) | 15 (32.6) | 0.349 |
| T2-low paucigranulocytic | 13 (13.5) | 8 (16.0) | 5 (10.9) | 0.463 |
| Blood | ||||
| Leucocyte, ×109/L | 8.1 (6.9–10.0) | 7.69 (6.6–9.3) | 8.59 (7.4–11.3) | 0.053 |
| Neutrophil, % | 57.4 (50.7–66.8) | 56.10 (49.8–66.3) | 57.85 (51.6–67.5) | 0.518 |
| Lymphocyte, % | 28.2 (21.8–35.3) | 28.9 (21.8–36.4) | 27.5 (21.7–33.7) | 0.371 |
| Monocyte, % | 7.5 (6.4–9.1) | 7.7 (6.5–9.1) | 7.1 (6.4–8.9) | 0.657 |
| Eosinophil, % | 3.4 (1.7–6.1) | 3.6 (1.9–5.8) | 2.9 (1.4–6.4) | 0.638 |
| Basophil, % | 0.6 (0.5–0.9) | 0.7 (0.5–0.9) | 0.6 (0.5–0.9) | 0.523 |
| Absolute eosinophils (cell/mcL) | 300 (100–500) | 300 (100–400) | 300 (100–600) | 0.996 |
| Sputum | ||||
| Sputum appearance | ||||
| Mucoid | 73 (76.0) | 41 (82) | 32 (69.6) | 0.328 |
| Mucopurulent | 14 (14.6) | 6 (12.0) | 8 (17.4) | |
| Purulent | 9 (9.4) | 3 (6.0) | 6 (13.0) | |
| Total cells, 108mL−1 | 0.67 (0.20–2.92) | 0.71 (0.21–2.90) | 0.63 (0.19–3.20) | 0.889 |
| Eosinophil, % | 1.45 (0.25–12.75) | 1.25 (0.20–5.30) | 2.70 (0.40–18.0) | 0.302 |
| Neutrophil, % | 70.0 (46.6–83.8) | 70.0 (47.3–85.2) | 70.0 (45.2–83.8) | 0.773 |
| Lymphocyte, % | 0.80 (0.30–1.40) | 0.80 (0.30–1.30) | 0.70 (0.20–1.60) | 0.491 |
| Macrophage, % | 18.3 (8.3–29.6) | 18.3 (8.0–32.4) | 18 (8.6–28.2) | 0.857 |
| Airway inflammation | ||||
| Eosinophilic | 23 (23.9) | 10 (20.0) | 13 (28.3) | 0.688 |
| Neutrophilic | 38 (39.6) | 22 (44.0) | 16 (34.8) | |
| Paucigranulocytic | 16 (16.7) | 9 (18.0) | 7 (15.2) | |
| Mixed | 19 (19.8) | 9 (18.0) | 10 (21.7) | |
Data are presented as n (%), median (p25–p75) or mean (SD).
Abbreviations: T2: type 2; Th2: T helper 2; ILC2: innate lymphoid cells 2.
The multivariate logistic regression model revealed that ACT values less than 20 and the use of systemic steroids were independently associated with EPA (Table 3).
Multivariate Logistic Regression Analysis With Asthma Exacerbation (≥2 in the Previous Year) as a Dependent Outcome Variable.
| OR(95% CI) | p-Value | |
|---|---|---|
| ACT <20 | 8.55 (3.05–23.97) | <0.001 |
| Systemic corticosteroids | 4.65 (1.46–14.84) | 0.009 |
Abbreviations: ACT: asthma control test; OR: odds ratio; CI: confidence interval.
The present study describes the clinical, inflammatory, lung function and the presence of bronchiectasis in the HRCT of moderate and severe asthma patients in a well-phenotyped ambispective cohort. This study revealed that airway eosinophilic inflammation did not differ between EPA and non-exacerbators in patients with moderate or severe asthma and ongoing therapy, and that it was not a risk factor or a predictor for EPA in our cohort. Neither was the blood eosinophil count a risk factor for presenting asthma exacerbations. Our study also shows that an ACT score less than 20 and treatment with systemic steroids were independent predictors of EPA.
Some authors have linked the presence of sputum eosinophilia and elevated FeNO with the risk of asthma exacerbations.7 In this line, Domínguez-Ortega et al.24 reported eosinophilia and a high-T2 inflammatory pattern being significantly associated with AE in the severe asthma Spanish MEGA cohort, encompassing 486 patients. Parallel, Peters et al.25 described a 406 adult severe asthma cohort with a 3-year follow-up, where 21% presented at least one exacerbation each year. In this cohort, the risk of AE was related to increasing values of eosinophils. However, several large cohorts of patients with severe asthma have not been able to confirm these findings.11 This discrepancy between studies probably reflects the impact of the heterogeneity of asthma, the burden of comorbidities and the bias of patients being or not under controller therapy. In this sense, the response of inflammatory biomarkers to ongoing treatment could differ depending on the nature of each specific treatment. Bateman et al.26 performed an analysis of three clinical trials including more than 7000 patients with asthma, receiving treatment with long-acting beta-adrenergic agonists (LABA), inhaled corticosteroids (ICS) and LAMA and unlike the inflammatory phenotype, only disease severity, symptom control and history of smoking were predictors of exacerbations. Along this line, Denlinger et al.11 were not able to relate the presence of sputum eosinophils or FeNO with the risk of exacerbations in the 709 patient Severe Asthma Research Program-3 (SARP-3) cohort. Again, these patients were already being treated with controller therapy and not surprisingly, in the SARP-3 cohort, the EPA group had the highest medication burden similar to what was found in the present study.
Our study found no differences in blood eosinophil counts between EPA and patients with asthma and one or no exacerbation. Similar to what occurs with the sputum eosinophil count, many authors have related a higher blood eosinophil count has been related to EPA.12,13,27 These finding are coherent with blood eosinophils being an acceptable predictor of airway eosinophils.28 However, EPA patients probably have other features that are independent of T2 inflammation biomarkers. In this line, our study likely reflects aspects such as current ongoing treatment or the presence of comorbidities such as bronchiectasis or atopy.
Sixty-one (64%) patients in our cohort presented bronchiectasis in the HRCT, most being mild (Reiff score 1–6). Bronchiectasis is a relatively common comorbidity in asthma patients, having a much higher prevalence in the severe forms of the disease.29 It is likely that the existence of uncontrolled bronchial inflammation produces an increase in mucus production and local mucosa damage leading to structural alterations.30–32 Despite the frequent coexistence of bronchiectasis and asthma, there are still many gaps in the knowledge related to the interaction with asthma in terms of aetiology, clinical features, management and even exacerbations. Although bronchiectasis is a usual phenomenon leading to frequent exacerbations in these patients, little is known about the impact of the inflammatory phenotype on asthma exacerbations in patients with asthma-bronchiectasis overlap. In this context, the presence of bronchiectasis could have a direct impact on the inflammatory phenotype of these patients, distorting the classical belief of eosinophils in sputum induction being a predictor of exacerbations. In fact, García-Clemente et al.33 recently described lower levels of FeNO in patients with severe asthma and bronchiectasis compared to those with severe asthma and a normal HRCT. Parallelly, Mao et al.34 recently reported that age and FEV1, and not the T2 inflammatory phenotype, were factors associated with exacerbations in patients with asthma and bronchiectasis, and that the presence Pseudomonas aeruginosa was an independent factor associated with exacerbations in this population.
Atopy status is another factor that should be taken into account to interpret the results. In our study, the prevalence of atopy was lower in the EPA group compared to non-exacerbators. In this line, in the SARP-3 cohort an inverse relationship between exacerbations and IgE levels or degree of allergen sensitization was described.11 These findings may be related to a better response to ICS in patients presenting this phenotype, although other authors have described a lack of association between IgE or atopy status and asthma control.35 Again, the underlaying reality is probably much more complex since it is necessary to consider the interaction of atopy and allergy with other factors such as viruses, considered to be the trigger of more than the 50% of asthma exacerbations, or pollutants.36
Our study also showed that an ACT value less than 20 and systemic corticosteroid use were related to EPA. These results are in line with previous studies reporting similar results.7 In this context, it seems that the need for intensive anti-inflammatory therapy is related to prior exacerbations, worse asthma control and a higher risk of future exacerbations, since these are all characteristics linked to more severe asthma.26
This study has several potential limitations. First, the triggers of the exacerbations were retrospectively and not systematically collected, which could have contributed to misinterpreting the inflammatory status of the patients included. Second, sputum induction was obtained in only 30% of the patients of our cohort, which may bias the characteristics of the patients included towards those with higher mucus hypersecretion and more severe disease. Moreover, bronchiectasis was present in 60% of the patients studied, which seems to be a slightly higher percentage than that observed by previous authors, with the potential displacement of the inflammatory biomarkers in one particular direction. Third, although sputum samples were collected, cytokines such as interleukin 4, 5 and 13 or proteins such as interferons were not measured, which might also have been of use to understand the underlying mechanisms. Fourth, the presence of ongoing treatment could be interpreted as a limitation. However, we believe that this is a reliable reflection of the patients that professionals observe in daily clinical practice, being an assessment that needs to be taken.
In conclusion, our study reveals that airway or blood eosinophilic T2 inflammation status is not a valid tool to recognize EPA or predict asthma exacerbations in moderate or severe patients following controller therapy. While high levels of T2 inflammatory biomarkers may be related to a higher risk of exacerbation, patients with EPA receiving ongoing treatment may not present high levels of T2 inflammation at the time of assessment. Future studies aimed at determining the molecular pathobiology of EPA are needed to further understand the discrepancies existing between asthma phenotypes and their prognostic implications.
Authors’ ContributionsMFP, MJC, DM, CRM, DE, AO, MAR, XM and IO contributed substantially to the study design, data analysis and interpretation, and the writing of the manuscript.
Conflict of InterestMFP, MJC, DM, CRM, DE, AO and MAR do not have conflicts of interest related to this paper.
IO declares to have received honoraria in the last three years for participating as a speaker in meetings sponsored by Astrazeneca, Boehringuer-Ingelheim, Chiesi, and Novartis and as a consultant for Astrazeneca, GlaxoSmithKlein, Puretech and Sanofi. He has received financial aid from Astrazeneca, Bial and Chiesi for congress attendance and has received grants from Sanofi for research projects.
XM reports a relationship with Sanofi that includes: funding grants, speaking and lecture fees, and travel reimbursement. Xavier Munoz reports a relationship with GlaxoSmithKline that includes: funding grants, speaking and lecture fees, and travel reimbursement. Xavier Munoz reports a relationship with Novartis Pharmaceuticals Corporation that includes: funding grants, speaking and lecture fees, and travel reimbursement. Xavier Munoz reports a relationship with Boehringer Ingelheim Pharmaceuticals Inc that includes: speaking and lecture fees. Xavier Munoz reports a relationship with Laboratorios Gebro Pharma SA that includes: speaking and lecture fees. Xavier Munoz reports a relationship with Menarini Laboratories that includes: travel reimbursement. Xavier Munoz reports a relationship with Faes Farma that includes: travel reimbursement. Xavier Munoz reports a relationship with Chiesi Pharmaceuticals Inc that includes: speaking and lecture fees.
This study was supported by the Instituto de Salud Carlos III (AES-2021)PI21/01100, the Fundació Catalana de Pneumologia (FUCAP), Societat Catalana de Pneumologia (SOCAP) and Fondo Europeo de Desarrollo Regional (FEDER). The funders had no role in the study design, data collection and analysis, decision to publish, or preparation of the manuscript.
The following are the supplementary data to this article:


