


CURRENT SITUATION AND LONG-TERM CONSEQUENCES OF COVID-19 INFECTION
More infoTo analyze the causes of death by diseases of the respiratory system in Spain in 2020, with special interest in COVID-19; also its trends and determinants, and compare them with 2019.
Material and methodsRetrospective cohort study. The coding of all those causes of death by diseases of the respiratory system were regrouped. A descriptive analysis of all deaths and by gender, age, and the 17 Autonomous Communities (CC.AA.) was performed. Also, odds ratios of death in crude and multivariate analysis by logistic regression were estimated.
ResultsIn Spain in 2020, 60,358 deaths were attributed to “COVID-19 virus identified” and another 14,481 to “COVID-19 virus not identified (suspicious)”. Regrouping the specific causes of death, in 2020 the diseases of the respiratory system caused a total of 139,880 deaths, which corresponds to 28.3% of all deaths in Spain. Compared to 2019, an increase of 68.5% was observed. By gender, deaths by diseases of the respiratory system were higher in men (32.0%) than in women (24.6%), although in specific causes the percentage was higher in women with suspected COVID-19, asthma, respiratory insufficiency and other diseases of the respiratory system. Finally, the variables associated with death from COVID-19 in the multivariate analysis were being male, increasing age (maximum at 80 years), completed studies up to secondary level, employed, and single or widowed marital status, although with a marked variation by CC.AA.
ConclusionsIn Spain in 2020, COVID-19 produced a large increase (68.5%) in deaths by diseases of the respiratory system compared to the previous year.
Analizar las causas de muerte por enfermedades del aparato respiratorio en España durante el año 2020, con especial interés en COVID-19; también sus tendencias y determinantes, y compararlas con el año 2019.
Material y métodosEstudio de cohortes retrospectivo. Se reagrupó la codificación de todas aquellas causas de muerte por enfermedades del aparato respiratorio. Se realizó un análisis descriptivo de todas las defunciones por sexo, edad en las 17 Comunidades Autónomas (CC. AA.). Además, se estimaron las odds ratios de muerte en análisis crudo y multivariado por regresión logística.
ResultadosEn España en el año 2020 se atribuyeron 60.358 muertes a «COVID-19 virus identificado» y otras 14.481 a «COVID-19 virus no identificado (sospechoso)». Reagrupando las causas específicas de muerte, en el año 2020 las enfermedades del aparato respiratorio provocaron un total de 139.880 muertes, lo que corresponde al 28,3% de todas las muertes en España. En comparación con el año 2019, se observó un aumento del 68,5%. Por género, las defunciones por enfermedades del aparato respiratorio fueron mayores en los varones (32,0%) que en las mujeres (24,6%), aunque en causas específicas el porcentaje fue mayor en mujeres en COVID-19 sospechosa, asma, insuficiencia respiratoria y otras enfermedades del aparato respiratorio. Finalmente, las variables asociadas a la muerte por COVID-19 en el análisis multivariante fueron el género masculino, el aumento de la edad (máximo a los 80 años), estudios completados hasta secundaria y el estado civil soltero o viudo, aunque con una marcada variación por CC. AA.
ConclusionesEn España en el año 2020 la COVID-19 produjo un gran incremento (68,5%) de muertes por enfermedades del aparato respiratorio en comparación con el año anterior.
Respiratory diseases are responsible for a large population burden of disease, morbidity and mortality, both in Spain and in the world. According to the Global Burden of Diseases, Injuries, and Risk Factors Study (GBD), of the 50.5 million deaths that occurred in 1990 in the world, 4.3 million were attributed to pneumonia, 2.2 million to tuberculosis, 2.0 million to chronic obstructive pulmonary disease (COPD) and 0.95 million to lung cancer. In addition, it was estimated that for 2020, of the 68.3 million predictable deaths, 11.9 million were from respiratory causes, estimating that they became the third cause of death in 2020.1 In Spain, with a relatively aged population and yet with alarming rates of smoking,2 respiratory diseases also have a huge impact on individual and population health.3,4 Its magnitude and diversity mean that the clinical management of respiratory health, beyond Pulmonology, also requires a large part of the daily dedication of health professionals in Primary Care, Internal Medicine and other specialties.5,6
However, it is well known that respiratory mortality statistics from death certificates are underreported compared to cancer, cardiovascular and metabolic diseases. This bias occurs for various reasons.7,8 Among other, it is a clinical challenge to attribute a death to a respiratory cause, since the symptoms and determinants are non-specific and overlap with those of cardiovascular or other diseases, and many patients with chronic respiratory diseases die with them and not from them.9,10 Current standardized coding manuals for death certificates from the World Health Organization (WHO), as well as from the European Union and its EUROSTAT, or from the National Institute of Statistics (INE) are homogeneous. The INE is governed by the rules established by the WHO as established by Regulation (EU) No. 328/2011 of the Commission of April 5, 2011, which applies Regulation (EC) No. 1338/2008 of the European Parliament and of the Council on Community statistics on public health and on health and safety at work. Regarding statistics on the causes of death, only those from Group X (with ICD10 062-067) are considered as causes of death of the Respiratory System, namely: Influenza; Pneumonia; Chronic diseases of the lower respiratory tract (except asthma); Asthma; Respiratory insufficiency; and Other diseases of the respiratory system.11 However, other diseases that also directly affect the respiratory system such as tuberculosis, or daily practice in the field of Pulmonology and Thoracic Surgery such as malignant tumours of the trachea, bronchi and lung, are considered for statistical purposes as deaths of infectious and oncological causes, respectively, to give just two examples.
The objective of this research is to analyze the causes of death associated with respiratory causes in Spain in the years 2019 and 2020, that is, including those in the field of Pneumology such as COVID-19 itself, but not included in the current convention to produce the statistics. Secondly, we analyze its variations and determinants by gender, age and CC.AA.
MethodsMortality data were obtained from the INE website,12 and its microdata. The so-called Short List of 101 causes of death ICD-10, and its correspondence with ICD-9, was reviewed and regrouped, adding other diseases of the respiratory system such as tuberculosis and malignant tumours of the trachea, bronchi and lung. The causes “COVID-19 Virus identified” and “COVID-19 Virus not identified (suspected)” were also included (Table 1). A descriptive analysis of the absolute frequencies of deaths and proportional mortality by gender, age, and CC.AA. was performed. The percentages of change in proportional mortality between pre-pandemic (2019) and post-pandemic (2020) years were calculated. A crude and multivariable logistic regression analysis was performed with the microdata to obtain the odds ratios (ORs) and their 95% CI, as estimators of the independent variables associated with mortality. In any comparison, a value of p<0.05 was considered statistically significant.
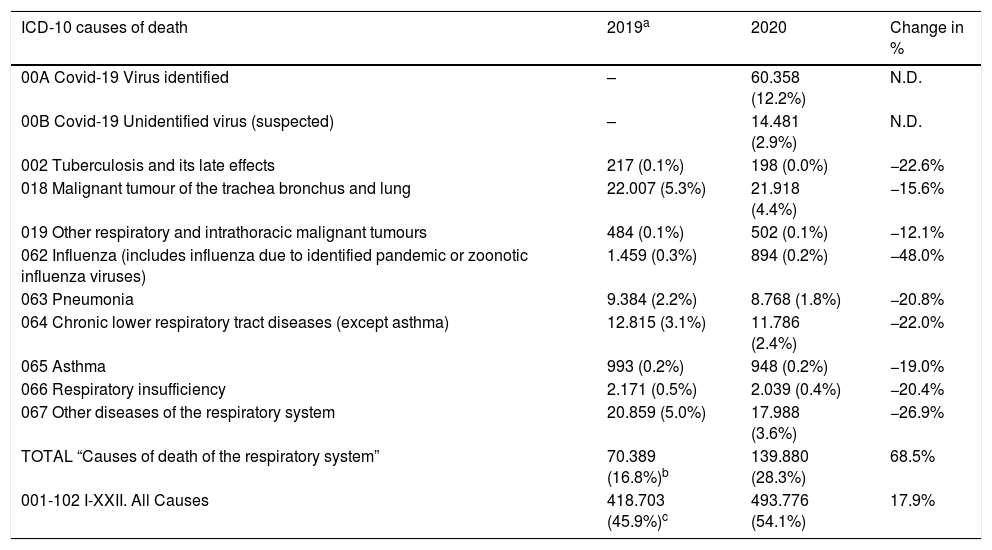
Number of deaths, proportional mortality (%) and percent change by diseases of the respiratory system in Spain in 2019 and 2020.
| ICD-10 causes of death | 2019a | 2020 | Change in % |
|---|---|---|---|
| 00A Covid-19 Virus identified | – | 60.358 (12.2%) | N.D. |
| 00B Covid-19 Unidentified virus (suspected) | – | 14.481 (2.9%) | N.D. |
| 002 Tuberculosis and its late effects | 217 (0.1%) | 198 (0.0%) | −22.6% |
| 018 Malignant tumour of the trachea bronchus and lung | 22.007 (5.3%) | 21.918 (4.4%) | −15.6% |
| 019 Other respiratory and intrathoracic malignant tumours | 484 (0.1%) | 502 (0.1%) | −12.1% |
| 062 Influenza (includes influenza due to identified pandemic or zoonotic influenza viruses) | 1.459 (0.3%) | 894 (0.2%) | −48.0% |
| 063 Pneumonia | 9.384 (2.2%) | 8.768 (1.8%) | −20.8% |
| 064 Chronic lower respiratory tract diseases (except asthma) | 12.815 (3.1%) | 11.786 (2.4%) | −22.0% |
| 065 Asthma | 993 (0.2%) | 948 (0.2%) | −19.0% |
| 066 Respiratory insufficiency | 2.171 (0.5%) | 2.039 (0.4%) | −20.4% |
| 067 Other diseases of the respiratory system | 20.859 (5.0%) | 17.988 (3.6%) | −26.9% |
| TOTAL “Causes of death of the respiratory system” | 70.389 (16.8%)b | 139.880 (28.3%) | 68.5% |
| 001-102 I-XXII. All Causes | 418.703 (45.9%)c | 493.776 (54.1%) | 17.9% |
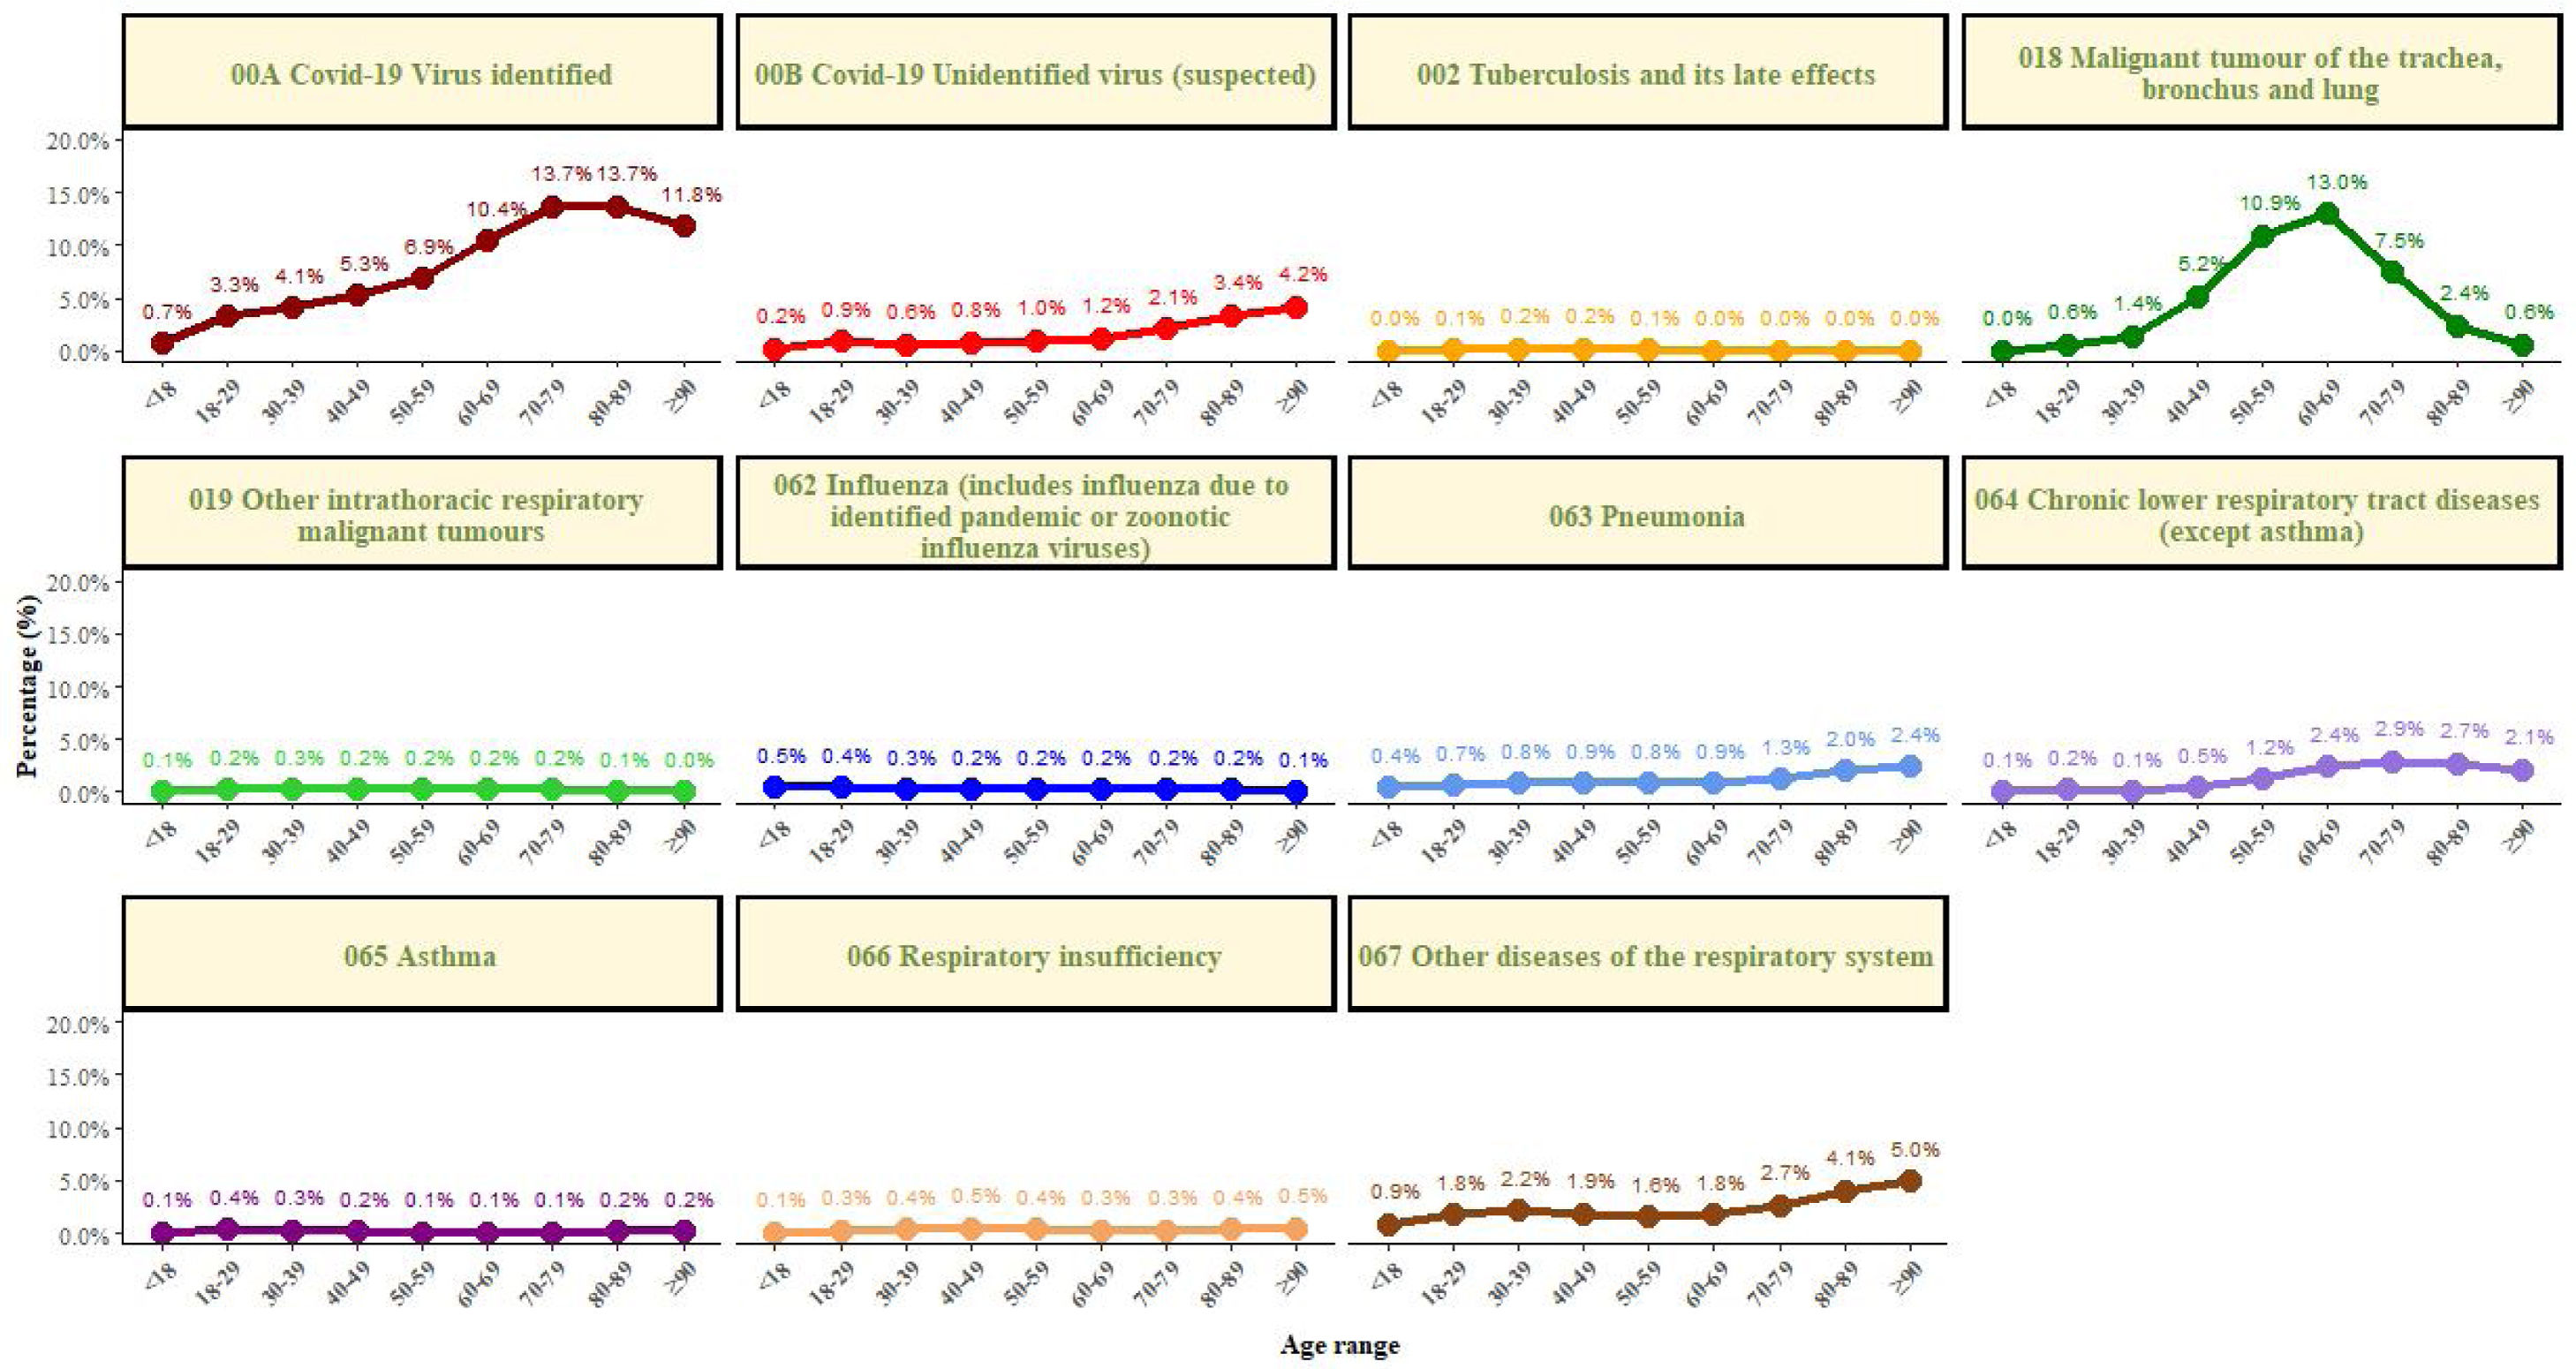
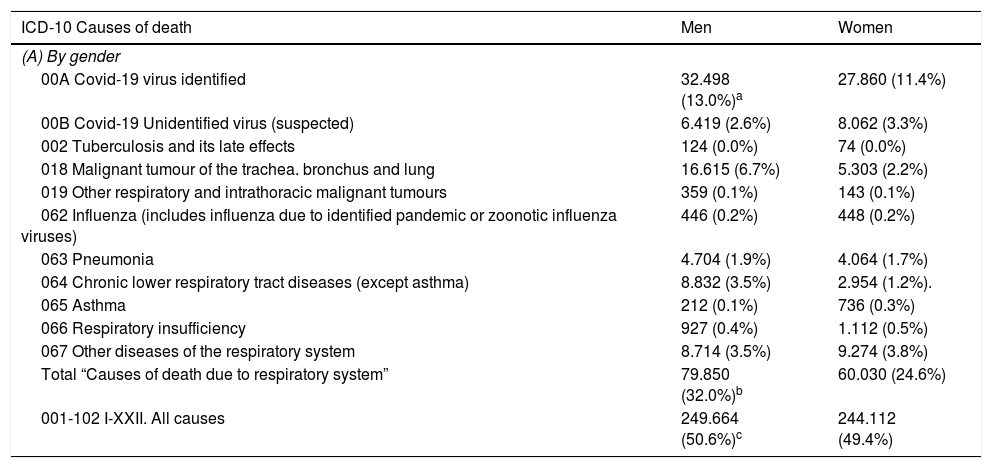
Of the 493,776 deaths that occurred in Spain in 2020, 60,358 deaths were attributed to “COVID-19 Virus identified” and another 14,481 to “COVID-19 virus not identified (suspicious)”. Regrouping specific causes of death, in 2020 diseases of the respiratory system caused 139,880 deaths, which corresponds to a proportional mortality of 28.3% in 2020 in Spain (Table 1). Compared to 2019, an increase of 68.5% was observed, and a relative decrease in specific causes, with a maximum decrease of −48.0% due to flu/influenza. By gender, it stands out that in 2020 deaths from diseases of the respiratory system were higher in men (32.0%) than in women (24.6%), although in specific causes proportional mortality was substantially higher in women due to COVID-19 not identified (suspicious), asthma, respiratory insufficiency and Other diseases of the respiratory system (Table 2). As expected, the highest mortality associated with respiratory diseases occurred in those over 50 years of age, with a peak of 31.1% in the 70–79 years age range (Fig. 1).
Number of deaths and percentage of mortality by diseases of the respiratory system in 2020 in Spain by gender (panel A); autonomous community (panel B); and age (panel C).
| ICD-10 Causes of death | Men | Women |
|---|---|---|
| (A) By gender | ||
| 00A Covid-19 virus identified | 32.498 (13.0%)a | 27.860 (11.4%) |
| 00B Covid-19 Unidentified virus (suspected) | 6.419 (2.6%) | 8.062 (3.3%) |
| 002 Tuberculosis and its late effects | 124 (0.0%) | 74 (0.0%) |
| 018 Malignant tumour of the trachea. bronchus and lung | 16.615 (6.7%) | 5.303 (2.2%) |
| 019 Other respiratory and intrathoracic malignant tumours | 359 (0.1%) | 143 (0.1%) |
| 062 Influenza (includes influenza due to identified pandemic or zoonotic influenza viruses) | 446 (0.2%) | 448 (0.2%) |
| 063 Pneumonia | 4.704 (1.9%) | 4.064 (1.7%) |
| 064 Chronic lower respiratory tract diseases (except asthma) | 8.832 (3.5%) | 2.954 (1.2%). |
| 065 Asthma | 212 (0.1%) | 736 (0.3%) |
| 066 Respiratory insufficiency | 927 (0.4%) | 1.112 (0.5%) |
| 067 Other diseases of the respiratory system | 8.714 (3.5%) | 9.274 (3.8%) |
| Total “Causes of death due to respiratory system” | 79.850 (32.0%)b | 60.030 (24.6%) |
| 001-102 I-XXII. All causes | 249.664 (50.6%)c | 244.112 (49.4%) |
| ICD-10 Causes of death | Andalucía | Aragón | Canarias | Cantabria | Castilla – La Mancha | Castilla y León | Cataluña | Ceuta | Madrid | Navarra | Valencia | Extremadura | Galicia | Islas Baleares | La Rioja | Melilla | País Vasco | Asturias | Murcia | España |
|---|---|---|---|---|---|---|---|---|---|---|---|---|---|---|---|---|---|---|---|---|
| (B) By Autonomous community. | ||||||||||||||||||||
| 00A Covid-19 Virus identified | 5821(7.4%)*e | 2653(15.9%)* | 403(2.4%)* | 427(6.5%)* | 4817(18.4%)* | 5823(15.9%)* | 12,871(16.1%)* | 59(9.3%) | 14.540(22.0%)* | 1004(14.9%)* | 3161(6.5%)* | 1099(8.5%)* | 1499(4.6%)* | 557(6.5%)* | 577(15.5%)* | 43(7.7%)* | 2.753(11.5%)* | 1513(10.4%)* | 738(6.0%)* | 60,358(12.2%) |
| 00B Covid-19 Unidentified virus (suspected) | 696(0.9%)* | 289(1.7%)* | 98(0.6%)* | 68(1.0%)* | 1683(6.4%)* | 1889(5.2%)* | 3013(3.8%)* | 4(0.6%)* | 4.817(7.3%)* | 179(2.7%) | 651(1.3%)* | 290(2.2%)* | 83(0.3%)* | 43(0.5%)* | 71(1.9%)* | 4(0.7%)* | 311(1.3%)* | 260(1.8%)* | 32(0.3%)* | 14,481(2.9%) |
| 002 Tuberculosis and its late effects | 37(0.0%)d | 5(0.0%) | 10(0.1%) | 5(0.1%) | 3(0.0%) | 13(0.0%) | 31(0.0%) | 4(0.6%)* | 11(0.0%)* | 2(0.0%) | 24(0.1%) | 2(0.0%) | 21(0.1%) | 2(0.0%) | 4(0.1%) | 1(0.2%) | 14(0.1%) | 7(0.0%) | 2(0.0%) | 198(0.0%) |
| 018 Malignant tumour of the trachea, bronchus and lung | 3539 (4.5%) | 704(4.2%) | 963 (5.8%)* | 346(5.3%)* | 851(3.2%)* | 1354(3.7%)* | 3370(4.2%)* | 31(4.9%) | 2.509(3.8%)* | 326(4.8%) | 2.561(5.2%)* | 582(4.5%) | 1546(4.7%) | 491(5.7%)* | 143(3.8%) | 18(3.2%) | 1193(5.0%)* | 735(5.0%)* | 656(5.3%)* | 21,918(4.4%) |
| 019 Other respiratory and intrathoracic malignant tumours | 64(0.1%) | 13(0.1%) | 14(0.1%) | 13(0.2%) | 18(0.1%) | 45(0.1%) | 80(0.1%) | 1(0.2%) | 72(0.1%) | 13(0.2%) | 46(0.1%) | 8(0.1%) | 41(0.1%) | 8(0.1%) | 3(0.1%) | 0(0.0%) | 40(0.2%)* | 11(0.1%) | 12(0.1%) | 502(0.1%) |
| 062 Influenza (includes influenza due to identified pandemic or zoonotic influenza viruses) | 172(0.2%) | 48(0.3%)* | 55(0.3%)* | 18(0.3%) | 41(0.2%) | 44(0.1%)* | 137(0.2%) | 5(0.8%)* | 67(0.1%)* | 18(0.3%) | 59(0.1%)* | 11(0.1%) | 62(0.2%) | 10(0.1%) | 9(0.2%) | 1(0.2%) | 55(0.2%) | 47(0.3%)* | 35(0.3%) | 894(0.2%) |
| 063 Pneumonia | 1301(1.7%) | 331(2.0%) | 497(3.0%)* | 119(1.8%) | 523(2.0%) | 614(1.7%) | 1099(1.4%)* | 15(2.4%) | 1.406(2.1%)* | 97(1.4%) | 966(2.0%)* | 358(2.8%)* | 499(1.5%)* | 142(1.7%) | 40(1.1%)* | 26(4.6%)* | 228(0.9%)* | 258(1.7%) | 249(2.0%) | 8768(1.8%) |
| 064 Chronic lower respiratory tract diseases (except asthma) | 1.950(2.5%) | 400(2.4%) | 467(2.8%)* | 174(2.7%) | 667(2.5%) | 738(2.0%)* | 1.892(2.4%) | 20(3.2%) | 1.334(2.0%)* | 160(2.4%) | 1.306(2.7%)* | 331(2.6%) | 841(2.6%) | 276(3.2%)* | 59(1.6%)* | 12(2.1%) | 499(2.1%)* | 319(2.2%) | 341(2.8%)* | 11,786(2.4%) |
| 065 Asthma | 152(0.2%) | 22(0.1%) | 28(0.2%) | 12(0.2%) | 58(0.2%) | 57(0.2%) | 154(0.2%) | 0(0.0%) | 73(0.1%)* | 17(0.3%) | 89(0.2%) | 23(0.2%) | 71(0.2%) | 14(0.2%) | 4(0.1%) | 0(0.0%) | 90(0.4%)* | 63(0.4%)* | 21(0.2%) | 948(0.2%) |
| 066 Respiratory insufficiency | 360(0.5%) | 33(0.2%)* | 54(0.3%) | 21(0.3%) | 95(0.4%) | 107(0.3%)* | 337(0.4%) | 2(0.3%) | 551(0.8%)* | 19(0.3%) | 169(0.3%) | 38(0.3%) | 59(0.2%)* | 57(0.7%)* | 8(0.2%) | 4(0.7%) | 63(0.3%)* | 36(0.2%)* | 26(0.2%)* | 2039(0.4%) |
| 067 Other diseases of the respiratory system | 2673(3.4%)* | 581(3.5%) | 853(5.1%)* | 279 (4.3%)* | 1110(4.2%)* | 1356(3.7%) | 2502(3.1%)* | 18(2.8%) | 2858(4.3%)* | 211(3.1%) | 1402(2.9%)* | 650(5.0%)* | 1616(4.9%)* | 237(2.75%)* | 143(3.8%) | 14(2.5%) | 590(2.5%)* | 502(3.4%) | 393(3.2%)* | 17,988(3.6%) |
| Total “Causes of death due to respiratory system” | 16,765 (21.2%)*f | 5079(30.4%)* | 3442(20.6%)* | 1482(22.6%)* | 9866(37.6%)* | 12,040(33.0%)* | 25,486(31.9%)* | 159(25.1%) | 28,238(42.7%)* | 2046(30.4%)* | 10,434(21.3%)* | 3392(26.1%)* | 6338(19.3%)* | 1837(21.3%)* | 1061(28.5%) | 123(22.0%)* | 5836(24.3%)* | 3751(25.7%)* | 2505(20.3%)* | 139,880(28.3%) |
| 001-102 I-XXII. All Causes | 78,909 (16.0%)g | 16,680 (3.4%) | 16,725(3.4%) | 6561(1.3%) | 26,240(5.3%) | 36,522(7.4%) | 79,780(16.2%) | 633(0.1%) | 66,206(13.4%) | 6738(1.4%) | 49,033(9.9%) | 12,994(2.6%) | 32,879(6.7%) | 8608(1.7%) | 3727(0.8%) | 560(0.1%) | 24,041(4.9%) | 14,578(3.0%) | 12,362(2.5%) | 493,776(100.0%) |
| ICD-10 Causes of death | ≤18 years | 18–29 years | 30–39 years | 40–49 years | 50–59 years | 60–69 years | 70–79 years | 80–89 years | ≥90 years |
|---|---|---|---|---|---|---|---|---|---|
| (C) By age | |||||||||
| 00A Covid-19 Virus identified | 11(0.7%)a | 53(3.3%) | 129(4.1%) | 508(5.3%) | 1820(6.9%) | 5141(10.4%) | 12,491(13.7%) | 24,872(13.7%) | 15,333(11.8%) |
| 00B Covid-19 Unidentified virus (suspected) | 3(0.2%) | 14(0.9%) | 20(0.6%) | 75(0.8%) | 275(1.0%) | 590(1.2%) | 1885(2.1%) | 6139(3.4%) | 5480(4.2%) |
| 002 Tuberculosis and its late effects | 0(0.0%) | 2(0.1%) | 6(0.2%) | 16(0.2%) | 20(0.1%) | 23(0.0%) | 28(0.0%) | 67(0.0%) | 36(0.0%) |
| 018 Malignant tumour of the trachea, bronchus and lung | 0(0.0%) | 10(0.6%) | 44(1.4%) | 501(5.2%) | 2851(10.9%) | 6440(13.0%) | 6838(7.5%) | 4442(2.5%) | 792(0.6%) |
| 019 Other respiratory and intrathoracic malignant tumours | 2(0.1%) | 4(0.2%) | 9(0.3%) | 22(0.2%) | 51(0.2%) | 103(0.2%) | 155(0.2%) | 141(0.1%) | 15(0.0%) |
| 062 Influenza (includes influenza due to identified pandemic or zoonotic influenza viruses) | 8(0.5%) | 6(0.4%) | 11(0.3%) | 18(0.2%) | 61(0.2%) | 114(0.2%) | 171(0.2%) | 321(0.2%) | 184(0.1%) |
| 063 Pneumonia | 6(0.4%) | 11(0.7%) | 26(0.8%) | 89(0.9%) | 205(0.8%) | 428(0.9%) | 1199(1.3%) | 3684(2.0%) | 3120(2.4%) |
| 064 Chronic lower respiratory tract diseases (except asthma) | 1 (0.1%) | 3(0.2%) | 4(0.1%) | 52(0.5%) | 308(1.2%) | 1188(2.4%) | 2662(2.9%) | 4834(2.7%) | 2734(2.1%) |
| 065 Asthma | 2(0.1%) | 6(0.4%) | 8(0.3%) | 18(0.2%) | 37(0.1%) | 40(0.1%) | 130(0.1%) | 407(0.2%) | 300(0.2%) |
| 066 Respiratory insufficiency | 2(0.1%) | 5(0.3%) | 12(0.4%) | 52(0.5%) | 111(0.4%) | 173(0.3%) | 274(0.3%) | 745(0.4%) | 665(0.5%) |
| 067 Other diseases of the respiratory system | 15(0.9%) | 29(1.8%) | 71(2.2%) | 183(1.9%) | 414(1.6%) | 908(1.8%) | 2483(2.7%) | 7436(4.1%) | 6449(5.0%) |
| Total “Causes of death of the respiratory system” | 50(3.1%)b | 143(8.8%) | 340(10.8%) | 1534(16.0%) | 6153(23.5%) | 15,148(30.6%) | 28,316(31.1%) | 53,088(29.3%) | 35,108(27.1%) |
| 001-102 I-XXII. All Causes | 1592(0.3%)h | 1625(0.3%) | 3159(0.6%) | 9601(1.9%) | 26,236(5.3%) | 49,503(10.0%) | 91,191(18.5%) | 181,439(36.7%) | 129,430(26.2%) |

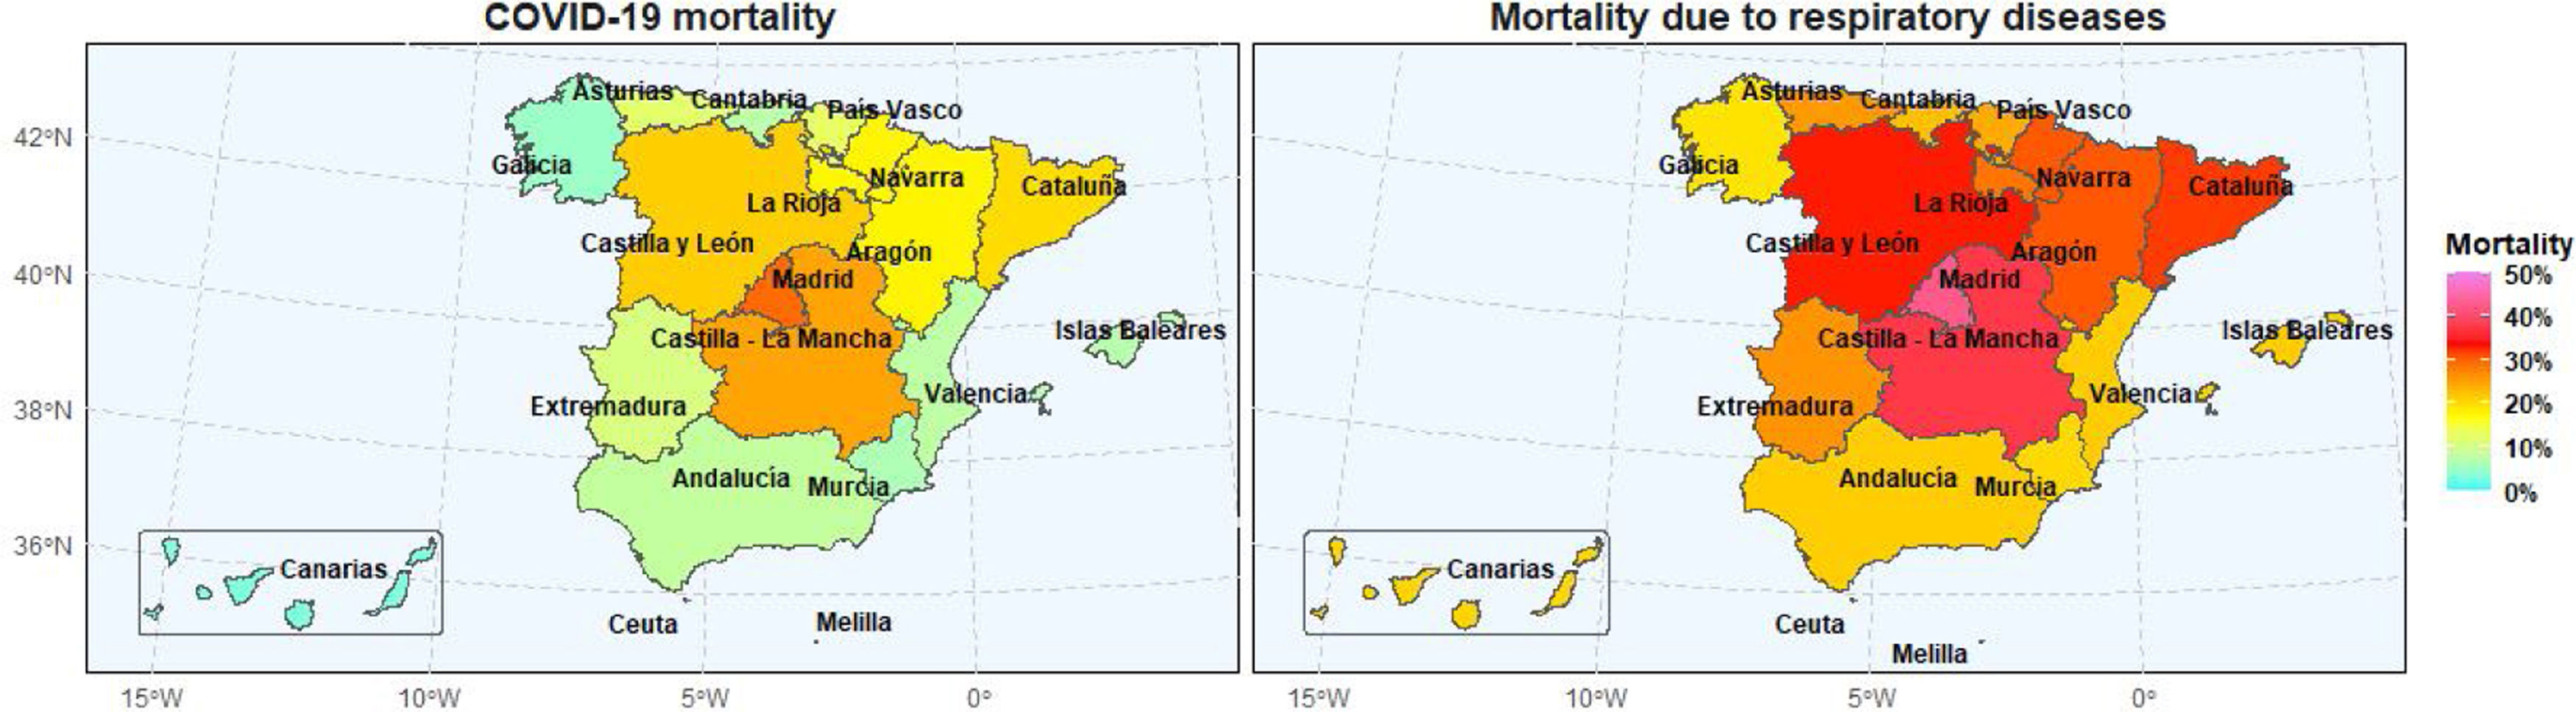
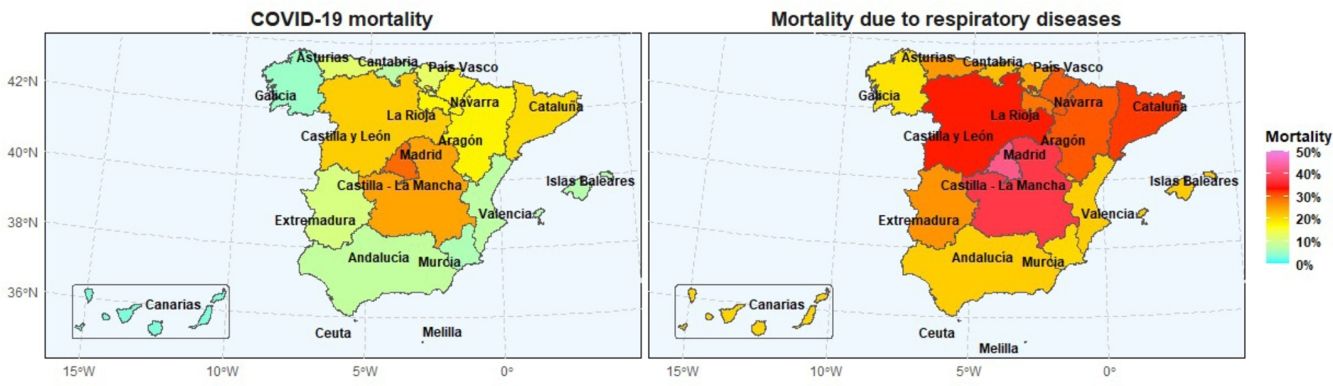
By CC.AA., the highest percentage of deaths by diseases of the respiratory system was observed in the Community of Madrid (42.7%) and then in Castilla-La Mancha (37.6.2%), while the lowest in Galicia (19. 0%), and Murcia with 20.3% (Fig. 2). Regarding death from COVID-19, the highest relative percentage was also observed in Madrid (29.2%) and then in Castilla-La Mancha (24.8%), and the lowest in the Canary Islands (3.0%) and Galicia (4.8%).
 COVID-19; (b) diseases of the respiratory system.")
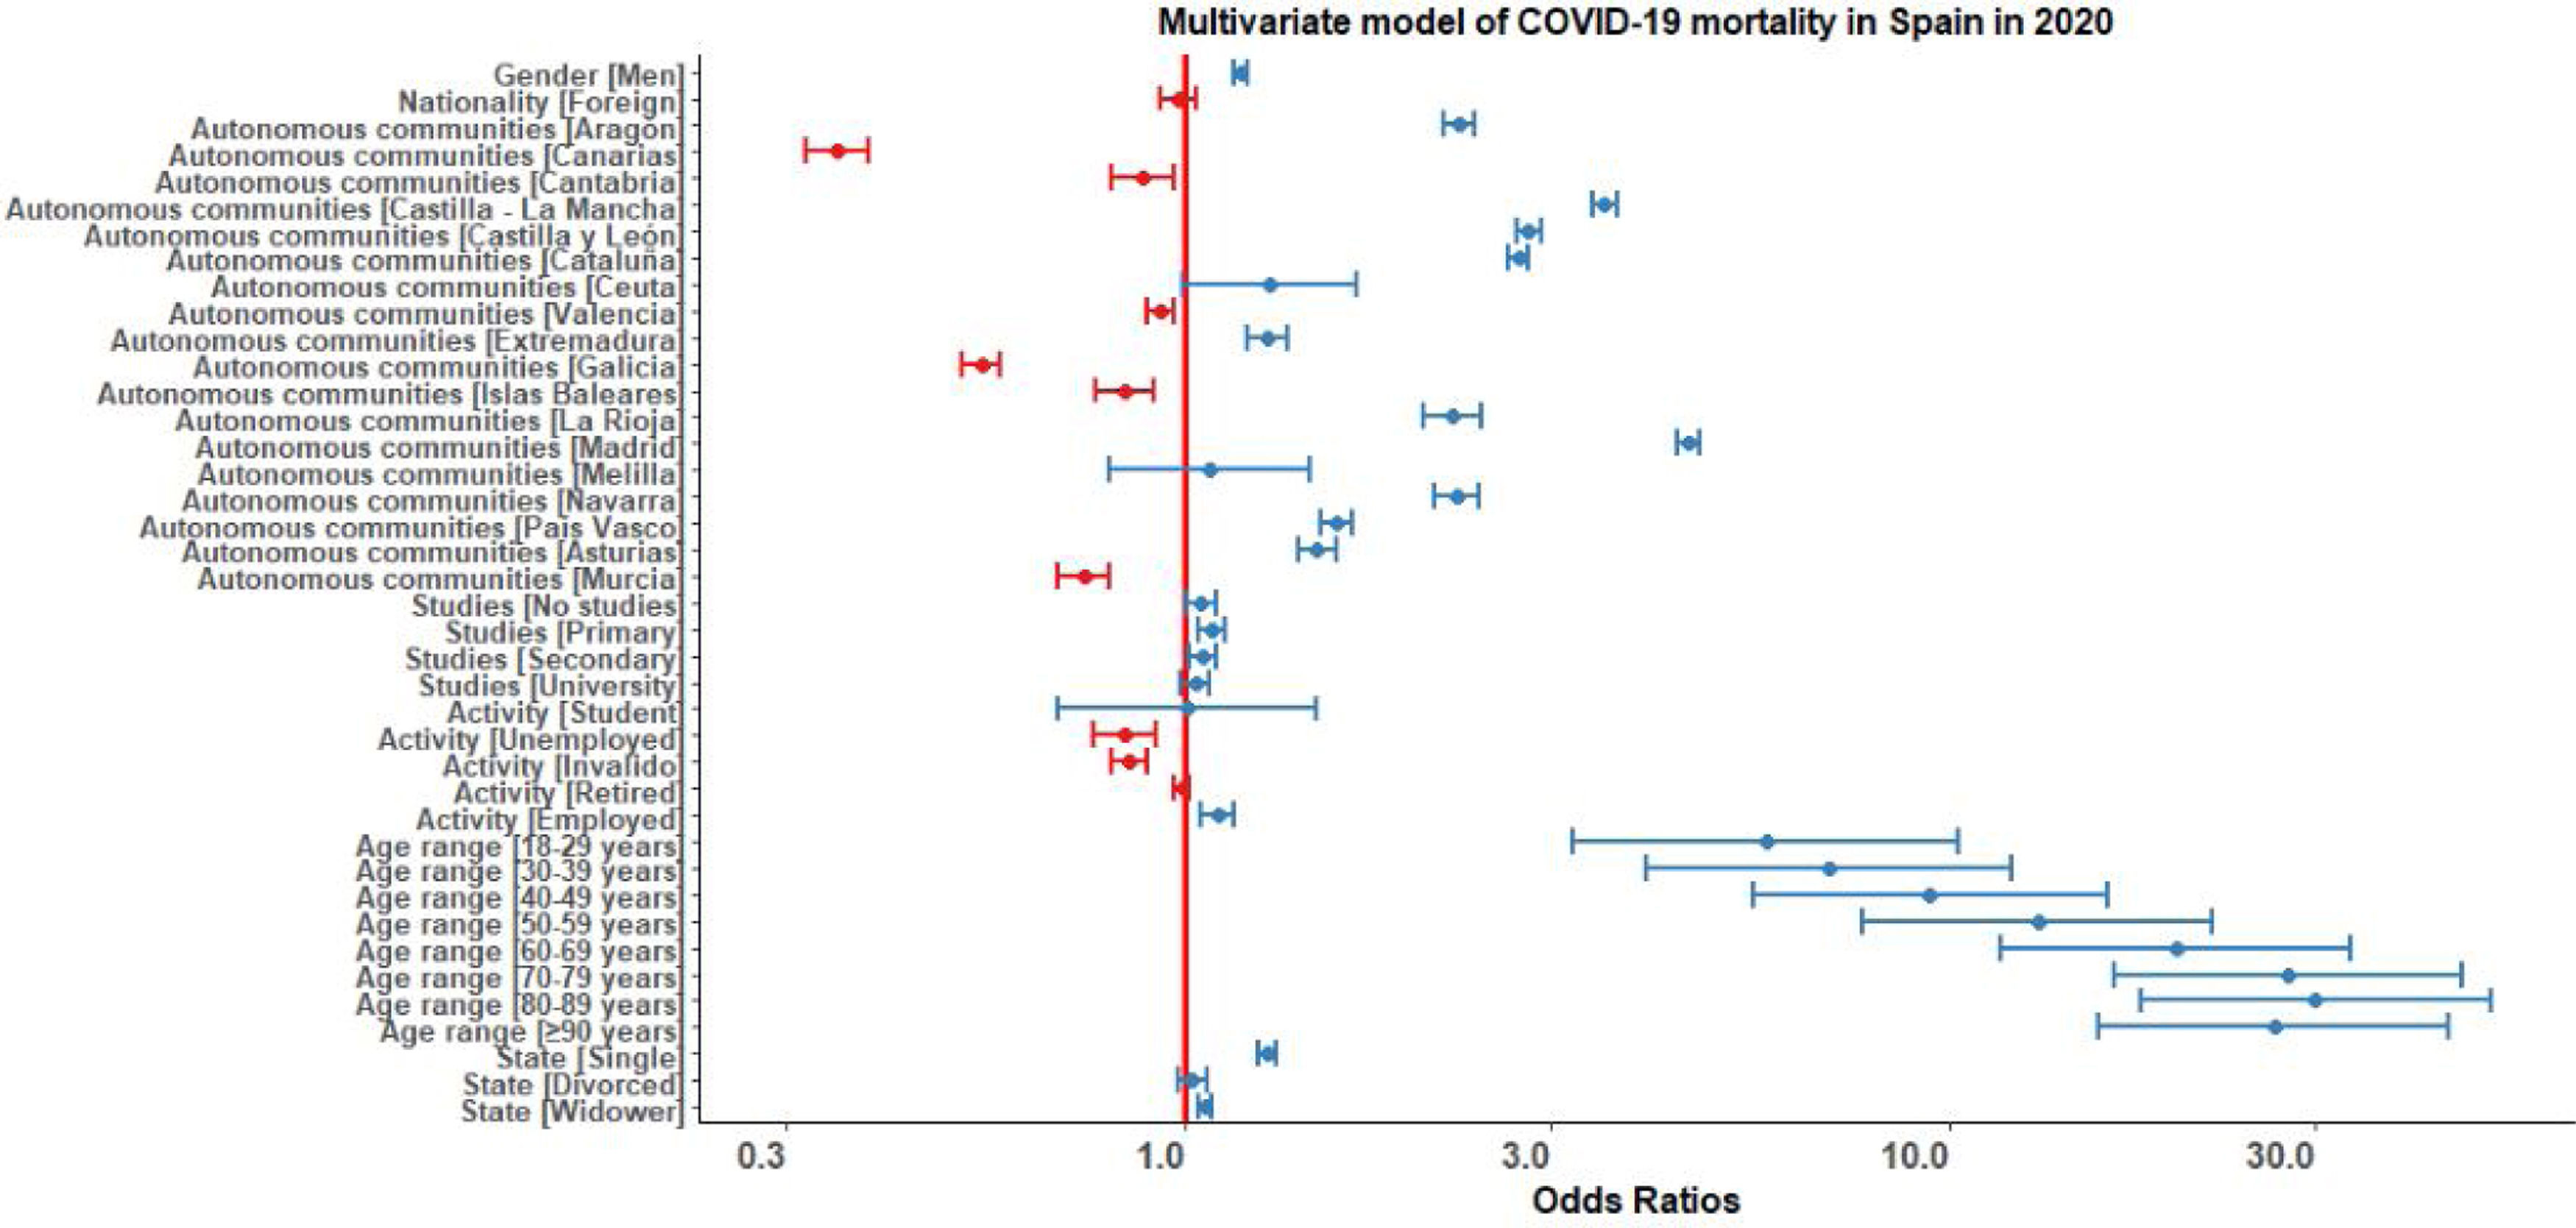
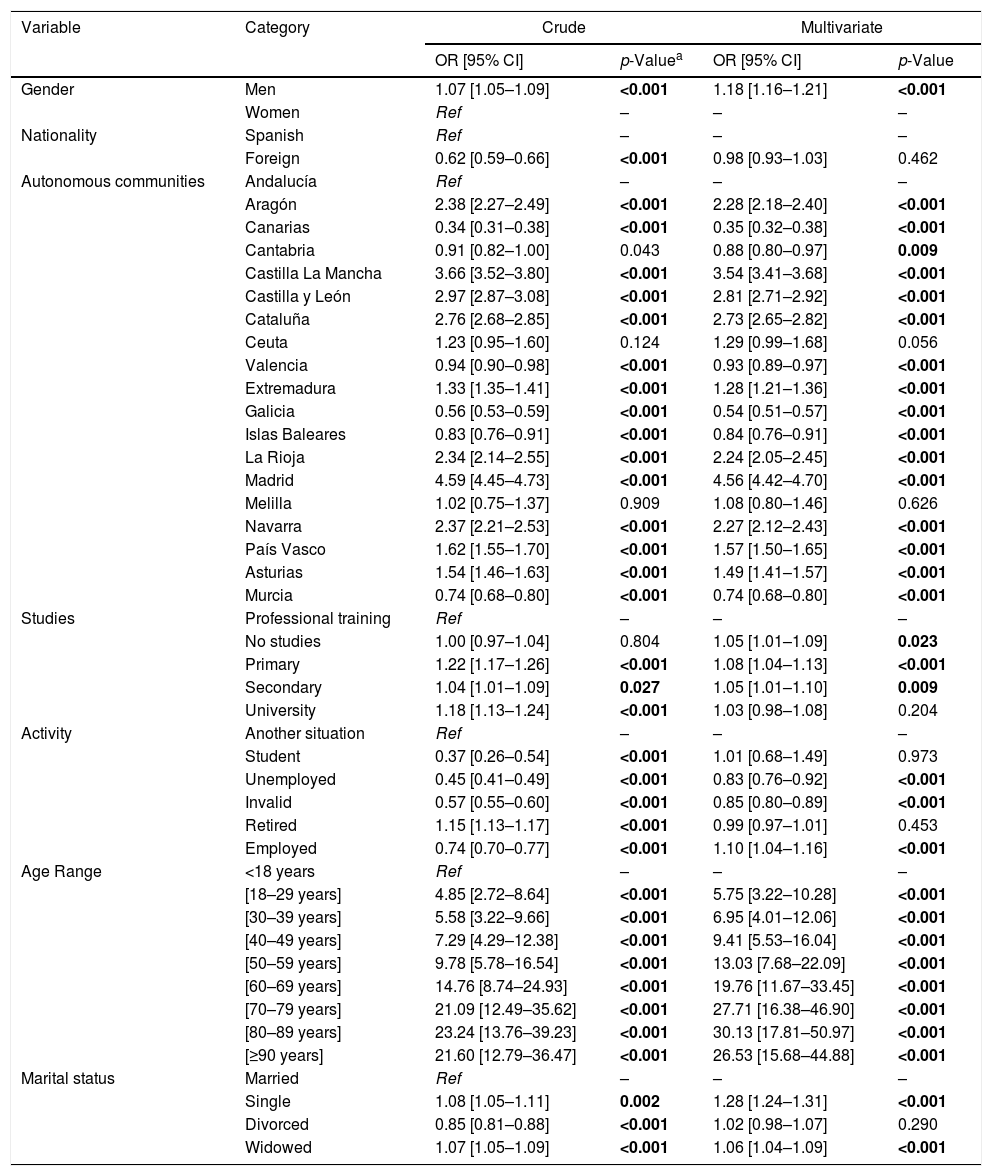
Finally, the individual determinants of death from COVID-19 and from the respiratory system were analyzed in microdata. The variables associated with death from COVID-19 in the bivariate analysis were male, of Spanish nationality, with completed Primary education or higher, retired, increasing age to a maximum of 80 years, single or widowed, and with a marked variation by CC.AA. (Table 3). In the multivariate analysis, the direction and magnitude of the associations were maintained, except for nationality and employment status (Fig. 3).
Odds ratio for COVID-19 mortality in Spain in 2020, crude and multivariate.
| Variable | Category | Crude | Multivariate | ||
|---|---|---|---|---|---|
| OR [95% CI] | p-Valuea | OR [95% CI] | p-Value | ||
| Gender | Men | 1.07 [1.05–1.09] | <0.001 | 1.18 [1.16–1.21] | <0.001 |
| Women | Ref | – | – | – | |
| Nationality | Spanish | Ref | – | – | – |
| Foreign | 0.62 [0.59–0.66] | <0.001 | 0.98 [0.93–1.03] | 0.462 | |
| Autonomous communities | Andalucía | Ref | – | – | – |
| Aragón | 2.38 [2.27–2.49] | <0.001 | 2.28 [2.18–2.40] | <0.001 | |
| Canarias | 0.34 [0.31–0.38] | <0.001 | 0.35 [0.32–0.38] | <0.001 | |
| Cantabria | 0.91 [0.82–1.00] | 0.043 | 0.88 [0.80–0.97] | 0.009 | |
| Castilla La Mancha | 3.66 [3.52–3.80] | <0.001 | 3.54 [3.41–3.68] | <0.001 | |
| Castilla y León | 2.97 [2.87–3.08] | <0.001 | 2.81 [2.71–2.92] | <0.001 | |
| Cataluña | 2.76 [2.68–2.85] | <0.001 | 2.73 [2.65–2.82] | <0.001 | |
| Ceuta | 1.23 [0.95–1.60] | 0.124 | 1.29 [0.99–1.68] | 0.056 | |
| Valencia | 0.94 [0.90–0.98] | <0.001 | 0.93 [0.89–0.97] | <0.001 | |
| Extremadura | 1.33 [1.35–1.41] | <0.001 | 1.28 [1.21–1.36] | <0.001 | |
| Galicia | 0.56 [0.53–0.59] | <0.001 | 0.54 [0.51–0.57] | <0.001 | |
| Islas Baleares | 0.83 [0.76–0.91] | <0.001 | 0.84 [0.76–0.91] | <0.001 | |
| La Rioja | 2.34 [2.14–2.55] | <0.001 | 2.24 [2.05–2.45] | <0.001 | |
| Madrid | 4.59 [4.45–4.73] | <0.001 | 4.56 [4.42–4.70] | <0.001 | |
| Melilla | 1.02 [0.75–1.37] | 0.909 | 1.08 [0.80–1.46] | 0.626 | |
| Navarra | 2.37 [2.21–2.53] | <0.001 | 2.27 [2.12–2.43] | <0.001 | |
| País Vasco | 1.62 [1.55–1.70] | <0.001 | 1.57 [1.50–1.65] | <0.001 | |
| Asturias | 1.54 [1.46–1.63] | <0.001 | 1.49 [1.41–1.57] | <0.001 | |
| Murcia | 0.74 [0.68–0.80] | <0.001 | 0.74 [0.68–0.80] | <0.001 | |
| Studies | Professional training | Ref | – | – | – |
| No studies | 1.00 [0.97–1.04] | 0.804 | 1.05 [1.01–1.09] | 0.023 | |
| Primary | 1.22 [1.17–1.26] | <0.001 | 1.08 [1.04–1.13] | <0.001 | |
| Secondary | 1.04 [1.01–1.09] | 0.027 | 1.05 [1.01–1.10] | 0.009 | |
| University | 1.18 [1.13–1.24] | <0.001 | 1.03 [0.98–1.08] | 0.204 | |
| Activity | Another situation | Ref | – | – | – |
| Student | 0.37 [0.26–0.54] | <0.001 | 1.01 [0.68–1.49] | 0.973 | |
| Unemployed | 0.45 [0.41–0.49] | <0.001 | 0.83 [0.76–0.92] | <0.001 | |
| Invalid | 0.57 [0.55–0.60] | <0.001 | 0.85 [0.80–0.89] | <0.001 | |
| Retired | 1.15 [1.13–1.17] | <0.001 | 0.99 [0.97–1.01] | 0.453 | |
| Employed | 0.74 [0.70–0.77] | <0.001 | 1.10 [1.04–1.16] | <0.001 | |
| Age Range | <18 years | Ref | – | – | – |
| [18–29 years] | 4.85 [2.72–8.64] | <0.001 | 5.75 [3.22–10.28] | <0.001 | |
| [30–39 years] | 5.58 [3.22–9.66] | <0.001 | 6.95 [4.01–12.06] | <0.001 | |
| [40–49 years] | 7.29 [4.29–12.38] | <0.001 | 9.41 [5.53–16.04] | <0.001 | |
| [50–59 years] | 9.78 [5.78–16.54] | <0.001 | 13.03 [7.68–22.09] | <0.001 | |
| [60–69 years] | 14.76 [8.74–24.93] | <0.001 | 19.76 [11.67–33.45] | <0.001 | |
| [70–79 years] | 21.09 [12.49–35.62] | <0.001 | 27.71 [16.38–46.90] | <0.001 | |
| [80–89 years] | 23.24 [13.76–39.23] | <0.001 | 30.13 [17.81–50.97] | <0.001 | |
| [≥90 years] | 21.60 [12.79–36.47] | <0.001 | 26.53 [15.68–44.88] | <0.001 | |
| Marital status | Married | Ref | – | – | – |
| Single | 1.08 [1.05–1.11] | 0.002 | 1.28 [1.24–1.31] | <0.001 | |
| Divorced | 0.85 [0.81–0.88] | <0.001 | 1.02 [0.98–1.07] | 0.290 | |
| Widowed | 1.07 [1.05–1.09] | <0.001 | 1.06 [1.04–1.09] | <0.001 | |

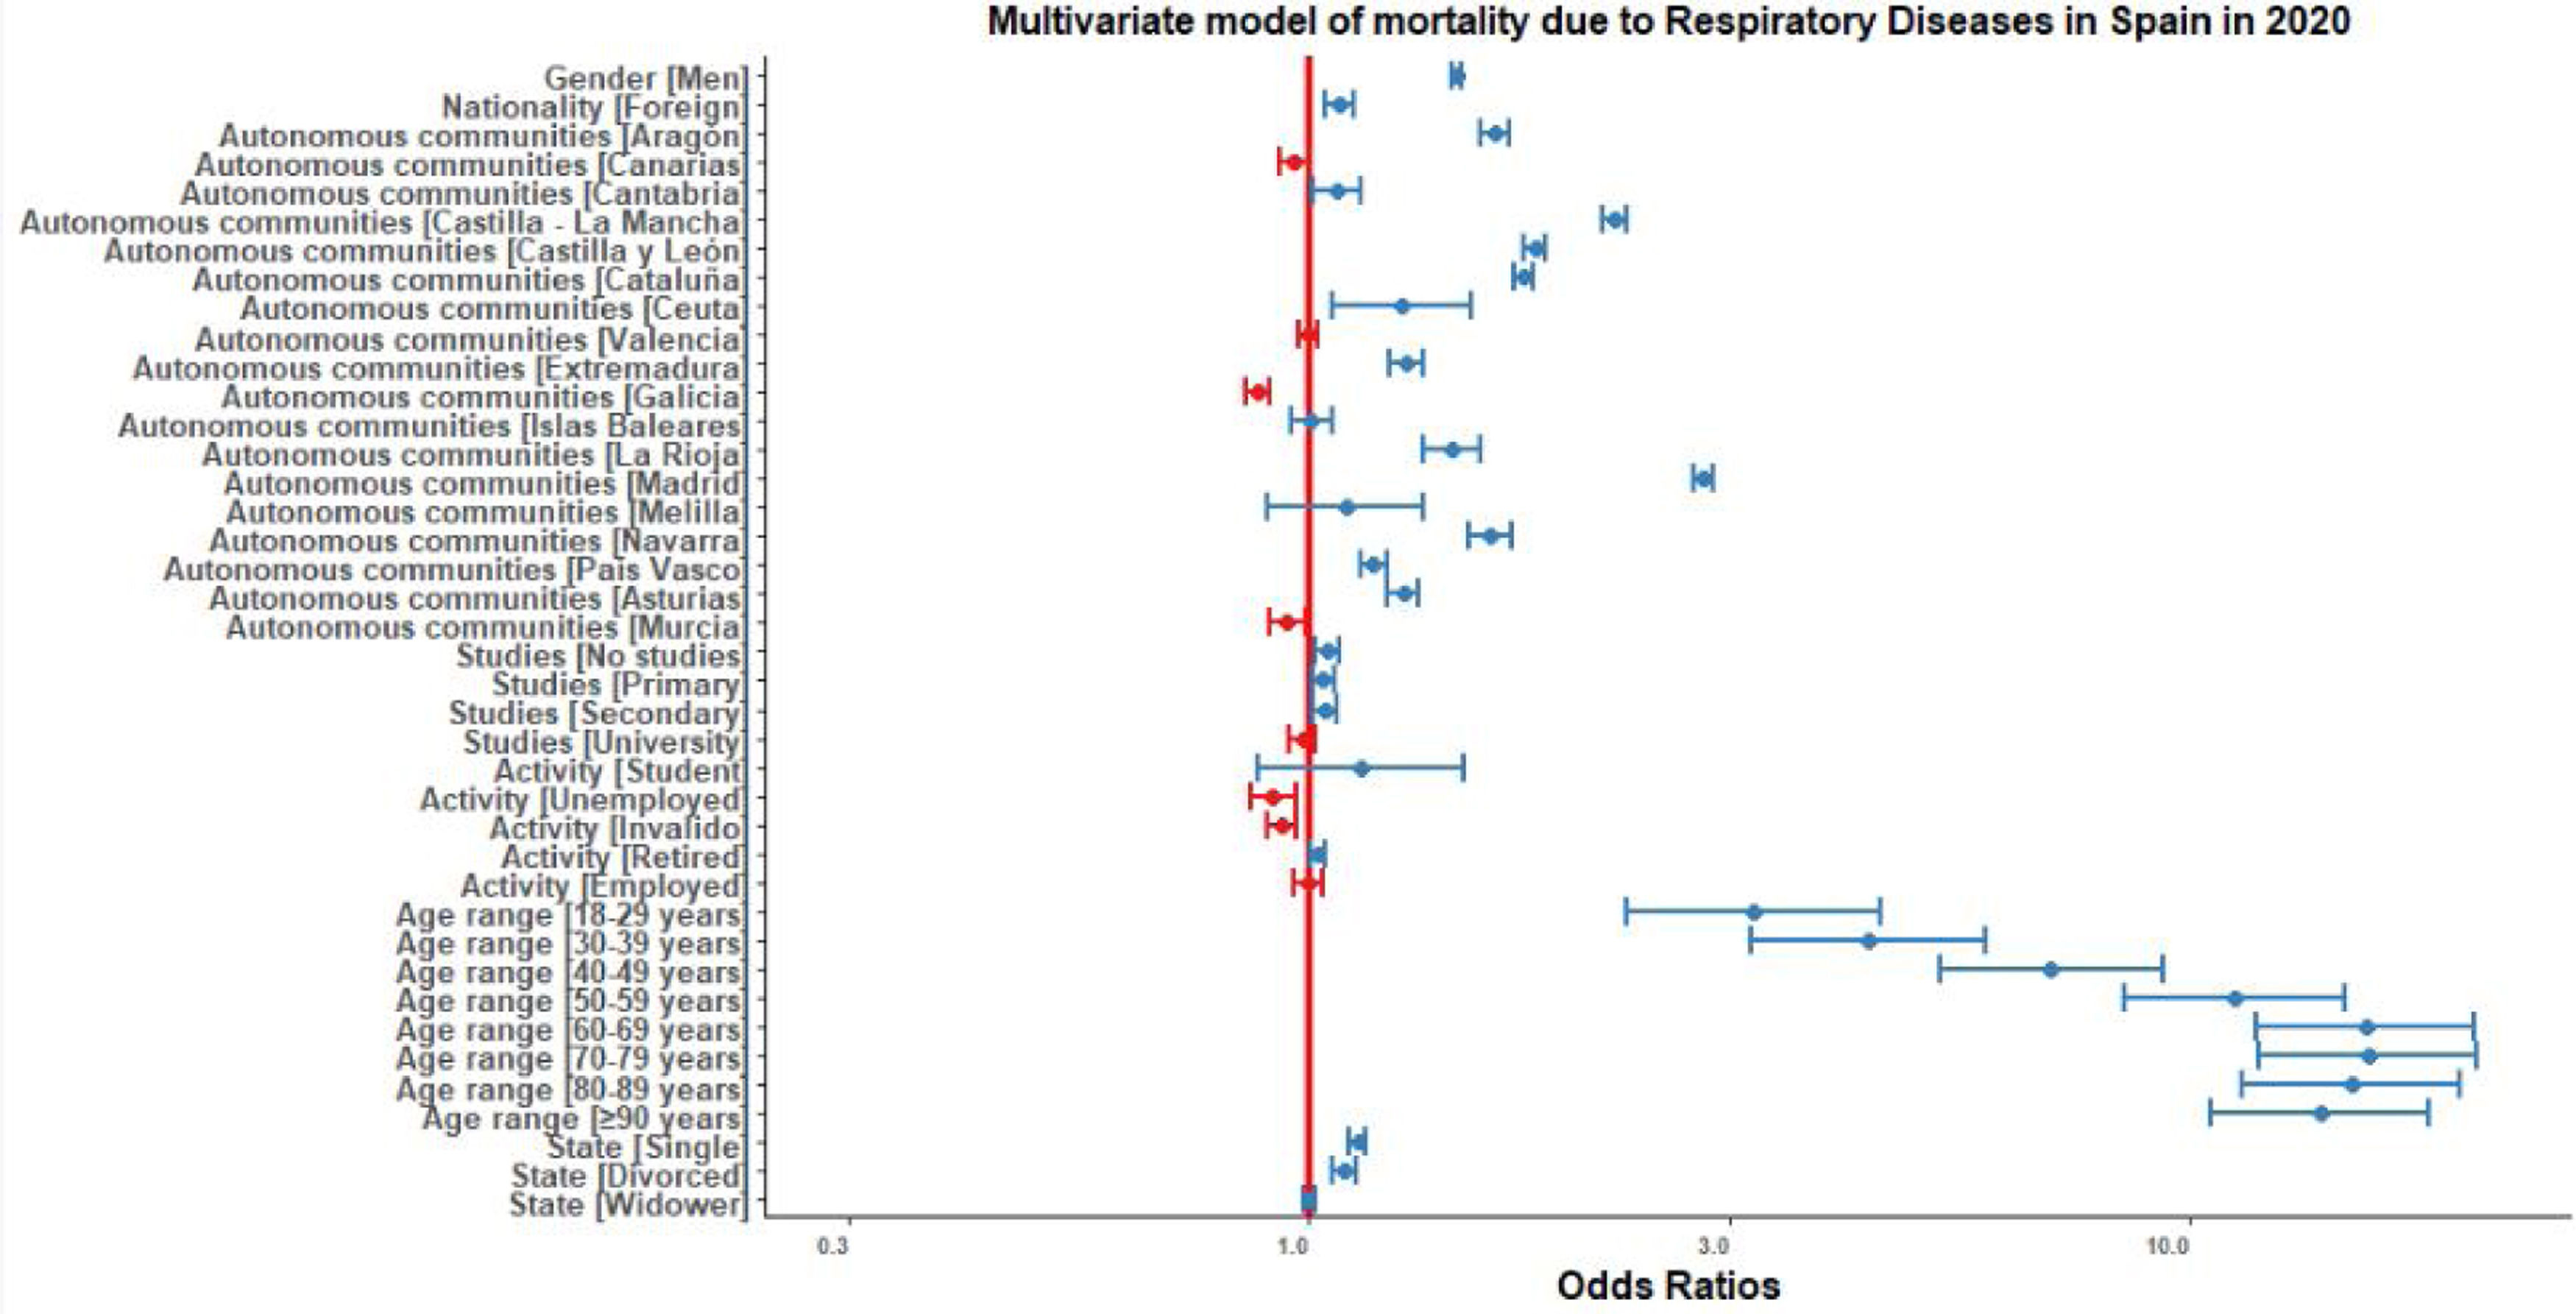
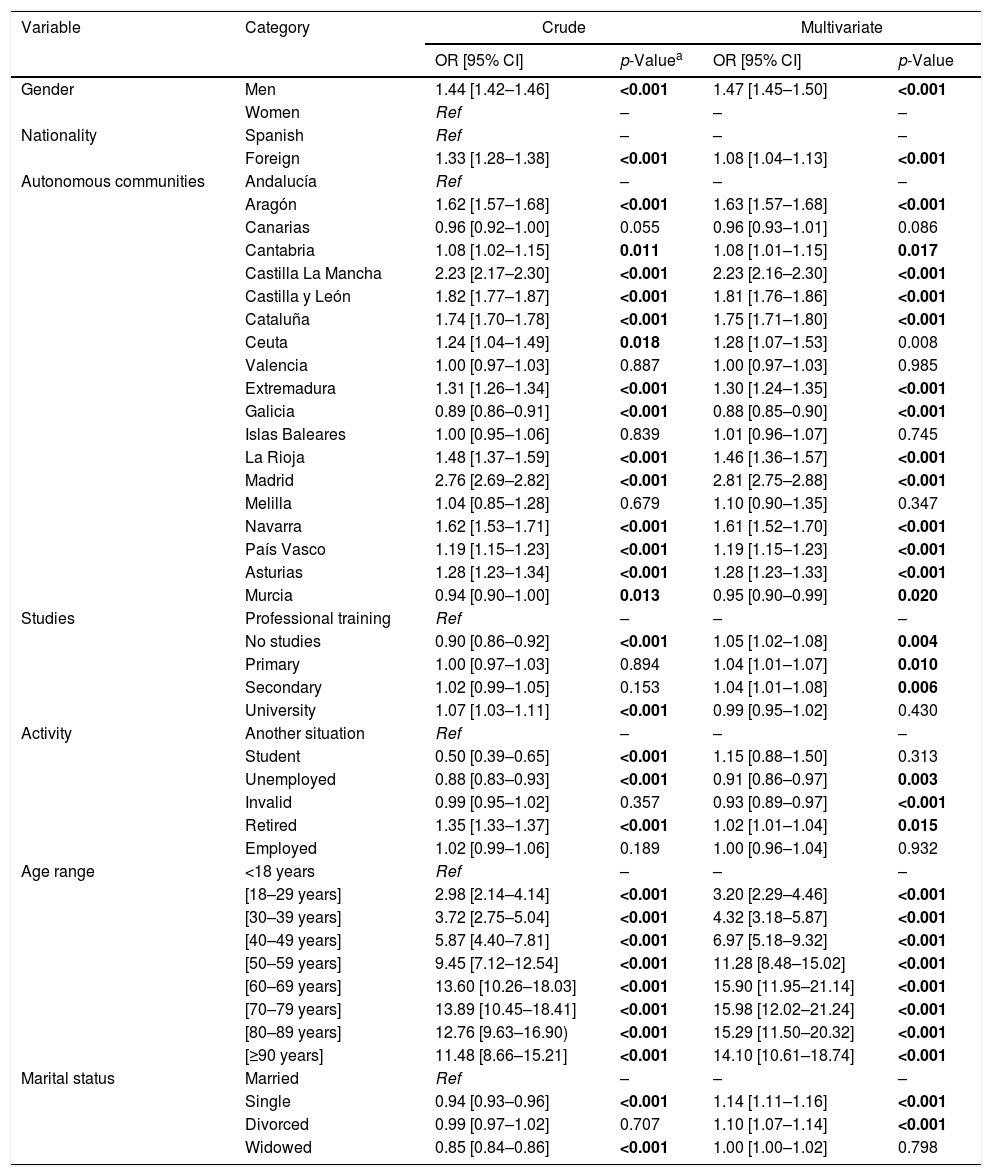
The variables associated with death by diseases of the respiratory system in the bivariate analysis were male, of foreign nationality, completed university education, retired, increasing age up to a maximum of 70 years, all with a marked variation by CC.AA. (Table 4). In the multivariate analysis, the direction and magnitude of the associations were maintained, except for studies, work activity and marital status (Fig. 4).
Odds ratio for diseases of the respiratory system mortality in Spain in 2020, crude and multivariate.
| Variable | Category | Crude | Multivariate | ||
|---|---|---|---|---|---|
| OR [95% CI] | p-Valuea | OR [95% CI] | p-Value | ||
| Gender | Men | 1.44 [1.42–1.46] | <0.001 | 1.47 [1.45–1.50] | <0.001 |
| Women | Ref | – | – | – | |
| Nationality | Spanish | Ref | – | – | – |
| Foreign | 1.33 [1.28–1.38] | <0.001 | 1.08 [1.04–1.13] | <0.001 | |
| Autonomous communities | Andalucía | Ref | – | – | – |
| Aragón | 1.62 [1.57–1.68] | <0.001 | 1.63 [1.57–1.68] | <0.001 | |
| Canarias | 0.96 [0.92–1.00] | 0.055 | 0.96 [0.93–1.01] | 0.086 | |
| Cantabria | 1.08 [1.02–1.15] | 0.011 | 1.08 [1.01–1.15] | 0.017 | |
| Castilla La Mancha | 2.23 [2.17–2.30] | <0.001 | 2.23 [2.16–2.30] | <0.001 | |
| Castilla y León | 1.82 [1.77–1.87] | <0.001 | 1.81 [1.76–1.86] | <0.001 | |
| Cataluña | 1.74 [1.70–1.78] | <0.001 | 1.75 [1.71–1.80] | <0.001 | |
| Ceuta | 1.24 [1.04–1.49] | 0.018 | 1.28 [1.07–1.53] | 0.008 | |
| Valencia | 1.00 [0.97–1.03] | 0.887 | 1.00 [0.97–1.03] | 0.985 | |
| Extremadura | 1.31 [1.26–1.34] | <0.001 | 1.30 [1.24–1.35] | <0.001 | |
| Galicia | 0.89 [0.86–0.91] | <0.001 | 0.88 [0.85–0.90] | <0.001 | |
| Islas Baleares | 1.00 [0.95–1.06] | 0.839 | 1.01 [0.96–1.07] | 0.745 | |
| La Rioja | 1.48 [1.37–1.59] | <0.001 | 1.46 [1.36–1.57] | <0.001 | |
| Madrid | 2.76 [2.69–2.82] | <0.001 | 2.81 [2.75–2.88] | <0.001 | |
| Melilla | 1.04 [0.85–1.28] | 0.679 | 1.10 [0.90–1.35] | 0.347 | |
| Navarra | 1.62 [1.53–1.71] | <0.001 | 1.61 [1.52–1.70] | <0.001 | |
| País Vasco | 1.19 [1.15–1.23] | <0.001 | 1.19 [1.15–1.23] | <0.001 | |
| Asturias | 1.28 [1.23–1.34] | <0.001 | 1.28 [1.23–1.33] | <0.001 | |
| Murcia | 0.94 [0.90–1.00] | 0.013 | 0.95 [0.90–0.99] | 0.020 | |
| Studies | Professional training | Ref | – | – | – |
| No studies | 0.90 [0.86–0.92] | <0.001 | 1.05 [1.02–1.08] | 0.004 | |
| Primary | 1.00 [0.97–1.03] | 0.894 | 1.04 [1.01–1.07] | 0.010 | |
| Secondary | 1.02 [0.99–1.05] | 0.153 | 1.04 [1.01–1.08] | 0.006 | |
| University | 1.07 [1.03–1.11] | <0.001 | 0.99 [0.95–1.02] | 0.430 | |
| Activity | Another situation | Ref | – | – | – |
| Student | 0.50 [0.39–0.65] | <0.001 | 1.15 [0.88–1.50] | 0.313 | |
| Unemployed | 0.88 [0.83–0.93] | <0.001 | 0.91 [0.86–0.97] | 0.003 | |
| Invalid | 0.99 [0.95–1.02] | 0.357 | 0.93 [0.89–0.97] | <0.001 | |
| Retired | 1.35 [1.33–1.37] | <0.001 | 1.02 [1.01–1.04] | 0.015 | |
| Employed | 1.02 [0.99–1.06] | 0.189 | 1.00 [0.96–1.04] | 0.932 | |
| Age range | <18 years | Ref | – | – | – |
| [18–29 years] | 2.98 [2.14–4.14] | <0.001 | 3.20 [2.29–4.46] | <0.001 | |
| [30–39 years] | 3.72 [2.75–5.04] | <0.001 | 4.32 [3.18–5.87] | <0.001 | |
| [40–49 years] | 5.87 [4.40–7.81] | <0.001 | 6.97 [5.18–9.32] | <0.001 | |
| [50–59 years] | 9.45 [7.12–12.54] | <0.001 | 11.28 [8.48–15.02] | <0.001 | |
| [60–69 years] | 13.60 [10.26–18.03] | <0.001 | 15.90 [11.95–21.14] | <0.001 | |
| [70–79 years] | 13.89 [10.45–18.41] | <0.001 | 15.98 [12.02–21.24] | <0.001 | |
| [80–89 years] | 12.76 [9.63–16.90) | <0.001 | 15.29 [11.50–20.32] | <0.001 | |
| [≥90 years] | 11.48 [8.66–15.21] | <0.001 | 14.10 [10.61–18.74] | <0.001 | |
| Marital status | Married | Ref | – | – | – |
| Single | 0.94 [0.93–0.96] | <0.001 | 1.14 [1.11–1.16] | <0.001 | |
| Divorced | 0.99 [0.97–1.02] | 0.707 | 1.10 [1.07–1.14] | <0.001 | |
| Widowed | 0.85 [0.84–0.86] | <0.001 | 1.00 [1.00–1.02] | 0.798 | |

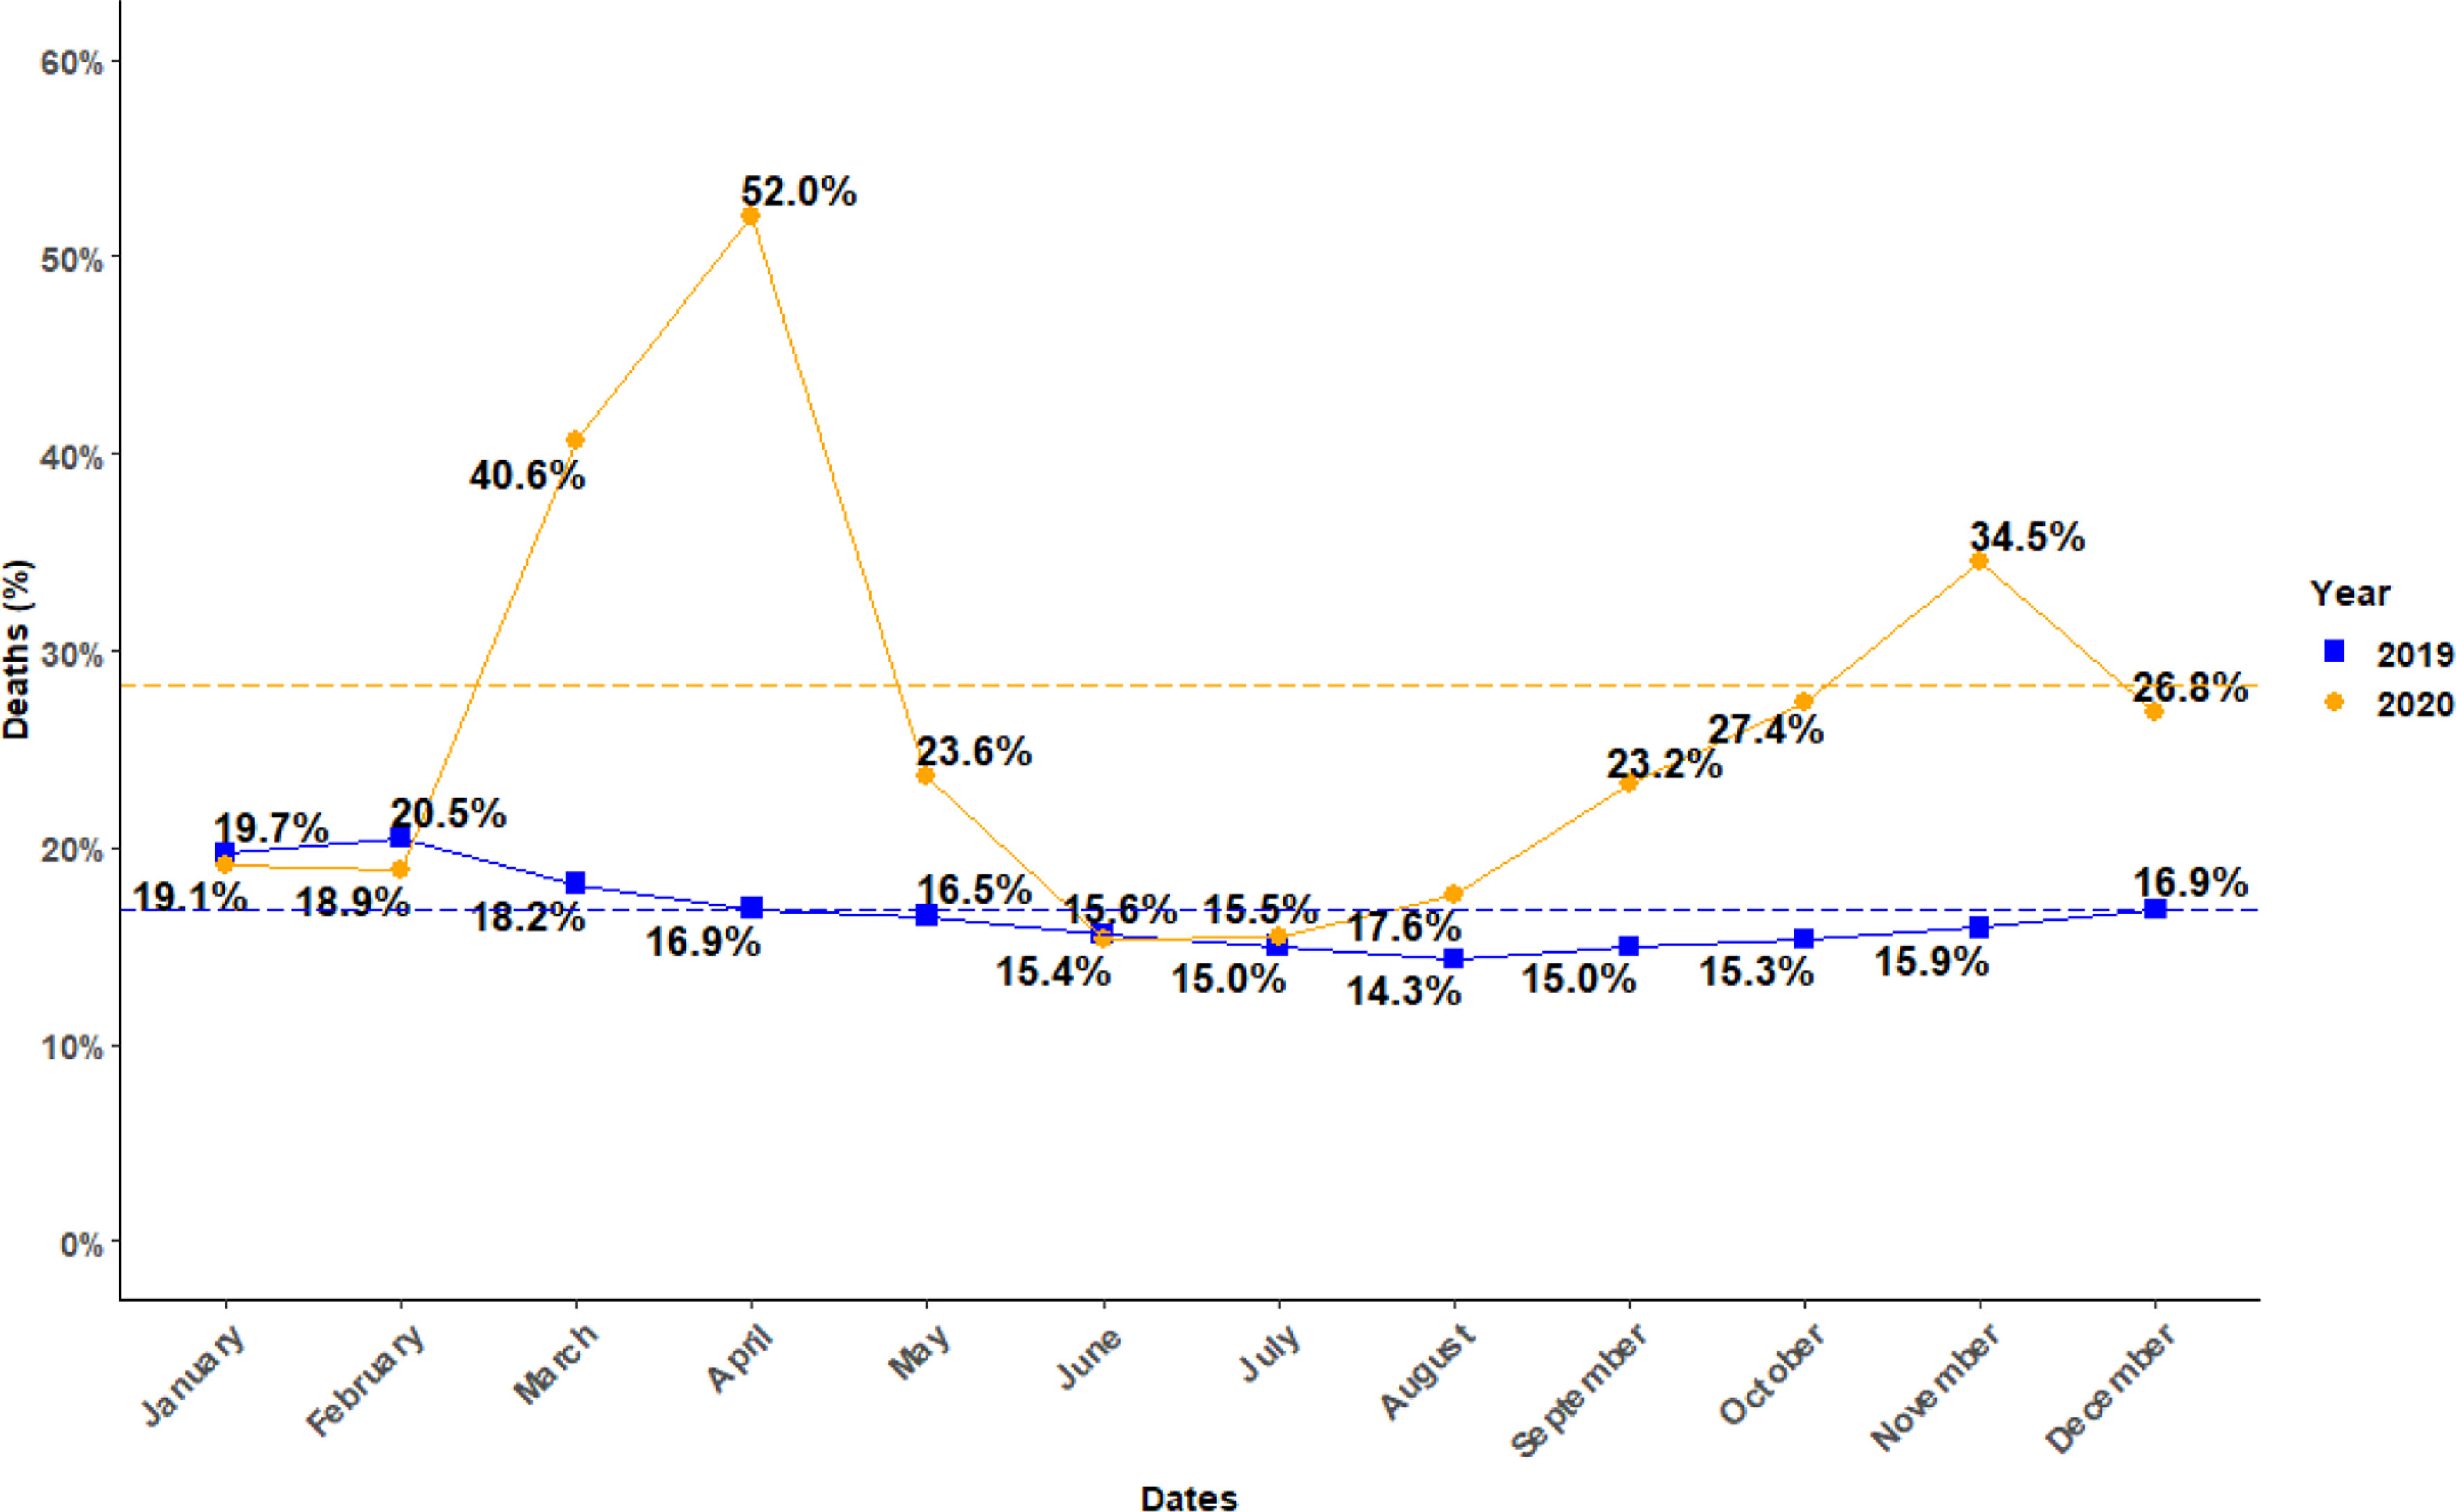
In Fig. 5, it can be seen that the trend of higher mortality (gross %) by diseases of the respiratory system in winter in Spain in 2019 was broken in 2020, with a substantial increase in deaths during March and April corresponding to the first wave of COVID-19; and also later in November 2020, coinciding with the second wave.
Discussion of mortality (crude %) by diseases of the respiratory system in 2020 compared to 2019.")
Since its emergence on December 31, 2019,13 SARS-CoV-2 and its disease COVID-19, have modified usual clinical practice. They have also produced recent changes in the secular trends of mortality and health statistics in the world and in Spain.3,4,14
As a cause of death, COVID-19 has displaced the distribution and ranking of the main causes of death; In particular, in 2020 it became the leading cause of death in Spain, with more than 75,000 deaths, including those confirmed and suspected in the first wave. In addition, if all deaths by diseases of the respiratory system are grouped together, an increase in the burden of mortality of more than two thirds (68.5%) is observed compared to the previous year. Although, as can be seen in our analysis, the variations by CC.AA. were very large, a microdata analysis confirms the known risk factors for mortality from COVID-19, namely: male gender, old age, and associated frailty.
This analysis has a number of strengths such as its immediacy, urgency, obvious relevance, and internal consistency. In addition, it contributes to the current debate on classifying by underlying cause vs. all basic death contributions. In particular, all INE Causes of Death Statistics offer data on the basic cause of death and also on all those other diseases that have contributed to death and that the certifying doctor has reported on the medical death certificate (multiple causes). All of them can be considered as advantages.
However, we must highlight a series of limitations, some of which are inherent to the death certificate. In general, it is considered established that many patients with COPD, asthma or other respiratory diseases die with them and not from them.9,10
Explanatory factors are the general population's lack of knowledge about respiratory diseases and the lack of specificity of most respiratory symptoms and signs, compared to other major causes of disease and death, such as cardiovascular or oncological causes. This will require the design of complex long-term strategies, and therefore difficult to implement. However, overestimation should be avoided; Strictly speaking, the COVID-19 clinical care task of the pulmonologist could only be considered directly in deaths occurring in the hospital. For example, during the first wave, people who died in residences, or at their homes, did not represent a care burden to pulmonologist. Of course, Pulmonology shares the treatment and management of respiratory patients with Internal Medicine, Primary Care and other specialties. Multisectoral coordination and dialogue should contribute to a better management of these patients.
In the current context, these first available indications point to a marked influence of COVID-19 on general morbidity and mortality.15,16 And in Spain, with a relatively ageing population compared even to our European neighbours, the effect could be huge.17,18 Although with preliminary data, it has already been estimated that in 2020 in Spain the impact of COVID-19 on life expectancy may produce a drop of up to two years,19 although with marked differences according to CC.AA. Subsequent confirmation of these trends by official statistics is required. In addition, a great indirect impact of COVID-19 on health services is expected, since the different waves of the pandemic have been collapsing Primary Care services for months, with fatigue and exhaustion of our Nursing and Medical colleagues in Primary Care, and producing delays (or direct cancellations) in screening and follow-up services for cancer and other diseases; therefore, they will also add morbidity and mortality to other causes of death from non-respiratory diseases. More studies of the impact of the pandemic on respiratory and non-respiratory patients are needed.20,21
Two years after its appearance, the current pandemic is revolutionizing clinical practice and changing Public Health in Spain and in the world, and poses an enormous challenge for policy makers and managers who have to decide when and what mitigation strategies to implement in the population, with obvious consequences in the medium- and long-term on health and the economy.22 The trouble that COVID-19 poses to health systems in general must also be considered as an opportunity,23,24 a new challenge22,25; and allow us to better prepare both for future pandemics and to face the greater challenge of chronicity.26,27
It should be noted that the diseases of the respiratory “system” in the current classification of the WHO (and any competent national bodies) do not fully reflect the reality of all diseases of the respiratory system, and do not include conditions that are part of the day-to-day care of patients from pulmonologists, such as tuberculosis, lung cancer or COVID-19, among others. A dialogue to try to correct and interpret well future statistics is necessary.
We conclude that the emergence of COVID-19 as the leading cause of death in 2020 in Spain has changed population health and the relative distribution of causes of death from respiratory diseases compared to previous years. The high population burden of respiratory diseases in Spain is confirmed, and it is aggravated by the COVID-19 pandemic.
Conflict of interestThe authors declare no conflict of interest.
The authors thank Margarita García-Ferrulo and Rosario González-García, from the S.G. de Estadisticas Sociales Sectoriales, Instituto Nacional de Estadistica, for their help in obtaining the database and their methodological contributions. Laura Moreno is a 6th-year student at the Faculty of Medicine, University of the Balearic Islands, in Palma, doing her final degree project on COVID-19.


