


Type 2 (T2) biomarkers such as blood eosinophil count (BEC) and FeNO have been related to a higher risk of exacerbations in COPD. It is unknown whether combining these biomarkers could be useful in forecasting COPD exacerbations.
MethodsCOPD patients were enrolled in this prospective, multicenter, observational study and followed up for 1 year, during which BEC were analysed at baseline (V0) while FeNO analyses were performed at baseline (V0), 6 months (V1) and 12 months (V2). The risk of moderate or severe exacerbation during follow up was assessed by Cox regression analysis, and the predictive capacity of both measurements was assessed by ROC curves and the DeLong test. Statistical significance was assumed at P<.05.
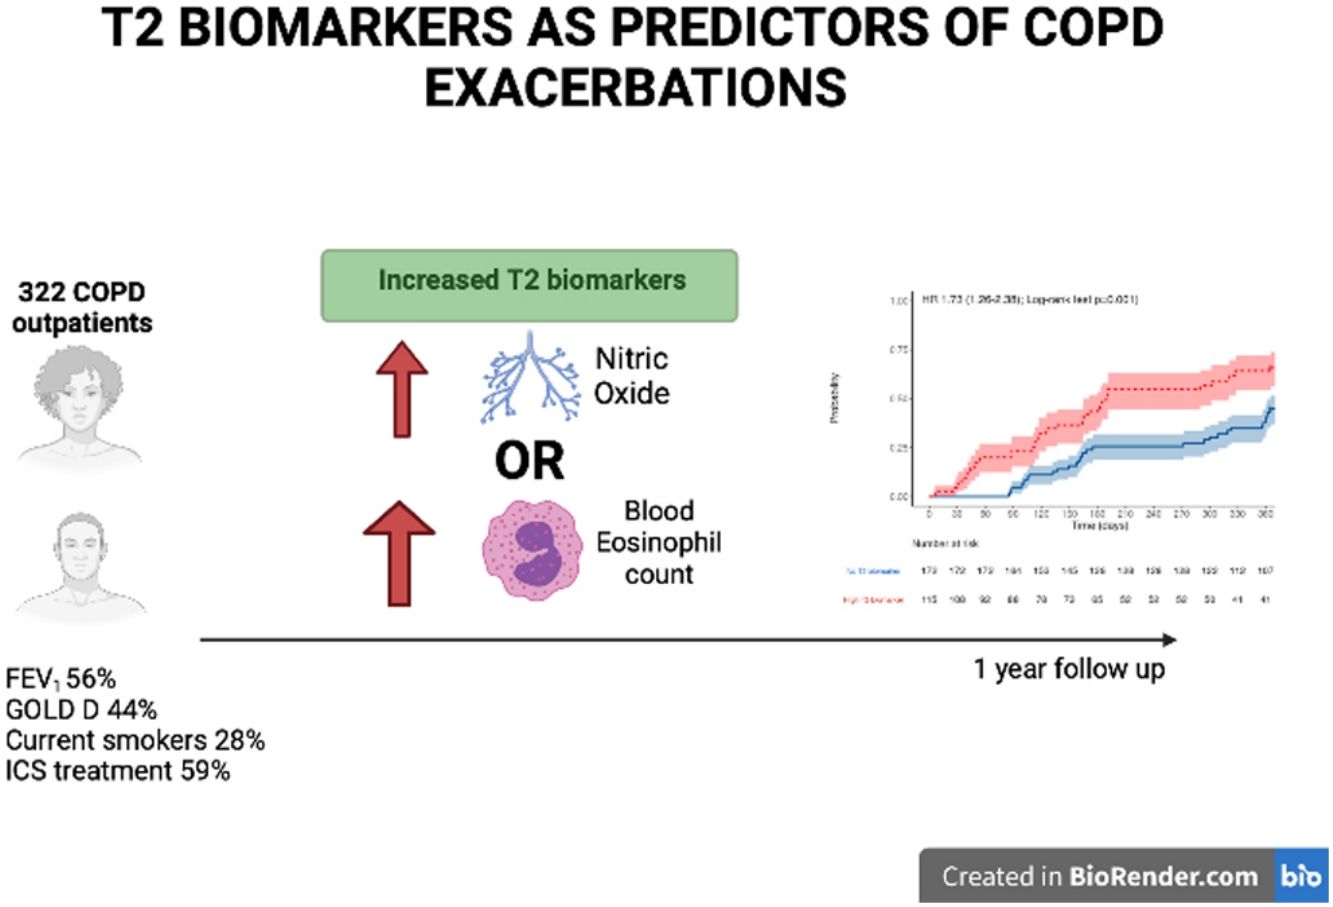
ResultsOf the 322 COPD patients initially recruited, 287 were followed up. At baseline, 28.0% were active smokers, and experienced moderate airflow limitation (mean FEV1 56.4%±17.0% predicted). Patients with at least one elevated T2 biomarker (n=125, 42.5%) were at increased risk of COPD exacerbation (HR 1.75, 95% CI 1.25–2.45, P=.001) and of shorter time to first COPD exacerbation. There was no difference between BEC and FeNO regarding the predictive capacity for moderate to severe exacerbation (AUC 0.584 vs 0.576, P=.183) but FeNO predicted severe episodes more accurately than BEC (AUC 0.607 vs 0.539, P<.05). Combining the two biomarkers enhanced the detection of moderate and severe COPD exacerbations.
ConclusionsBoth eosinophil count and FeNO have limited utility for predicting COPD exacerbations. Combining these T2 biomarkers could enhance the detection of future COPD exacerbations.
Chronic obstructive pulmonary disease (COPD) is the most prevalent and disabling chronic respiratory disease, accounting for large numbers of premature deaths in high, middle and low-income countries.1 The clinical course of COPD is often altered by episodes of symptomatic deterioration known as COPD exacerbations, which frequently require hospital admission and in many cases result in death.2 COPD exacerbations not only increase the risk of mortality, but they also impose a significant burden on patients in terms of the loss of health-related quality of life (HRQoL), reduced physical activity and accelerated lung function decline.3 Due to the gravity of these effects, preventing and reducing COPD exacerbations is a primary goal in clinical guidelines and international recommendations.4,5
COPD is now considered a heterogeneous disease, presenting a wide range of characteristics and pathophysiological mechanisms.6 Although the majority of COPD patients experience a neutrophilic, type 1 (T1) inflammation, among a subgroup of patients type 2 (T2) inflammation is predominant.7 COPD T2 patients usually have an increased blood eosinophil count (BEC),8 a higher level of exhaled nitric oxide (FeNO),9 higher exacerbation rates,10 greater bronchodilator reversibility and an increased prevalence of asthma-like symptoms.11
BEC has gained increased interest as a T2 biomarker in patients with COPD, due to its long-term stability12 and relationship with inhaled corticosteroids (ICs) response in terms of exacerbation reduction.13 Both national and international guidelines recommend including BEC evaluation in patients with COPD.4,5
However, it is not clear if patients with T2 inflammation are at increased risk of exacerbations or whether FeNO adds important information in predicting COPD exacerbations.
In view of these considerations, our study aim is to examine the relationship between T2 biomarkers and COPD exacerbations and to determine the added value in this respect of FeNO in a COPD population.
MethodsStudy DesignIn this prospective, one-year follow-up, observational study, the participants were recruited from the patients attended consecutively at three outpatient tertiary clinics. The precise method employed for this recruitment has been described previously.9 The patients were visited at recruitment (V0) and followed up after six (V1) and twelve months (V2), to determine the incidence of COPD exacerbations.
The main study aims were: (1) to evaluate the risk of moderate to severe COPD exacerbations associated with at least one significant T2 biomarker, either high BEC (defined as ≥300cells/mm3), high FeNO (defined as ≥2 visits with FeNO ≥20ppb) or both; and (2) to determine the value of these T2 biomarkers (FeNO, BEC or both) as predictors of moderate to severe COPD exacerbation during the one-year follow up considered.
Ethical ConsiderationsThe study was conducted in accordance with the provisions of the 1975 Declaration of Helsinki, and was approved by the Ethics Committee of Clinical Research at our Institution (1987-N-16). All participants gave signed informed consent.
Study PopulationThe study participants were all adult (≥40 years of age), current or former smokers with a cumulative smoking exposure ≥10 pack-years, presented COPD according to international diagnostic criteria (5) and were capable of performing lung function tests serially. The exclusion criteria applied were the occurrence of COPD exacerbations during the previous four weeks, previous systemic corticosteroid use during the previous 4 weeks, the presence of chronic respiratory diseases other than COPD, such as current asthma diagnosis, tuberculosis or alpha-1 antitrypsin deficiency, or current participation in any other research study or pulmonary rehabilitation programme.
MeasurementsAt recruitment, data on cumulative smoking exposure, previous medical history, concomitant diseases,14 usual treatment and number and severity of COPD exacerbations in the previous year were collected from the participants’ medical records. BEC values were obtained at baseline (V0). The Spanish version of the COPD Assessment Test (CAT) questionnaire was self-administered.15 A spirometry test was performed, before and after the administration of 400μg of salbutamol, following international recommendations.16FeNO was measured before spirometry on V0 (baseline), V1 and V2 at a constant flow (50mL/s) with a NO analyser (HypAir FeNO ®, Medisoft, Belgium), also following international recommendations.17,18
At each follow-up visit (at six and twelve months after baseline) the participants completed the CAT questionnaire, any moderate or severe COPD exacerbations were recorded and spirometric and FeNO measurements were taken. Moderate exacerbations were defined as those needing oral/systemic corticosteroids or antibiotics and severe exacerbations were defined as those requiring hospital admission or emergency department care for more than 24hours.
Statistical AnalysisThe study results are presented as sample size (n), range, median [interquartile range] or mean±standard deviation, as appropriate. Categorical variables were compared using the χ2 test and continuous variables were compared using ANOVA, Student's t-test or the Mann–Whitney U test, as required. Statistical significance was defined as P<.05. Cox regression analysis was used to compare the time to first moderate or severe COPD exacerbation, after adjusting for age, gender, smoking status, GOLD 2017 grade and ICS use. The sample size was calculated expecting a 80% power to detect a 15% increase in the rate of exacerbations among those with high T2 biomarker with an alpha error of 0.05, assuming 10% drop-out rate during follow up, giving a sample size estimation of 314 patients. The accuracy of BEC and/or FeNO as a predictor of the presence of at least one moderate or severe COPD exacerbation was determined. ROC curves (receiving operator characteristics) were obtained and AUC (area under curve) and Youden's index were calculated for each biomarker. BEC, FeNO and joint BEC/FeNo were compared as predictors of future COPD exacerbations using the DeLong test. All statistical analyses were performed using Jamovi 1.6 software (The Jamovi project, Sydney, Australia).
ResultsFrom March 2016 to January 2018, 412 COPD patients from 3 tertiary hospitals in Spain were assessed consecutively for eligibility, and 322 were finally recruited, 298 being recruited at Hospital de Alta Resolución de Loja. Fig. 1 presents the STROBE diagram of the study.

The participants’ baseline characteristics are detailed in Table 1. In summary, 89% were male and aged in their seventies, and around 25% were current smokers and had a relatively high level of tobacco consumption (46 pack-years). Most presented moderate airflow limitation (FEV1 56%) and were classed as GOLD grade B or D.
Baseline Characteristics of Participants (n=322). Continuous Data Are Shown as Mean±SD or Median [IQR], and Categorical Variables as n (%).
| Age, yrs | 70.7±10.2 |
| Sex, M/F | 287/35 (89.1%/10.1%) |
| Smoking history | |
| Current smoker, n (%) | 90 (28.0%) |
| Pack-yrs | 46.0±17.1 |
| Pulmonary function | |
| FEV1 postBD, % pred | 56.4±17.0 |
| FVC postBD, %pred | 80.2±17.8 |
| Reversibilility, n (%)a | 81 (25.2%) |
| Severity of airflow obstruction | |
| Mild, n (%) | 14 (7.5%) |
| Moderate, n (%) | 182 (56.5%) |
| Severe, n (%) | 93 (28.9%) |
| Very severe, n (%) | 23 (7.1%) |
| GOLD groups | |
| GOLD A | 29 (9.0%) |
| GOLD B | 133 (41.3%) |
| GOLD C | 19 (5.9%) |
| GOLD D | 141 (43.8%) |
| Pharmacological treatment | |
| LAMA/LABA, n (%) | 93 (28.9%) |
| Triple Therapy, n (%) | 130 (40.4%) |
| ICS-containing regimen, n (%) | 190 (59.0%) |
| Comorbidities | |
| COTE index, median (IQR) | 1 (0–3) |
| COTE index ≥4 points, n (%) | 62 (13.2%) |
| Exacerbations, previous yr | |
| Moderate exacerbations | 1.71±1.38 |
| Severe exacerbations | 0.15±0.45 |
| Type 2 biomarkers | |
| High T2 biomarker, at least one n | 129 (42.5%) |
| High T2 biomarker, both n | 16 (5.3%) |
| FeNO | |
| FeNO at V0, ppb | 18.4±13.2 |
| Patients with ≥2 visits with FeNO>20ppb | 90 (28.0%) |
| BEC | |
| Eosinophil count, cells×103/μL | 0.24±0.16 |
| Patients with ≥150 eosinophils, n (%) | 207 (64.3%) |
| Patients with ≥300 eosinophils, n (%) | 68 (22.4%) |
Reversibility is defined by ΔFEV1 ≥12% after inhalation of 400mcgr of salbutamol and ≥200mL. FEV1 postBD: FEV1 postbronchodilator; FVC postBD: FVC post bronchodilator; GOLD: Global Initiative for Obstructive Lung Disease; ICS: inhaled corticosteroids; LAMA: long-acting muscarinic antagonists; LABA: long-acting beta-agonists; COTE: COPD comorbidity index [14]; FeNO: exhaled fraction of nitric oxide; BEC: blood eosinophil count.
Regarding the T2 biomarkers 129 (42.5%) of the participants presented at least one elevated T2 biomarker; 28% had elevated FeNO, 22.4% had elevated BEC and 5.3% had raised both T2 biomarkers. Table 2 shows the participants’ characteristics according to the presence or absence of T2 biomarkers. The T2 biomarker group had similar characteristics to T2 absent group, with a less severe form of the disease in terms of airflow limitation but presented a higher symptom burden in terms of the CAT scores recorded. There were no differences between the groups in terms of FEV1, ICS use or current smoker status.
Characteristics of Patients According to the presence of at Least One Elevated T2 Biomarker. Continuous Data Are Shown as Mean±SD or Median [IQR], and Categorical Variables as n (%).
| High T2 Biomarker | |||
|---|---|---|---|
| Absent (n=174) | Present (n=129) | P-Value | |
| Age, yrs | 70.2±10.7 | 71.2±9.6 | .422 |
| Sex, male | 151 (86.8%) | 119 (92.2%) | .131 |
| Current smoker, n (%) | 47 (27.0%) | 34 (26.4%) | .899 |
| FEV1postBD, % pred | 55.4±18.5 | 57.2±14.8 | .365 |
| CAT score | 18.0±7.9 | 20.3±7.4 | .011 |
| Severity of airflow limitation | .006 | ||
| Mild, n (%) | 16 (9.2%) | 8 (6.2%) | |
| Moderate, n (%) | 85 (48.9%) | 83 (64.3%) | |
| Severe, n (%) | 53 (30.5%) | 35(27.1%) | |
| Very severe, n (%) | 20 (11.5%) | 3 (2.3%) | |
| GOLD 2017 groups | .692 | ||
| GOLD A | 13 (7.5%) | 14 (10.9%) | |
| GOLD B | 72 (41.4%) | 49 (38.0%) | |
| GOLD C | 12 (6.9%) | 7 (5.4%) | |
| GOLD D | 77 (44.3%) | 59 (45.7%) | |
| ICS at baseline, n (%) | 99 (56.9%) | 80 (62.0%) | .370 |
| Exacerbations, prev yr | 1.8±1.4 | 2.0±1.6 | .468 |
The participants with a T2 biomarker present were at an increased risk of moderate or severe exacerbation during the one year follow up period (HR 1.73, 95% confidence interval 1.26–2.38; Log-rank test P=.001), as shown in Fig. 2, and also presented a shorter time to first moderate or severe COPD exacerbation (240 vs. 317 days, P<.05). This was applicable to both ICS-treated and ICS-naïve populations (supplementary Fig. 1). Multivariate analysis indicated that the presence of a T2 biomarker was independently associated with an increased risk of exacerbation, after adjusting for covariates. Fig. 3 shows the hazard regression plot for the participants, according to multivariate analysis. ICs use at baseline and the presence of T2 biomarkers both increased the risk of exacerbation, whereas GOLD B and current smoker status during follow up reduced it.
 to moderate or severe COPD exacerbations, adjusted for age, gender, smoking, ICs and previous exacerbation history, and stratified by high T2 biomarkers. See text for further explanation.")

Regarding the diagnostic accuracy of the two T2 biomarkers, Fig. 4 shows the AUC for high levels of BEC, FeNO or T2 (any), for the prediction of at least one moderate or severe COPD exacerbation (left) or at least one severe COPD exacerbation (right). These biomarkers are compared in Table 3. Overall, the diagnostic accuracy of high BEC, high FeNO or high T2 (any) for predicting moderate and severe COPD exacerbations was similar in every case. However, FeNO increased the diagnostic accuracy for severe COPD exacerbations compared to high BEC, providing a better profile for the combination of both T2 biomarkers (AUC 0.607 vs 0.539 vs 0.608 respectively; De Long test P=.031 for the comparison). This predictive accuracy was increased when patients were divided according to ICS use and smoking history (supplementary Fig. 2), where predictive value in ICS-naïve patients was higher than in ICS-treated patients as well as in former smokers compared to current smokers.
 analysis for different T2 biomarkers detecting at least one moderate or severe COPD exacerbation (left), or at least one severe exacerbation (right).")
Receiver Operator Curves (ROC) Tests and Diagnostic Ability Between Elevated T2 Biomarker, High BEC, High FeNO or BEC for the Prediction of at Least One Moderate or Severe Exacerbation.
| High T2 Biomarker | High BEC | High FeNO | BECa | P-Valueb | |
|---|---|---|---|---|---|
| Moderate or severe COPD exacerbations | |||||
| Sensitivity | 50.71% | 31.43% | 50.71% | 29.29% | .183 |
| Specificity | 64.42% | 85.28% | 64.42% | 93.87% | |
| NPV | 60.34% | 59.15% | 60.34% | 60.71% | |
| PPV | 55.04% | 64.71% | 55.04% | 77.78% | |
| AUC | 0.576 | 0.584 | 0.576 | 0.623 | |
| Youden index | 0.151 | 0.167 | 0.151 | 0.232 | |
| Severe COPD exacerbations | |||||
| Sensitivity | 32.65% | 37.28% | 32.54% | 20.59% | .031 |
| Specificity | 94.16% | 85.13% | 93.76% | 92.19% | |
| NPV | 88.78% | 88.78% | 89.44% | 90.18% | |
| PPV | 31.21% | 23.16% | 33.33% | 29.17% | |
| AUC | 0.608 | 0.539 | 0.607 | 0.511 | |
| Youden index | 0.174 | 0.132 | 0.173 | 0.127 | |
NPV: negative predictive value; PPV: positive predictive value; AUC: area under the curve.
The main result derived from this study is that the presence of the T2 biomarkers considered (FeNO and/or BEC) is associated with an increased risk of moderate or severe exacerbation, and that adding FeNO to BEC in the items included in clinical analysis could increase the predictive ability for COPD exacerbations, especially the severe ones. The AUC for the prediction of at least one severe exacerbation increased from 0.539 to 0.608 when BEC and FeNO were combined.
COPD exacerbation is a severe outcome in the natural history of the disease and therefore predicting the risk of a future moderate or severe exacerbation is crucial to the management of COPD. However, as COPD exacerbations are heterogeneous events, searches for biomarkers have obtained mixed results.19 In the present study, the T2 biomarkers considered were associated with an increased risk of exacerbation, but predicted only a small proportion of events, according to the AUC results obtained. This is not surprising, as the leading cause of COPD exacerbation is thought to be infectious virus-driven episodes.20 However, our results suggest that at least some of these episodes could be linked to elevated T2 responses in the airway, which can be predicted using T2 biomarkers, especially when FeNO and BEC are combined.
Our results are in line with those from previous population-based studies of patients with COPD, according to which BEC is associated with a higher rate of moderate to severe exacerbation21,22 although there are other studies (from randomized controlled trials) haven’t found such effect.23 We concur with research findings by other groups suggesting that FeNO could also be related to an increased risk of exacerbations. There is robust evidence suggesting that BEC is a good biomarker for identifying patients responsive to ICs treatment.24 Indeed, BEC is included in the current guidelines and international recommendations as a biomarker for tailoring ICs in patients with COPD.
In our study, FeNO improved the predictive accuracy for severe COPD exacerbation compared to BEC but had no impact on the predictive accuracy for moderate exacerbation. This suggests that the pathophysiological mechanisms underlying moderate and severe COPD exacerbations could be different, as BEC is an IL-5 dependent biomarker and FeNO is an IL-13 dependent biomarker, which could in line with recently published studies.25
Our study has certain strengths, namely the sample size, the clinical characterisation obtained of the COPD patients and the multicentre study design. Among its limitations is the inclusion of patients attended at tertiary clinics, which means that our results cannot readily be extrapolated to the whole COPD population, and that most of the patients were recruited at a single center. Another limitation is that although the patients included were receiving their usual inhaled treatment, we could not registered changes in inhaled therapies or ICS dose, while about a quarter were current smokers. Either or both of these circumstances could have decreased FeNO levels. Another limitation of the study is that due to study design we could not exclude some bias that could have altered some results as Fig. 3 shows (i.e. patients more prone to exacerbations are recommended to receive ICS and current smokers feeling better could have been more prone to accept their participation in the study). Finally, only one measurement of BEC was obtained, which might have introduced bias into the results if this value changed during follow up.
In summary, our results suggest that consideration of the T2 biomarkers BEC and FeNO could be useful for forecasting COPD exacerbations, and that their combined use provides better predictive accuracy than either one alone.
Take-Home MessagesType 2 (T2) biomarkers such as blood eosinophil count and FeNO are associated with a higher risk of COPD exacerbation and could be useful in predicting this outcome, especially in combination.
FundingSupported by Neumosur Foundation (1/2012).
Conflicts of InterestDr. Alcázar-Navarrete reports grants and personal fees from GSK, grants, personal fees and non-financial support from Novartis AG, personal fees and non-financial support from Boehringer Ingelheim, personal fees and non-financial support from Chiesi, grants, personal fees and non-financial support from Laboratorios Menarini, personal fees from Astra-Zeneca, personal fees from Gilead.
Dr. Diaz Lopez has nothing to disclose.
Dr. Garcia-Flores has nothing to disclose.
Dr. Ortega-Antelo has nothing to disclose.
Dr. Aguilar Cruz has nothing to disclose.
Dr. Ruiz-Rodriguez has nothing to disclose.
Dr. Santiaago Diaz has nothing to disclose.
Dr. Garcia-Flores has nothing to disclose.
Dr. Romero-Palacios reports personal fees and non-financial support from GSK, grants, non-financial support from Novartis AG, non-financial support from Boehringer Ingelheim, non-financial support from Chiesi, grants, personal fees and non-financial support from Laboratorios Menarini, personal fees from Esteve, outside the submitted work.
BAN is responsible for concept & design, Analysis & interpretation of the results, writing the article, data collection and final approval of the article.
JMDL, PGF and MOA are responsible for critical revision of the article and final approval of the article.
ORR is responsible for data collection and final approval of the article.
PSD is responsible for analysis & interpretation of the results and final approval of the article.
PJRP is responsible for concept & design, Analysis & interpretation of the results, writing the article, and final approval of the article.
The following are the supplementary data to this article:


