


Clinical control has been proposed as a composite endpoint in chronic obstructive pulmonary disease (COPD), assessable through the COPD Clinical Control Questionnaire (CCOq). A new score, derived from the CCOq, and termed as RADAR (Rescue medication, Acute exacerbations, Dyspnea, physical Activity, and Risk) has been developed. This study aimed to validate the RADAR score by analyzing its predictive value for future risk and health status.
MethodsA 12-month prospective observational study was conducted in stable COPD patients. Clinical control was assessed at 3 months using both the CCOq and the RADAR score (range 0–8). Dyspnea was evaluated both adjusted and unadjusted for FEV1%. The primary outcome was time to the first composite event (emergency visit, COPD hospitalization, or all-cause mortality); the secondary outcome was the COPD Assessment Test (CAT) score at 12 months.
ResultsOf 265 patients enrolled (16.2% women; mean age: 68±9 years; FEV1%: 58±17), 239 completed the 3-month assessment. Among patients with RADAR scores of 0–1, 96.5% met CCOq control criteria, whereas none with scores ≥4 were classified as controlled. Patients were categorized as good (0–1), partial (2–3), or poor control (≥4). Time to composite event differed significantly across groups (p<0.001), with RADAR remaining an independent predictor after adjustment. Predictive accuracy (C-statistic) was 0.697 (adjusted) and 0.713 (unadjusted).
ConclusionThe RADAR score effectively predicts clinical risk and health status, offering a practical tool for monitoring COPD and guiding clinical decisions.
According to the global burden of disease, more than 390 million people worldwide suffer from chronic obstructive pulmonary disease (COPD).1 Beyond its high prevalence, COPD is associated with significant morbidity and mortality, currently ranking as the 5th leading cause of disability and the 3rd leading cause of death globally.1 To mitigate these consequences, clinical practice guidelines establish a series of therapeutic goals. In the short term, these aim to reduce the clinical impact of the disease by alleviating symptoms, improve exercise tolerance, and enhance health status. In the medium-to-long term, they focus on reducing the risk of complications, including future exacerbations, disease progression, and mortality.2,3
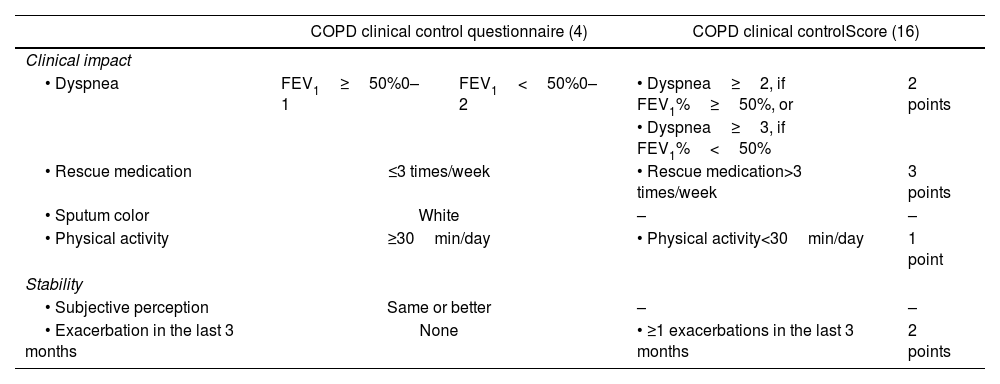
Although each of these objectives can be independently evaluated, clinical follow-up requires a practical tool that integrates these dimensions into a composite endpoint, facilitating patient monitoring. In this context, the COPD clinical control questionnaire (CCOq) has been developed.4 This tool includes six items under two domains: impact (cross-sectional assessment) and stability (longitudinal assessment) (Table 1). A patient is considered clinically controlled if both stability criteria are met and at least three out of the four impact criteria are fulfilled. The CCOq has been validated in multiple national and international studies, demonstrating its association with health status and predictive capacity for complications, both in the short and long term. Additionally, the tool has shown sensitivity to change,4–14 leading the Spanish COPD Guidelines (GesEPOC) to recommend its use for patient follow-up.2
COPD clinical control questionnaire (CCQ) and COPD clinical control score (CCS) criteria.
| COPD clinical control questionnaire (4) | COPD clinical controlScore (16) | |||
|---|---|---|---|---|
| Clinical impact | ||||
| • Dyspnea | FEV1≥50%0–1 | FEV1<50%0–2 | • Dyspnea≥2, if FEV1%≥50%, or | 2 points |
| • Dyspnea≥3, if FEV1%<50% | ||||
| • Rescue medication | ≤3 times/week | • Rescue medication>3 times/week | 3 points | |
| • Sputum color | White | – | – | |
| • Physical activity | ≥30min/day | • Physical activity<30min/day | 1 point | |
| Stability | ||||
| • Subjective perception | Same or better | – | – | |
| • Exacerbation in the last 3 months | None | • ≥1 exacerbations in the last 3 months | 2 points | |
Despite the scientific evidence supporting the assessment of clinical control in COPD follow-up, it is not frequently implemented in routine clinical practice. The EPOCONSUL audit, conducted in 2021 in pulmonology clinics, revealed that the degree of clinical control in COPD was assessed and documented in only one-quarter of the audited visits.15
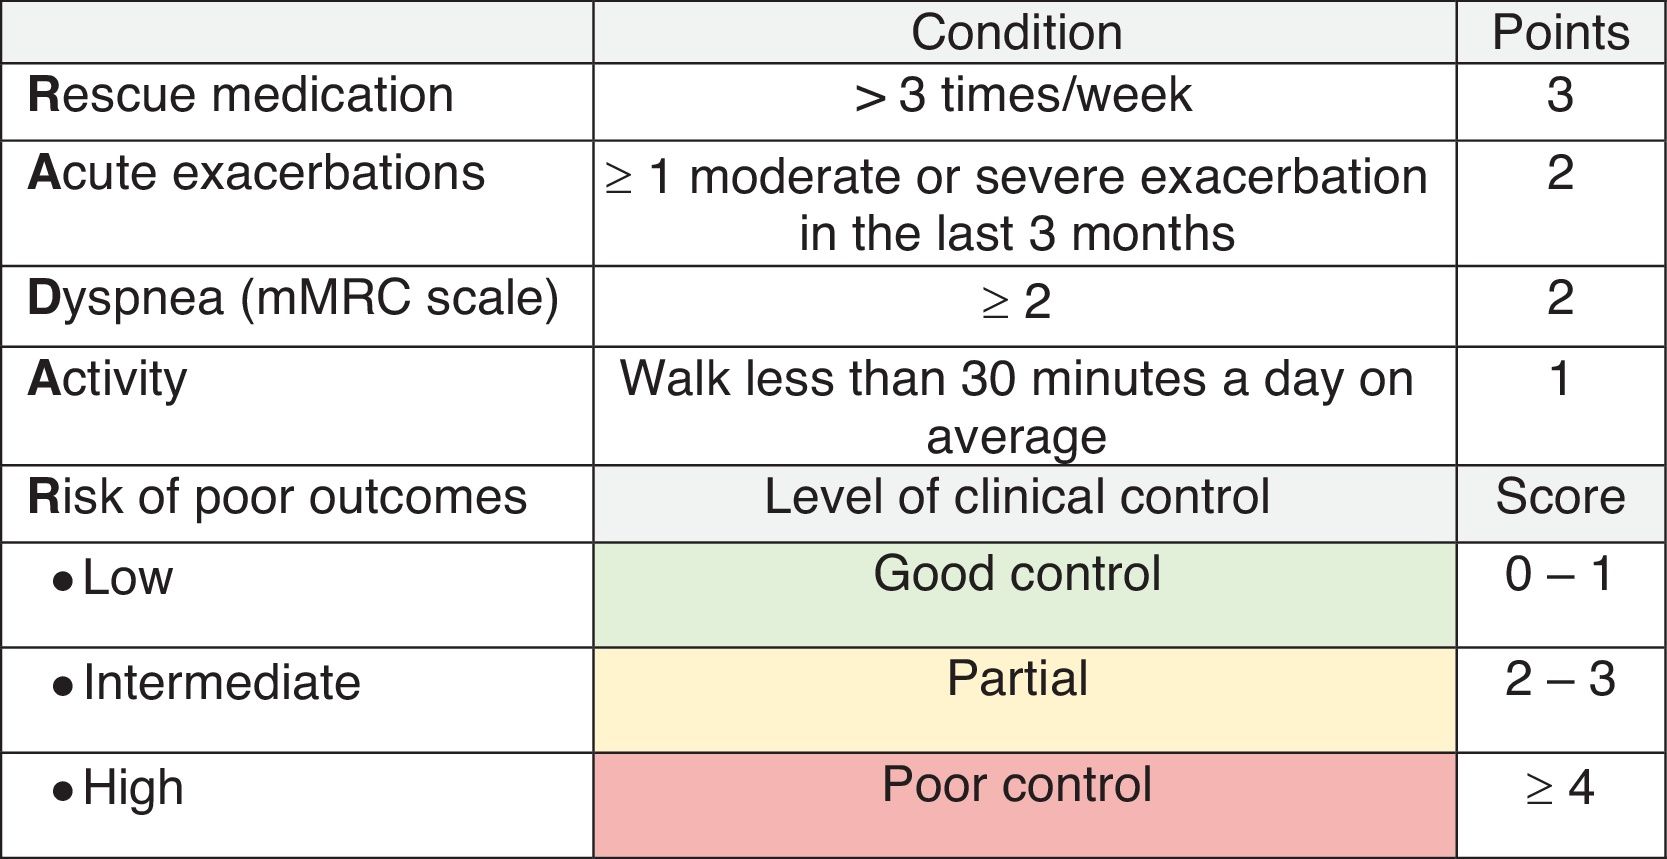
In an effort to simplify the CCOq and facilitate its use, Calle et al.16 recently developed a new quantitative score derived from the CCOq. This new score includes only four of the original CCOq criteria and establishes a scoring range from 0 to 8 points (Table 1). The score was developed based on data from a cross-sectional, retrospective clinical audit conducted in Spain, where the control status, as estimated and reported by the specialist performing the medical visit, was considered the gold-standard reference.16 However, it remains unknown whether this new score can predict key long-term clinical outcomes.
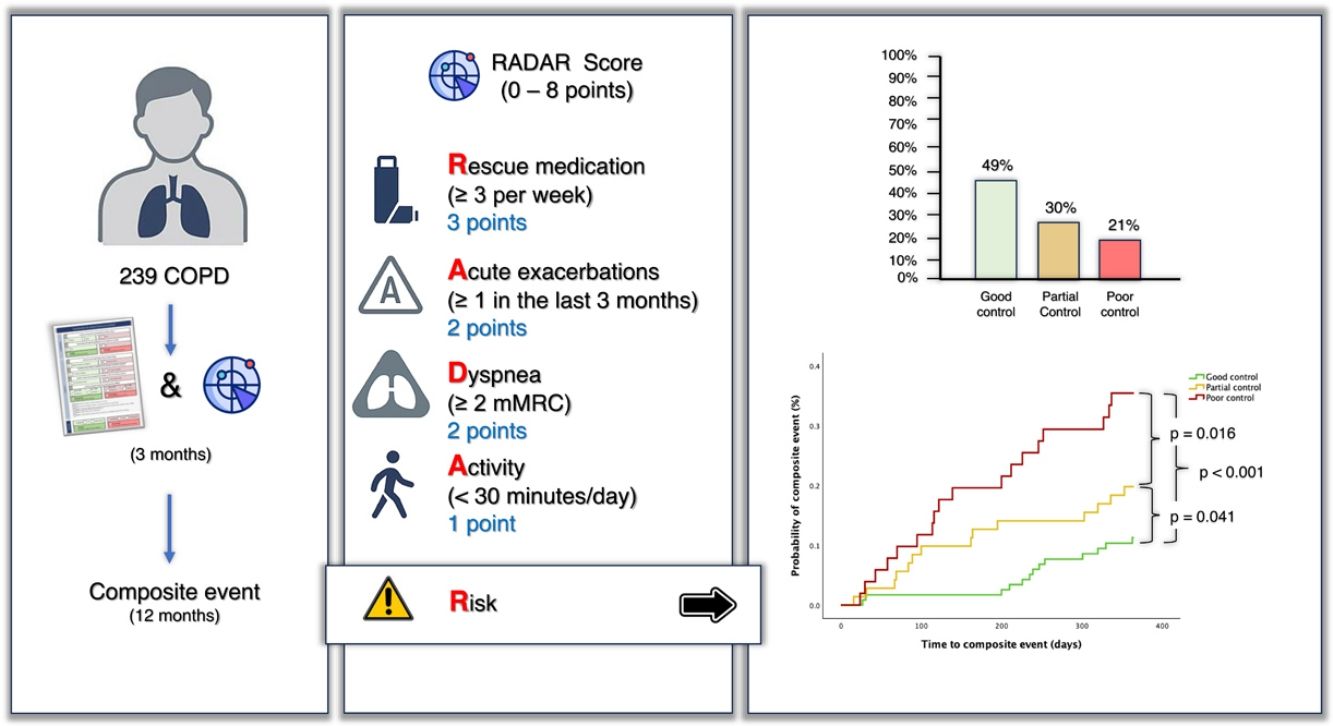
The aim of this study is to validate this new quantitative COPD clinical control score (CCOs) by analyzing its predictive capacity for risk and health status. We propose the acronym “RADAR” score to refer CCOs, as it assesses risk based on the use of Rescue medication, Acute exacerbations, Dyspnea severity, and physical Activity.
MethodsThis is a post hoc analysis of a previously published study aimed at developing and validating the current CCOq criteria.4 Briefly, this was a prospective observational study with a 12-month longitudinal follow-up, involving patients with stable COPD monitored in a specialized outpatient clinic. Patients aged 40 years or older with a diagnosis of COPD were included, defined by a smoking history of ≥10 pack-years, the presence of persistent respiratory symptoms (cough, sputum production or dyspnea), and a post-bronchodilator ratio of forced expiratory volume in the first second (FEV1) to forced vital capacity (FVC)<0.7. Exclusion criteria included active malignancy, inability to complete follow-up, participation in other clinical trials, and an exacerbation within the previous two weeks.
The study was conducted in accordance with the Declaration of Helsinki and was approved by the Ethics and Clinical Research Committee of Hospital Arnau de Vilanova in Valencia, Spain. All patients provided written informed consent.
COPD clinical control questionnaireClinical control was defined as the “long-term maintenance of a situation of low clinical impact,” including two evaluative dimensions: clinical impact and stability. To assess clinical impact, the degree of dyspnea was measured using the modified Medical Research Council (mMRC) scale,17 along with the use of rescue medication in the past week, sputum color, and self-reported physical activity level. Notably, in this questionnaire, the weighting of dyspnea was adjusted depending on whether the FEV1% was above or below 50% (Table 1). Stability was defined as the absence of exacerbations in the past 3 months and no clinical worsening since the last medical visit. A patient is considered clinically controlled if both stability criteria are met and at least three out of the four impact criteria are fulfilled.4
All cases were evaluated during at inclusion, at 3 months, and at 12 months of follow-up. CCOq was assessed at 3 months after study initiation.
RADAR scoreAt 3 months, the RADAR score was applied according to the criteria of Calle et al.15 (Table 1). Three points were assigned for the use of rescue medication more than 3 times per week, two points for experiencing at least one acute exacerbation in the past three months, two points for high level of dyspnea, and one point for walking less than 30min per day on average. Dyspnea was assessed in two alternative ways. In the first approach, dyspnea was adjusted for FEV1% based on the original CCOq criteria.4 Specifically, if the patient had an FEV1≥50% and dyspnea≥2, two points were assigned in the RADAR score. Conversely, if the patient had a baseline FEV1%<50%, the 2 points in the CCOs were assigned only if the dyspnea was rated as grade 3 or higher on the mMRC scale. In the second approach, two points were assigned when dyspnea was ≥2, regardless of baseline FEV1%. The RADAR score ranged from 0 to 8 points.
Predictive capacity of the RADAR scoreTo assess the predictive capacity of the new score, we evaluated its ability to predict clinical outcomes. The main variable analyzed was the time to the first composite event, defined by the occurrence of any of the following outcomes: visit to the emergency department due to COPD exacerbation, hospitalization related to COPD exacerbation, or all-cause mortality. The specific cause of mortality was not recorded. COPD exacerbation was defined as any worsening of respiratory symptoms requiring the use of antibiotics, systemic corticosteroids, or a visit to the emergency department or hospitalization. The impact on health-related quality of life (HRQoL) was assessed using the COPD Assessment Test (CAT) questionnaire.18 Other potential risk factors as clinical phenotype, smoking history, comorbidity, blood eosinophils, BODEx (Body mass index, obstruction, dyspnea and exacerbations) index or baseline treatment was also assessed. Changes in treatment were made at the discretion of the attending physician and were not recorded.
Statistical analysisQuantitative variables were expressed as the mean±standard deviation (SD), while qualitative variables were presented as frequencies and proportions. The frequency of each score in the quantitative scale was analyzed within the sample, comparing its distribution based on the presence or absence of control as defined by the qualitative CCOq. Patients were categorized into three groups according to the following relationship between RADAR score and CCOq: (1) Good control: RADAR scores where more than 95% of patients meet the control criteria according to the CCOq; (2) Poor control: RADAR scores in which more than 95% of patients meet the non-control criteria according to the CCOq; and (3) Partial control: cases did not meet the previous criteria. Analysis of variance (ANOVA) was performed to compare means between groups, and proportions were compared using the Chi-squared test. Pearson's correlation coefficient was used to analyze the association between the RADAR score and CAT, FEV1, or the BODEx (Body mass index, obstruction, Dyspnea and Exacerbation) index.19
To evaluate the predictive capacity for the occurrence of a composite event within the 12-month follow-up period, a Cox survival analysis was performed, and the corresponding Hazard Ratio (HR) was calculated. The Kaplan–Meier method was used to obtain survival curves. This analysis was repeated for both, the CCOs with dyspnea adjusted for FEV1% and the unadjusted dyspnea CCOs. The C-statistic (C) was calculated to compare the predictive capacity of risk between the FEV1%-adjusted CCOs and the unadjusted CCOs. As mentioned before, it was a post hoc analysis. Sample size was 265 patients according to original study.4 Statistical significance was defined as a p-value<0.05. All analyses were conducted using SPSS software version 29.0 (IBM Analytics, Aerkomm, NY, USA).
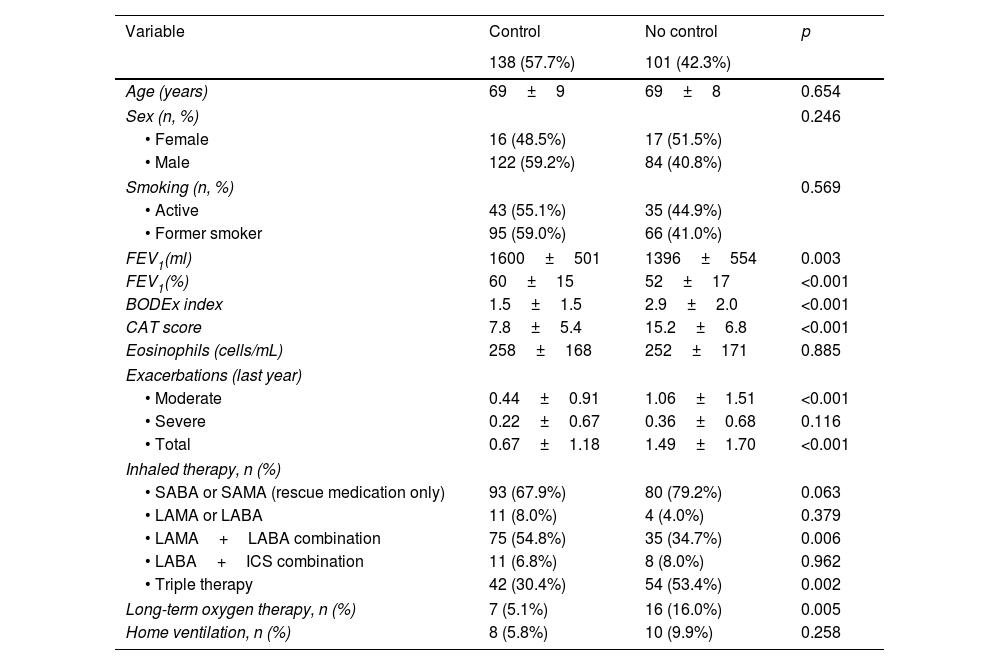
ResultsA total of 265 patients were initially selected (16.2% women and 83.8% men), with a mean age of 68±9 years and an average FEV1% of 58±17%. After three months, the CCOq and RADAR criteria could be assessed in 239 cases, which were ultimately included in the present study. Twenty-six (9.8%) cases were excluded due to incomplete initial follow-up or lack of CAT data (Fig. 1). A total of 138 (57.8%) patients met the COPD clinical control criteria according to the original CCQ questionnaire. Table 2 summarizes the baseline characteristics of these patients.

Baseline characteristics of the three groups according to the COPD Clinical Control Questionnaire.
| Variable | Control | No control | p |
|---|---|---|---|
| 138 (57.7%) | 101 (42.3%) | ||
| Age (years) | 69±9 | 69±8 | 0.654 |
| Sex (n, %) | 0.246 | ||
| • Female | 16 (48.5%) | 17 (51.5%) | |
| • Male | 122 (59.2%) | 84 (40.8%) | |
| Smoking (n, %) | 0.569 | ||
| • Active | 43 (55.1%) | 35 (44.9%) | |
| • Former smoker | 95 (59.0%) | 66 (41.0%) | |
| FEV1(ml) | 1600±501 | 1396±554 | 0.003 |
| FEV1(%) | 60±15 | 52±17 | <0.001 |
| BODEx index | 1.5±1.5 | 2.9±2.0 | <0.001 |
| CAT score | 7.8±5.4 | 15.2±6.8 | <0.001 |
| Eosinophils (cells/mL) | 258±168 | 252±171 | 0.885 |
| Exacerbations (last year) | |||
| • Moderate | 0.44±0.91 | 1.06±1.51 | <0.001 |
| • Severe | 0.22±0.67 | 0.36±0.68 | 0.116 |
| • Total | 0.67±1.18 | 1.49±1.70 | <0.001 |
| Inhaled therapy, n (%) | |||
| • SABA or SAMA (rescue medication only) | 93 (67.9%) | 80 (79.2%) | 0.063 |
| • LAMA or LABA | 11 (8.0%) | 4 (4.0%) | 0.379 |
| • LAMA+LABA combination | 75 (54.8%) | 35 (34.7%) | 0.006 |
| • LABA+ICS combination | 11 (6.8%) | 8 (8.0%) | 0.962 |
| • Triple therapy | 42 (30.4%) | 54 (53.4%) | 0.002 |
| Long-term oxygen therapy, n (%) | 7 (5.1%) | 16 (16.0%) | 0.005 |
| Home ventilation, n (%) | 8 (5.8%) | 10 (9.9%) | 0.258 |
Fig. 2A illustrates the distribution of the new score (0–8 points) according to the qualitative CCOq classification (control/no control). One hundred and thirteen out of 117 (96.5%) patients with a score of 0–1 did meet the control criteria according to the original CCOq, where dyspnea severity is adjusted for FEV1%. Conversely, no patient with a score ≥4 points on the new RADAR score was classified as controlled according to the CCOq. Based on these results, patients were reclassified into three groups: good control (0–1 points), partial control (2–3 points), and poor control (≥4 points). The majority of cases were classified within the good control group (49%), followed by the partial control (29.7%) and the uncontrolled group (21.3%). The total RADAR score strongly correlated with the CAT score at visit 2 (r=0.64, p<0.001), or BODEx index (r=0.50, p<0.001) and showed moderate correlation with FEV1% (r=−0.33, p<0.001).
 FEV1%-adjusted RADAR score; (B) unadjusted RADAR score.")
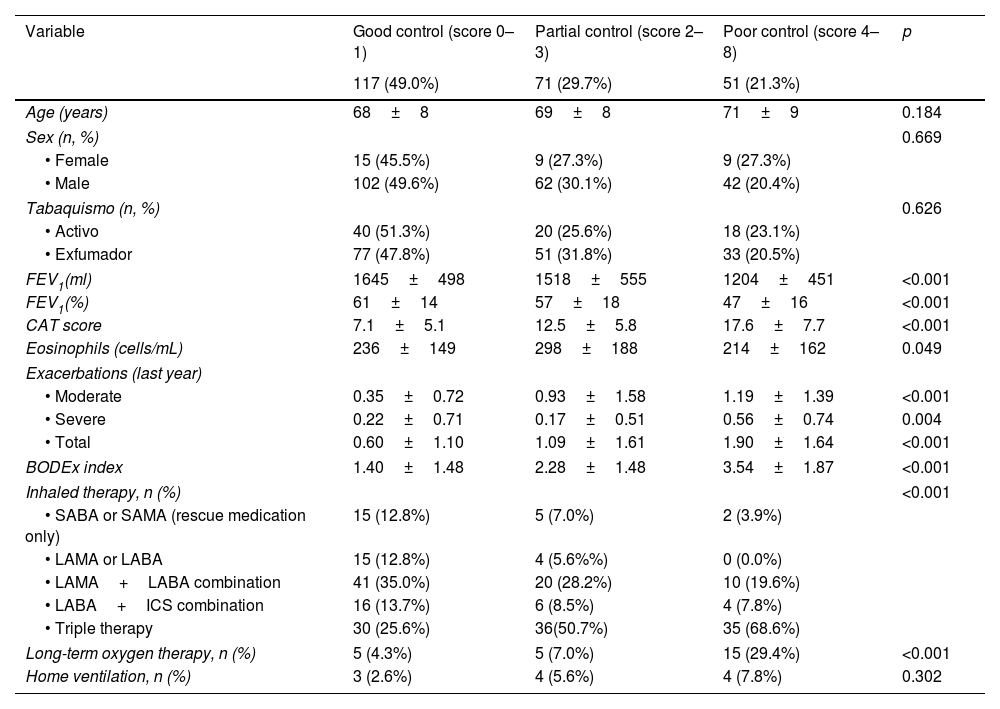
Table 3 summarizes the baseline characteristics of the three groups. Uncontrolled patients exhibited lower FEV1%, higher CAT scores, greater number of exacerbations, higher BODEx index and lower peripheral blood eosinophil counts compared to those with good control. Poor control group also required more treatment. The partial control group showed intermediate values.
Baseline characteristics of the three groups according to the adjusted CCS.
| Variable | Good control (score 0–1) | Partial control (score 2–3) | Poor control (score 4–8) | p |
|---|---|---|---|---|
| 117 (49.0%) | 71 (29.7%) | 51 (21.3%) | ||
| Age (years) | 68±8 | 69±8 | 71±9 | 0.184 |
| Sex (n, %) | 0.669 | |||
| • Female | 15 (45.5%) | 9 (27.3%) | 9 (27.3%) | |
| • Male | 102 (49.6%) | 62 (30.1%) | 42 (20.4%) | |
| Tabaquismo (n, %) | 0.626 | |||
| • Activo | 40 (51.3%) | 20 (25.6%) | 18 (23.1%) | |
| • Exfumador | 77 (47.8%) | 51 (31.8%) | 33 (20.5%) | |
| FEV1(ml) | 1645±498 | 1518±555 | 1204±451 | <0.001 |
| FEV1(%) | 61±14 | 57±18 | 47±16 | <0.001 |
| CAT score | 7.1±5.1 | 12.5±5.8 | 17.6±7.7 | <0.001 |
| Eosinophils (cells/mL) | 236±149 | 298±188 | 214±162 | 0.049 |
| Exacerbations (last year) | ||||
| • Moderate | 0.35±0.72 | 0.93±1.58 | 1.19±1.39 | <0.001 |
| • Severe | 0.22±0.71 | 0.17±0.51 | 0.56±0.74 | 0.004 |
| • Total | 0.60±1.10 | 1.09±1.61 | 1.90±1.64 | <0.001 |
| BODEx index | 1.40±1.48 | 2.28±1.48 | 3.54±1.87 | <0.001 |
| Inhaled therapy, n (%) | <0.001 | |||
| • SABA or SAMA (rescue medication only) | 15 (12.8%) | 5 (7.0%) | 2 (3.9%) | |
| • LAMA or LABA | 15 (12.8%) | 4 (5.6%%) | 0 (0.0%) | |
| • LAMA+LABA combination | 41 (35.0%) | 20 (28.2%) | 10 (19.6%) | |
| • LABA+ICS combination | 16 (13.7%) | 6 (8.5%) | 4 (7.8%) | |
| • Triple therapy | 30 (25.6%) | 36(50.7%) | 35 (68.6%) | |
| Long-term oxygen therapy, n (%) | 5 (4.3%) | 5 (7.0%) | 15 (29.4%) | <0.001 |
| Home ventilation, n (%) | 3 (2.6%) | 4 (5.6%) | 4 (7.8%) | 0.302 |
SABA: short-acting beta2-agonist; SAMA: short-acting antimuscarinic; LAMA: long-acting antimuscarinic; LABA: long-acting beta2-agonist; ICS: inhaled corticosteroids.
When applying the RADAR score without adjusting dyspnea for FEV1%, the distribution of points according to CCOq-defined control status remained similar to that of the FEV1%-adjusted CCS. However, the proportion of patients classified as having good control was lower in unadjusted RADAR score (43.9% vs 49%), with 32.2% categorized as partially controlled and 23.8% as uncontrolled (Fig. 2B). As previously observed, four out of 105 patients with a RADAR of 0–1 would have been classified as uncontrolled according to the original CCOq. Conversely, only one patient among the 51 classified as uncontrolled by the CCOq met the control criteria based on the RADAR score. The unadjusted RADAR total score strongly correlated with the CAT score at visit 2 (r=0.65, p<0.001), or BODEx index (r=0.56, p<0.001) and moderately correlated with FEV1% (r=−0.40, p<0.001).
Predictive capacity of composite event at 12 monthsThe time to the composite event differed significantly among the three groups classified by the FEV1%-adjusted RADAR score, with an increasing risk as RADAR worsened (p<0.001) (Fig. 3A). The probability of experiencing at least one composite event within 12 months, according to the FEV1%-adjusted RADAR, was 11% for patients with total control, 20% for those with partial control, and 35% for the poorly controlled group. Similarly, in cases classified using the unadjusted RADAR, the 12-month probability of a composite event was 9% for patients with total control, 21% for those with partial control, and 35% for the poorly controlled group (Fig. 3B). The correlation between both RADAR scores, FEV1%-adjusted model and unadjusted, was very high (Rs=.0.94, p<0.001). The C-statistic for predictive risk capacity was 0.697 for the FEV1%-adjusted model and 0.713 for the unadjusted score.
 FEV1%-adjusted RADAR score; (B) unadjusted RADAR score.")
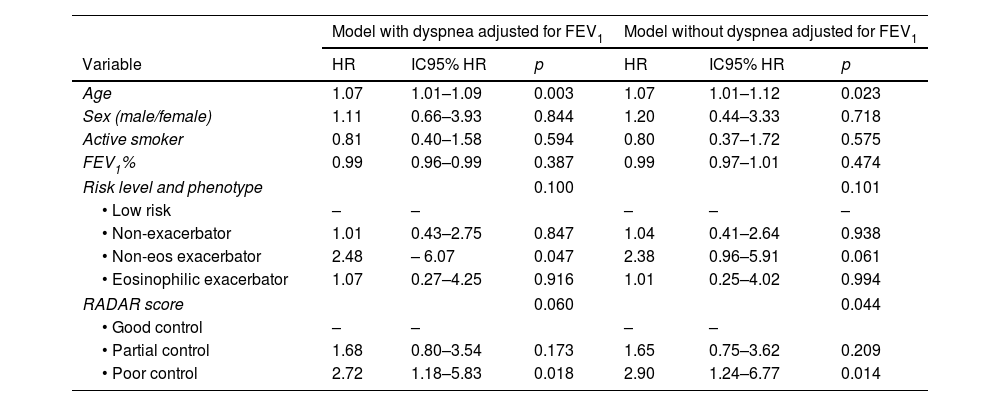
After adjusting the model for age, sex, smoking status, FEV1%, risk stratification level and clinical phenotype according to GesEPOC, the RADAR score remained an independent predictor of risk in the FEV1%-unadjusted model (p=0.044) and nearly reached significance in the FEV1%-adjusted model (p=0.060) (Table 4).
Predictive Capacity of Risk of the COPD Clinical Control Score: Multivariate Analysis.
| Model with dyspnea adjusted for FEV1 | Model without dyspnea adjusted for FEV1 | |||||
|---|---|---|---|---|---|---|
| Variable | HR | IC95% HR | p | HR | IC95% HR | p |
| Age | 1.07 | 1.01–1.09 | 0.003 | 1.07 | 1.01–1.12 | 0.023 |
| Sex (male/female) | 1.11 | 0.66–3.93 | 0.844 | 1.20 | 0.44–3.33 | 0.718 |
| Active smoker | 0.81 | 0.40–1.58 | 0.594 | 0.80 | 0.37–1.72 | 0.575 |
| FEV1% | 0.99 | 0.96–0.99 | 0.387 | 0.99 | 0.97–1.01 | 0.474 |
| Risk level and phenotype | 0.100 | 0.101 | ||||
| • Low risk | – | – | – | – | – | |
| • Non-exacerbator | 1.01 | 0.43–2.75 | 0.847 | 1.04 | 0.41–2.64 | 0.938 |
| • Non-eos exacerbator | 2.48 | – 6.07 | 0.047 | 2.38 | 0.96–5.91 | 0.061 |
| • Eosinophilic exacerbator | 1.07 | 0.27–4.25 | 0.916 | 1.01 | 0.25–4.02 | 0.994 |
| RADAR score | 0.060 | 0.044 | ||||
| • Good control | – | – | – | – | ||
| • Partial control | 1.68 | 0.80–3.54 | 0.173 | 1.65 | 0.75–3.62 | 0.209 |
| • Poor control | 2.72 | 1.18–5.83 | 0.018 | 2.90 | 1.24–6.77 | 0.014 |
Using the FEV1%-adjusted RADAR, the mean CAT score at 12 months was 5.5±4.1 for patients with good control, 9.6±5.6 for those with partial control, and 14.5±7.8 in the presence of poor control, with significant overall and between-group differences (p<0.001).
Among cases classified using RADAR without dyspnea adjustment for FEV1%, the final CAT score at 12 months was 5.1±3.9 in patients with complete control, 9.4±5.4 in those with partial control, and 14.3±7.6 in those with poor control, also showing significant overall and intergroup differences (p<0.001).
DiscussionOur findings indicate that the quantitative Clinical Control Score, term as RADAR, is a valuable tool for predicting risk and health status in patients with COPD. Control can be categorized into three levels—good, partial, and poor control—whereby lower RADAR scores (i.e., better clinical control) are associated with a more favorable COPD prognosis, and conversely, higher scores indicate a worse clinical trajectory.
Patients classified as having poor control, defined by a RADAR of ≥4 points, exhibited a threefold increase in the risk of the composite event (HR: 2.96, 95% CI: 1.49–5.84) and significantly worse HRQoL at 12 months (CAT score: 14.5±7.8 vs. 5.5±4.1, p<0.001) compared to those with good control (CCS score 0–1). Likewise, patients with partial control demonstrated a twofold increase in risk (HR: 2.18, 95% CI: 1.13–4.18), with intermediate CAT scores relative to those with good control. These results suggest that the clinical control, in its simplified and weighted form, may serve as a reliable composite endpoint for clinical assessment in COPD.
Traditionally, the primary outcomes in COPD have focused on symptom burden, HRQoL, lung function, exacerbations, and mortality. However, there is an increasing need for novel assessment tools, particularly composite endpoints, that more accurately reflect disease progression and patient outcomes.20 The CCOq was developed as a simple and dynamic tool designed to comprehensively evaluate multiple dimensions of COPD. It comprises clinically relevant, easily assessable items that facilitate the assessment of disease impact at a specific time point while also capturing longitudinal changes over time.
The CCOq has been validated in multiple national and international studies, demonstrating its prognostic value in predicting future exacerbations, hospitalizations, and mortality.4,5,7,9–14 Additionally, it has been shown to correlate with changes in health status and exhibit high sensitivity to clinical variations,5 underscoring its utility as a reliable tool for patient monitoring and disease management. Other initiatives have tried to develop prognostic tools to be used in clinical practice. Recently, a group of experts propose the term stability to define the same concept, i.e. to remain in the best clinical status possible.21 However, the term stability has only a time-dependent implication, which means lack of significant change, but it does not imply an adequate clinical status. In other words, the patients may be “stable” in a very poor clinical situation. For this reason, we prefer the term “control” because it is more intuitive and includes a longitudinal evaluation: stability, and a cross-sectional evaluation: impact. Therefore, control is defined as the persistence (stability) of the best clinical status (low impact).4,6 Moreover, the EPOCONSUL study demonstrated that the term “control” is used spontaneously by respiratory physicians in the clinical records of their COPD patients to describe the evolution of their patients in more than 40% of visits.15
Our findings indicate that the weighted questionnaire preserves the predictive capacity of the original CCOq for both risk assessment and its association with future HRQoL, while offering additional advantages: (1) Enhanced sensitivity to disease progression – The weighted scoring system improves the quantification of clinical status, allowing for better tracking of longitudinal changes. This facilitates disease monitoring and optimizes the interpretation of treatment responses; (2) Refined risk stratification – By introducing three control categories (good, partial, and poor), the weighted CCOs enables a more granular therapeutic approach. Unlike the original CCOq, which dichotomizes patients into controlled and uncontrolled, the RADAR incorporates an intermediate category—partial control—which may serve as an early indicator for clinicians to implement timely corrective interventions; and (3) Severity grading – The 0–8 point weighting system provides an additional measure of disease severity, which correlates with overall disease burden. Specifically, the proposed scoring system exhibits a strong correlation with CAT scores and a more modest association with FEV1%. These results suggest that the weighted RADAR may serve as a valuable tool for risk stratification, disease monitoring, and therapeutic decision-making in COPD management.
The original CCOq adjusts the assessment of dyspnea impact based on the severity of bronchial obstruction.4 In the proposed model of the score by Calle M et al.,16 this adjustment is maintained, assigning 2 points when dyspnea is ≥2 if FEV1%≥50%, or when dyspnea is ≥3 if FEV1%<50%. Our results demonstrate that when the adjustment for FEV1% is not applied and 2 points are assigned when dyspnea is ≥2 on the mMRC scale, the predictive capacity for risk is not only maintained but even improves. In fact, the C-statistic of the unadjusted CCOs is slightly higher (0.713 vs 0.697). In light of these findings, and to facilitate its implementation and use, we propose the use of the unadjusted version (Table 5).
The present study was conducted in a single-center setting within a specialized COPD clinic, which may limit the generalizability of the results. Therefore, external validation through multicenter studies across diverse healthcare settings is necessary. However, our series includes patients with varying levels of disease severity, clinical phenotypes, and treatment regimens, which introduces variability that supports the generalizability of the preliminary findings. This initial phase of internal validation nevertheless represents a methodologically necessary step in the overall process of developing and definitively validating the questionnaire. Additionally, given its potential utility for patient monitoring, further research is required to evaluate its responsiveness to different therapeutic interventions and to establish the clinically meaningful change threshold.
While the original CCOq has demonstrated reproducibility in national and international multicenter studies, as well as sensitivity to change in various studies,4,5,7,9–14 and the RADAR score is consistent with the CCOq, new studies are needed to confirm its validity and clinical applicability.
ConclusionsThe RADAR score for assessing clinical control in patients with COPD is a simple and useful tool for monitoring the clinical course of the disease. This scoring system identifies the future risk of complications and their impact on health status, facilitating the interpretation of longitudinal changes. Therefore, it may be highly valuable for clinical decision-making.
Author contributionJJSC participated in the conceptualization and design of the study, patient recruitment, data analysis, and manuscript writing. MVG contributed to data analysis and manuscript writing. PCS was involved in the study design, patient recruitment, and manuscript review. MCR contributed to the study conceptualization and manuscript review. BAN participated in the conceptualization, study design, and manuscript review. MM contributed to the conceptualization, design, review, and writing of the manuscript.
Artificial intelligence involvementNo artificial intelligence was used at any stage of this study.
FundingThis study has not received any funding.
Conflict of interestJJSC has received speaker fees from AstraZeneca, Bial, Boehringer Ingelheim, Chiesi, FAES, GlaxoSmithKline, Grifols, Menarini and Sanofi, and consulting fees from AstraZeneca, Bial, Chiesi, GSK, Grifols and Sanofi, and grants from GSK. MCR has received speaker fees from AstraZeneca, Bial, Chiesi, CSL Behring,GlaxoSmithKline, Menarini, Sanofi and Grifols, and consulting fees from GlaxoSmithKline, Sanofi, Grifols and Bial. MM has received speaker fees from AstraZeneca, Boehringer Ingelheim, Chiesi,Cipla, GlaxoSmithKline, Menarini, Kamada, Takeda, Zambon, CSL Behring, Specialty Therapeutics, Janssen, Grifols and Novartis, consulting fees from AstraZeneca, Atriva Therapeutics, Boehringer Ingelheim, Chiesi, GlaxoSmithKline, CSL Behring, Inhibrx, Ferrer, Menarini, Mereo Biopharma, Spin Therapeutics, Specialty Therapeutics, ONO Pharma, Palobiofarma SL, Takeda, Novartis, Novo Nordisk, Sanofi, Zambon and Grifols and research grants from Grifols. BAN reports grants and personal fees from GSK, personal fees and non-financial support from Boehringer Ingelheim, Chiesi, non-financial support from Laboratorios Menarini, grants, personal fees and non-financial support from AstraZeneca, personal fees from Gilead, personal fees and non-financial support from MSD, personal fees from Laboratorios BIAL, personal fees from Zambon, outside the submitted work. PCS has received speaker fees from AstraZeneca and GlaxoSmithKline, MVG declare non conflict of interest.


