

Maximal respiratory pressures are key indicators of respiratory muscle strength; however, reference equations and cut-offs to define respiratory muscle weakness are scarce in the European paediatric population. The aim was to create sex-specific reference equations for maximal inspiratory and expiratory pressures (PImax/PEmax) in a large sample of healthy children and to objectively establish cut-offs to define respiratory muscle weakness.
MethodsA multicentre cross-sectional study was conducted across 14 Spanish centres. Healthy children aged 6–18 years, stratified by sex and age, were recruited. Maximal respiratory pressures were measured following standardized methodology in accordance with international guidelines. Reference equations were developed through multiple linear regression analyses. Age- and sex specific cut-offs for respiratory muscle weakness were determined using Z-scores≥1.645 standard deviation (SD) below group means.
ResultsThe final sample included 513 subjects (257 boys; 11.5 [SD3.5] years). Reference equations are: (1) PImax: boys=−41.41+10.21*age+6.26*body mass index (BMI)−0.37*age*BMI; girls=125.96–0.34*age−0.41*age2−5.75*BMI+0.63*age*BMI; (2) PEmax: boys=20.93+5.23*age+2.93*BMI; girls=−12.67+11.98*age−0.39*age2+2.57*BMI. Cut-offs for respiratory muscle weakness are higher in boys and increase with age (p<.001). Depending on age, PImax cut-offs range from 46 to 85cmH2O in boys and from 45 to 68cmH2O in girls, while PEmax cut-offs span 54–98cmH2O in boys and 57–85cmH2O in girls.
ConclusionsThis study provides new reference equations for PImax and PEmax derived from the largest dataset of normative values in European children and adolescents. It also establishes age-specific cut-offs to define respiratory muscle weakness. These findings will facilitate the identification of respiratory muscle weakness and the selection of candidates for targeted training programmes.

In recent decades, the prevalence of paediatric pathologies such as chronic lung diseases [1] and obesity [2] has risen, along with earlier diagnoses of neuromuscular disorders [3]. These conditions are associated with respiratory muscle dysfunction, which can impair ventilation, gas exchange and airway clearance [4]. Reduced respiratory muscle strength may also lead to early-onset exertional dyspnoea, limiting exercise capacity and collectively diminishing quality of life [4]. Therefore, early detection of respiratory muscle weakness is essential for optimizing clinical management, enabling timely intervention and improving prognostic accuracy [4].
Maximal inspiratory and expiratory pressures (PImax/PEmax) are commonly used in clinical practice to assess respiratory muscle strength in children [5]. Although feasible from early ages, test accuracy improves with increasing maturity [5]. A correct interpretation of these measurements requires reference equations to determine whether values fall within normal ranges. While approximately 50 reference equations have been proposed globally for adults, based on a sample of around 10,000 individuals [6], only about 30 are available for children, derived from roughly 4000 subjects [5]. In Europe, just three studies [7–9], all over two decades old, have created reference equations for both PImax and PEmax. Another study [10], published more than ten years ago, focuses solely on PImax equations. Altogether, these studies included approximately 1200 individuals aged 6–17 years [7–10]. In Spain, the only available reference equations are those by Domènech-Clar et al. [7], developed in 2003 using a sample of 396 children aged 8–17 years from Valencia. However, a recent study by our research group found that these equations no longer accurately reflect the current Spanish paediatric population [11]. Additionally, their PEmax equation for girls is unreliable due to non-normally distributed residuals [7].
Significant variability in the prevalence of respiratory muscle weakness arises from differences among PImax/PEmax equations, influenced by methodological heterogeneity, ethnic diversity and age-range discrepancies [5]. Furthermore, many existing equations are outdated [7–10,12–16], despite the European Respiratory Society (ERS) recommends updating lung function reference values every ten years [17]. These points underscore the urgent need for standardized and contemporary reference values tailored to children, to enhance diagnostic accuracy and clinical decision-making.
Furthermore, the lack of established cut-offs to define respiratory muscle weakness in European paediatric population complicates the diagnosis of this condition. In pulmonary function testing, Z-scores≥1.645 standard deviations (SD) below age and sex-specific averages are commonly used to define lower limits of normality (LLN) [18]. To our knowledge, only four studies have presented LLN for maximal respiratory pressures in children [14,16,19,20]. Arnall et al. [16,19] and Marcelino et al. [20] employed the mentioned approach, while Mendes et al. [14] used Z-scores≥2SD. As with PImax/PEmax values, these cut-offs vary across studies.
Thus, our main objectives were to develop new sex-specific reference equations for PImax and PEmax in a healthy Spanish paediatric population and to establish cut-offs for defining respiratory muscle weakness based on the LLN, using Z-scores≥1.645 SD below group means for children aged 6–18 years. Secondarily, we aim to compare the values obtained in our sample with those predicted by previously published paediatric reference equations.
MethodsA multicentre, cross-sectional study was conducted between 2022 and 2024 in 14 centres geographically well-distributed across Spain (see Table S1 of online Supplementary Material for list of centres). The study received approval from the Clinical Research Ethics Committee of Coruña-Ferrol (2022/173). Healthy children of both sexes, aged 6–18 years, were recruited from educational institutions and through promotional posters distributed on social media platforms. Participants were stratified by geographic region, sex and age groups (6–8, 9–11, 12–14, 15–18 years). Inclusion criteria comprised children who had lived in Spain for most of the previous 12 months and who were neither current nor former smokers for at least one year. Exclusion criteria encompassed: premature birth (<37 weeks), low birth weight (<2.5kg) [15], body mass index (BMI) percentiles outside the 3rd–97th range according to World Health Organization (WHO) standards [21]; respiratory, cardiac, neurovascular or neuromuscular disorders; thoracic deformities; thoracoabdominal surgical interventions within the last three months; recent upper respiratory infections (including cold, influenza or SARS-CoV-2) within the past 30 days; diagnosis of long COVID-19; chronic rhinitis or sinusitis; regular use of medication for respiratory allergies, oral corticosteroids, central nervous system depressants or muscle relaxants; middle ear or ocular pathologies; pregnancy and inability to comprehend instructions for the measurements.
The assessments were conducted in a single session by trained physiotherapists. Sociodemographic and health-related information were gathered through personal interviews. Weight and height were recorded to calculate BMI, with percentiles derived using WHO AnthroPlus software (WHO, Switzerland) [21]. Physical activity levels were evaluated using two questionnaires: the Youth Activity Profile Questionnaire, Spanish version (YAP-S) [22] for school-aged children and the International Physical Activity Questionnaire, short Spanish version (IPAQ-short) [23] for older participants in higher education. Grip strength was assessed using a dynamometer, following the National Health and Nutrition Examination Survey (NHANES) protocol [24]. Each hand was tested three times [24] and the highest value was recorded. Spirometry was performed in accordance with international guidelines [25]. Forced Expiratory Volume in one second (FEV1) and Forced Vital Capacity (FVC) were compared to Spanish predicted values by Casan et al. [26]. Further explanations of these evaluations can be found in the online Supplementary Material.
Maximal respiratory pressures were measured as one-second plateau pressure, following American Thoracic Society (ATS)/ERS recommendations [17,27] and the Spanish Society of Pulmonology and Thoracic Surgery (SEPAR) protocol [28]. A digital manometer (MicroRPM®, Vyaire Medical GmbH, Hoechberg, Germany), with a ±300cmH2O range and a flanged mouthpiece, was used. The device was connected to the PUMA® software (Vyaire Medical GmbH, Hoechberg, Germany) to display real-time pressure graphs. PImax and PEmax tests were performed in a random order to mitigate potential confounding effects related to the learning effect and fatigue [29]. PEmax was obtained from total lung capacity (TLC) while PImax from residual volume (RV). Visual feedback was consistently provided throughout the assessments, accompanied by animated incentives delivered via the PUMA® software at the evaluator's choice. Participants were allowed up to ten attempts for both PImax and PEmax to achieve six technically accurate manoeuvres: free of air leaks, sustained for 3–5s and exhibiting a plateau on the pressure curve. Among these attempts, three reproducible manoeuvres with variability of ≤5% were selected and the highest value was recorded [28]. All evaluators underwent a comprehensive training programme to ensure consistency in the procedures. Rigorous quality control measures were implemented at all centres to guarantee adherence to the established protocol [30]. Additional information on the PImax/PEmax assessment methodology, training protocols, and quality control procedures is available in the online Supplementary Material.
Statistical analysisThe sample size was calculated to attain a desired precision of ±3cmH2O. Assuming a SD of ±24cmH2O for PImax [7], a confidence level of 95%, while accounting for an estimated withdrawal rate of 10%, it was determined that 273 subjects per sex would be required. Thus, a total of 546 children were targeted for recruitment. Participants were stratified into four age groups, aiming to enrol 62 subjects of each sex in every age group.
Initially, factors associated with respiratory muscle strength were investigated. For the effect of categorical variables, dependency analysis was performed using T-tests or U-tests, as well as ANOVA or Kruskal–Wallis tests, depending on whether the comparison involved two groups or more, and based on normality assumptions. Dependency between continuous variables was assessed using Pearson correlation coefficients. Reference equations for PImax and PEmax were developed for each sex using multiple linear regression. An ANOVA test between nested models was performed to select the most suitable equation. The final model was further validated through cross-validation techniques [31]. Furthermore, the age-specific LLN for both PImax and PEmax was calculated for each sex by age group, using the following formula: LLN=age-range specific mean−1.645SD. The values obtained in our sample were compared to those predicted by existing reference equations using a t-test [7–10,14,16,20,32–34]. Further details of data analysis are reflected in the online Supplementary Material. Significance level of all tests was set at p<.05 and a 95% confidence interval was used. All data analyses were conducted using R 4.1.3 statistical software (R Core Team, 2023) [35].
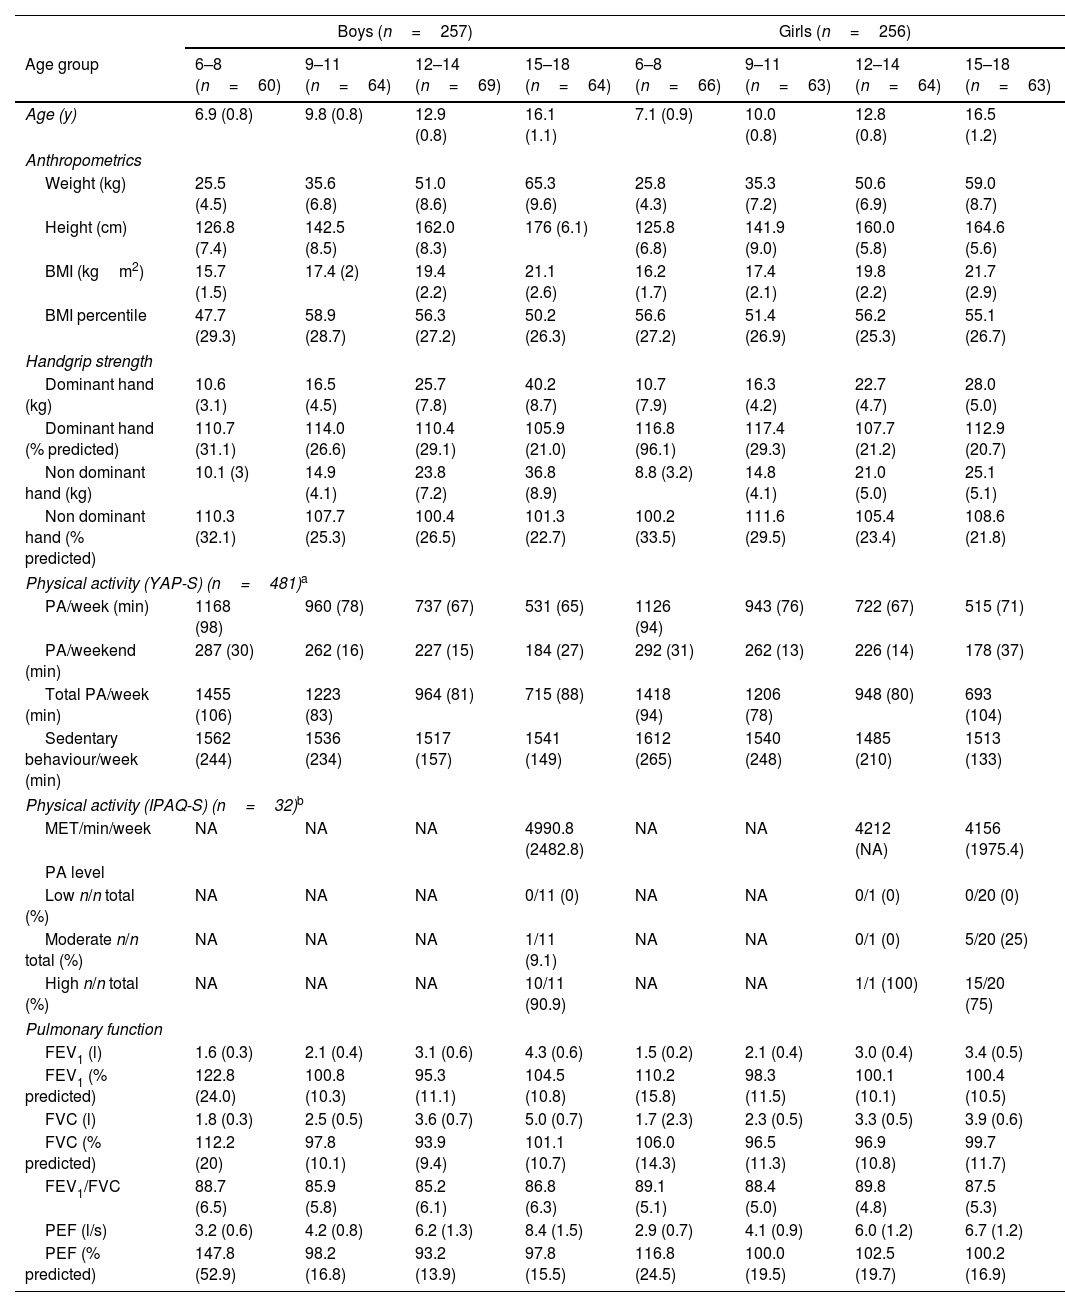
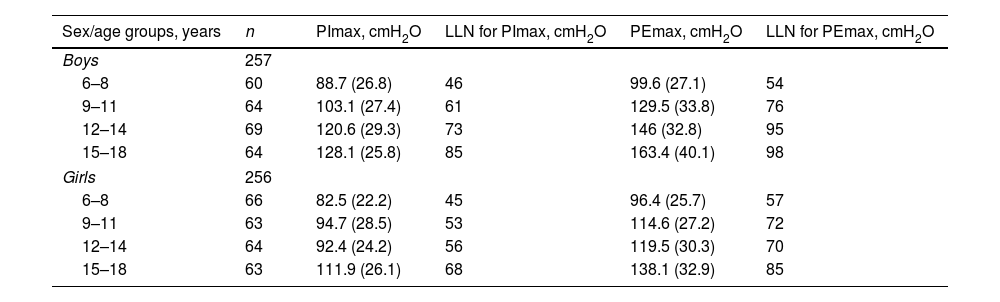
ResultsA total of 560 subjects were recruited. After excluding 47 participants (Fig. 1), data from 513 children (257 boys, 11.5±3.5 years) were analyzed. Their characteristics are summarized in Table 1. Significant differences in respiratory muscle strength were found between boys and girls: PImax 110.7±31.2 vs. 95.2±26.3cmH2O (p<.001); PEmax 135.3±41.0 vs. 116.9±32.6cmH2O (p<.001). PImax and PEmax values increased progressively with age in both sexes (p<.001) (Table 2). Adolescents aged 15–18 exhibited the highest values, suggesting an age-related improvement in respiratory muscle strength (Table 2).

Characteristics of the sample used for the development of the maximal respiratory pressures reference equations stratified by sex and age groups.
| Boys (n=257) | Girls (n=256) | |||||||
|---|---|---|---|---|---|---|---|---|
| Age group | 6–8 (n=60) | 9–11 (n=64) | 12–14 (n=69) | 15–18 (n=64) | 6–8 (n=66) | 9–11 (n=63) | 12–14 (n=64) | 15–18 (n=63) |
| Age (y) | 6.9 (0.8) | 9.8 (0.8) | 12.9 (0.8) | 16.1 (1.1) | 7.1 (0.9) | 10.0 (0.8) | 12.8 (0.8) | 16.5 (1.2) |
| Anthropometrics | ||||||||
| Weight (kg) | 25.5 (4.5) | 35.6 (6.8) | 51.0 (8.6) | 65.3 (9.6) | 25.8 (4.3) | 35.3 (7.2) | 50.6 (6.9) | 59.0 (8.7) |
| Height (cm) | 126.8 (7.4) | 142.5 (8.5) | 162.0 (8.3) | 176 (6.1) | 125.8 (6.8) | 141.9 (9.0) | 160.0 (5.8) | 164.6 (5.6) |
| BMI (kgm2) | 15.7 (1.5) | 17.4 (2) | 19.4 (2.2) | 21.1 (2.6) | 16.2 (1.7) | 17.4 (2.1) | 19.8 (2.2) | 21.7 (2.9) |
| BMI percentile | 47.7 (29.3) | 58.9 (28.7) | 56.3 (27.2) | 50.2 (26.3) | 56.6 (27.2) | 51.4 (26.9) | 56.2 (25.3) | 55.1 (26.7) |
| Handgrip strength | ||||||||
| Dominant hand (kg) | 10.6 (3.1) | 16.5 (4.5) | 25.7 (7.8) | 40.2 (8.7) | 10.7 (7.9) | 16.3 (4.2) | 22.7 (4.7) | 28.0 (5.0) |
| Dominant hand (% predicted) | 110.7 (31.1) | 114.0 (26.6) | 110.4 (29.1) | 105.9 (21.0) | 116.8 (96.1) | 117.4 (29.3) | 107.7 (21.2) | 112.9 (20.7) |
| Non dominant hand (kg) | 10.1 (3) | 14.9 (4.1) | 23.8 (7.2) | 36.8 (8.9) | 8.8 (3.2) | 14.8 (4.1) | 21.0 (5.0) | 25.1 (5.1) |
| Non dominant hand (% predicted) | 110.3 (32.1) | 107.7 (25.3) | 100.4 (26.5) | 101.3 (22.7) | 100.2 (33.5) | 111.6 (29.5) | 105.4 (23.4) | 108.6 (21.8) |
| Physical activity (YAP-S) (n=481)a | ||||||||
| PA/week (min) | 1168 (98) | 960 (78) | 737 (67) | 531 (65) | 1126 (94) | 943 (76) | 722 (67) | 515 (71) |
| PA/weekend (min) | 287 (30) | 262 (16) | 227 (15) | 184 (27) | 292 (31) | 262 (13) | 226 (14) | 178 (37) |
| Total PA/week (min) | 1455 (106) | 1223 (83) | 964 (81) | 715 (88) | 1418 (94) | 1206 (78) | 948 (80) | 693 (104) |
| Sedentary behaviour/week (min) | 1562 (244) | 1536 (234) | 1517 (157) | 1541 (149) | 1612 (265) | 1540 (248) | 1485 (210) | 1513 (133) |
| Physical activity (IPAQ-S) (n=32)b | ||||||||
| MET/min/week | NA | NA | NA | 4990.8 (2482.8) | NA | NA | 4212 (NA) | 4156 (1975.4) |
| PA level | ||||||||
| Low n/n total (%) | NA | NA | NA | 0/11 (0) | NA | NA | 0/1 (0) | 0/20 (0) |
| Moderate n/n total (%) | NA | NA | NA | 1/11 (9.1) | NA | NA | 0/1 (0) | 5/20 (25) |
| High n/n total (%) | NA | NA | NA | 10/11 (90.9) | NA | NA | 1/1 (100) | 15/20 (75) |
| Pulmonary function | ||||||||
| FEV1 (l) | 1.6 (0.3) | 2.1 (0.4) | 3.1 (0.6) | 4.3 (0.6) | 1.5 (0.2) | 2.1 (0.4) | 3.0 (0.4) | 3.4 (0.5) |
| FEV1 (% predicted) | 122.8 (24.0) | 100.8 (10.3) | 95.3 (11.1) | 104.5 (10.8) | 110.2 (15.8) | 98.3 (11.5) | 100.1 (10.1) | 100.4 (10.5) |
| FVC (l) | 1.8 (0.3) | 2.5 (0.5) | 3.6 (0.7) | 5.0 (0.7) | 1.7 (2.3) | 2.3 (0.5) | 3.3 (0.5) | 3.9 (0.6) |
| FVC (% predicted) | 112.2 (20) | 97.8 (10.1) | 93.9 (9.4) | 101.1 (10.7) | 106.0 (14.3) | 96.5 (11.3) | 96.9 (10.8) | 99.7 (11.7) |
| FEV1/FVC | 88.7 (6.5) | 85.9 (5.8) | 85.2 (6.1) | 86.8 (6.3) | 89.1 (5.1) | 88.4 (5.0) | 89.8 (4.8) | 87.5 (5.3) |
| PEF (l/s) | 3.2 (0.6) | 4.2 (0.8) | 6.2 (1.3) | 8.4 (1.5) | 2.9 (0.7) | 4.1 (0.9) | 6.0 (1.2) | 6.7 (1.2) |
| PEF (% predicted) | 147.8 (52.9) | 98.2 (16.8) | 93.2 (13.9) | 97.8 (15.5) | 116.8 (24.5) | 100.0 (19.5) | 102.5 (19.7) | 100.2 (16.9) |
Data are reported as mean (standard deviation) unless otherwise stated.
IPAQ-S was used for older participants in higher education. Low PA: <600MET-min/week; moderate PA: 600–3000MET-min/week; high PA: 600–3000MET-min/week.
Percentages for IPAQ physical activity levels represent the proportion of children classified as low, moderate or high activity relative to the total number of respondents in each subgroup.
BMI: body mass index; cm: centimetres; FEV1: forced expiratory volume in one second; FVC: forced vital capacity; IPAQ-S: International Physical Activity Questionnaire, short form; kg: kilograms; l: litres; m: metres; MET: metabolic equivalent of task; min: minutes; PA: physical activity; PEF: peak expiratory flow; y: years.
Maximal respiratory pressures and their lower limit of normality stratified by sex and age group.
| Sex/age groups, years | n | PImax, cmH2O | LLN for PImax, cmH2O | PEmax, cmH2O | LLN for PEmax, cmH2O |
|---|---|---|---|---|---|
| Boys | 257 | ||||
| 6–8 | 60 | 88.7 (26.8) | 46 | 99.6 (27.1) | 54 |
| 9–11 | 64 | 103.1 (27.4) | 61 | 129.5 (33.8) | 76 |
| 12–14 | 69 | 120.6 (29.3) | 73 | 146 (32.8) | 95 |
| 15–18 | 64 | 128.1 (25.8) | 85 | 163.4 (40.1) | 98 |
| Girls | 256 | ||||
| 6–8 | 66 | 82.5 (22.2) | 45 | 96.4 (25.7) | 57 |
| 9–11 | 63 | 94.7 (28.5) | 53 | 114.6 (27.2) | 72 |
| 12–14 | 64 | 92.4 (24.2) | 56 | 119.5 (30.3) | 70 |
| 15–18 | 63 | 111.9 (26.1) | 68 | 138.1 (32.9) | 85 |
Data are reported as mean (standard deviation) unless otherwise stated.
cmH2O: centimetres of water; LLN: lower limit of normality; PEmax: maximal expiratory pressure; PImax: maximal inspiratory pressure.
LLN was calculated using the following formula: LLN=age-range specific mean−1.645SD.
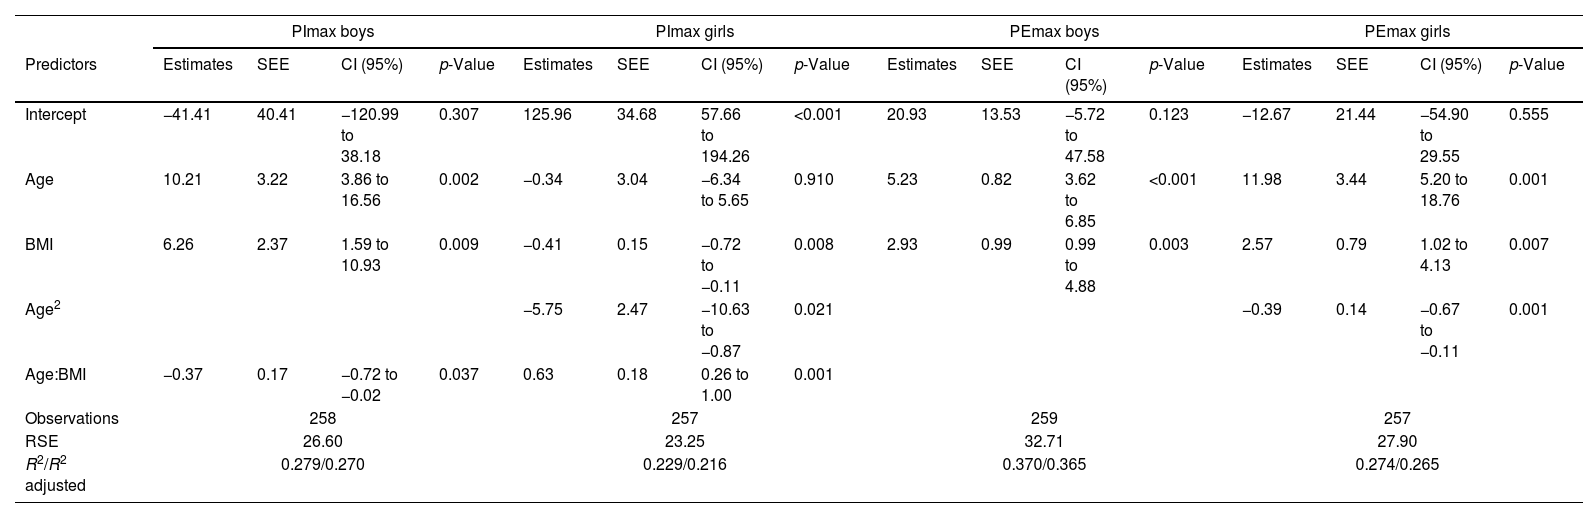
Regression analysis for maximal respiratory pressures revealed that age and BMI were significant predictors in both sexes. Age squared was also a significant predictor for PImax and PEmax, both in girls. Reference equations were developed based on these analyses, with only age, age squared and BMI being retained in the final models. The derived sex-specific prediction equations for PImax and PEmax are reflected in Table 3.
Linear regression models as maximal respiratory pressure reference equations.
| PImax boys | PImax girls | PEmax boys | PEmax girls | |||||||||||||
|---|---|---|---|---|---|---|---|---|---|---|---|---|---|---|---|---|
| Predictors | Estimates | SEE | CI (95%) | p-Value | Estimates | SEE | CI (95%) | p-Value | Estimates | SEE | CI (95%) | p-Value | Estimates | SEE | CI (95%) | p-Value |
| Intercept | −41.41 | 40.41 | −120.99 to 38.18 | 0.307 | 125.96 | 34.68 | 57.66 to 194.26 | <0.001 | 20.93 | 13.53 | −5.72 to 47.58 | 0.123 | −12.67 | 21.44 | −54.90 to 29.55 | 0.555 |
| Age | 10.21 | 3.22 | 3.86 to 16.56 | 0.002 | −0.34 | 3.04 | −6.34 to 5.65 | 0.910 | 5.23 | 0.82 | 3.62 to 6.85 | <0.001 | 11.98 | 3.44 | 5.20 to 18.76 | 0.001 |
| BMI | 6.26 | 2.37 | 1.59 to 10.93 | 0.009 | −0.41 | 0.15 | −0.72 to −0.11 | 0.008 | 2.93 | 0.99 | 0.99 to 4.88 | 0.003 | 2.57 | 0.79 | 1.02 to 4.13 | 0.007 |
| Age2 | −5.75 | 2.47 | −10.63 to −0.87 | 0.021 | −0.39 | 0.14 | −0.67 to −0.11 | 0.001 | ||||||||
| Age:BMI | −0.37 | 0.17 | −0.72 to −0.02 | 0.037 | 0.63 | 0.18 | 0.26 to 1.00 | 0.001 | ||||||||
| Observations | 258 | 257 | 259 | 257 | ||||||||||||
| RSE | 26.60 | 23.25 | 32.71 | 27.90 | ||||||||||||
| R2/R2 adjusted | 0.279/0.270 | 0.229/0.216 | 0.370/0.365 | 0.274/0.265 | ||||||||||||
Values in columns indicate the estimated terms for the equation in each subgroup, the 95% Confidence Intervals (CI) and p-values for testing the significance of each estimate.
Abbreviations: BMI: body mass index; PEmax: maximal expiratory pressure; PImax: maximal inspiratory pressure; R2: coefficient of determination; RSE: Residual standard error.
The reference equations are:
PImax (boys)=−41.41+10.21*age+6.26*BMI−0.37*age*BMI.
PImax (girls)=125.96–0.34*age−0.41*age2−5.75*BMI+0.63*age*BMI.
PEmax (boys)=20.93+5.23*age+2.93*BMI.
PEmax (girls)=−12.67+11.98*age−0.39*age2+2.57*BMI.
Respiratory muscle weakness cut-offs, based on Z-scores≥1.64SD, were defined by sex and age group. They were greater in boys than in girls across all age groups, with the highest values found in the oldest one (Table 2).
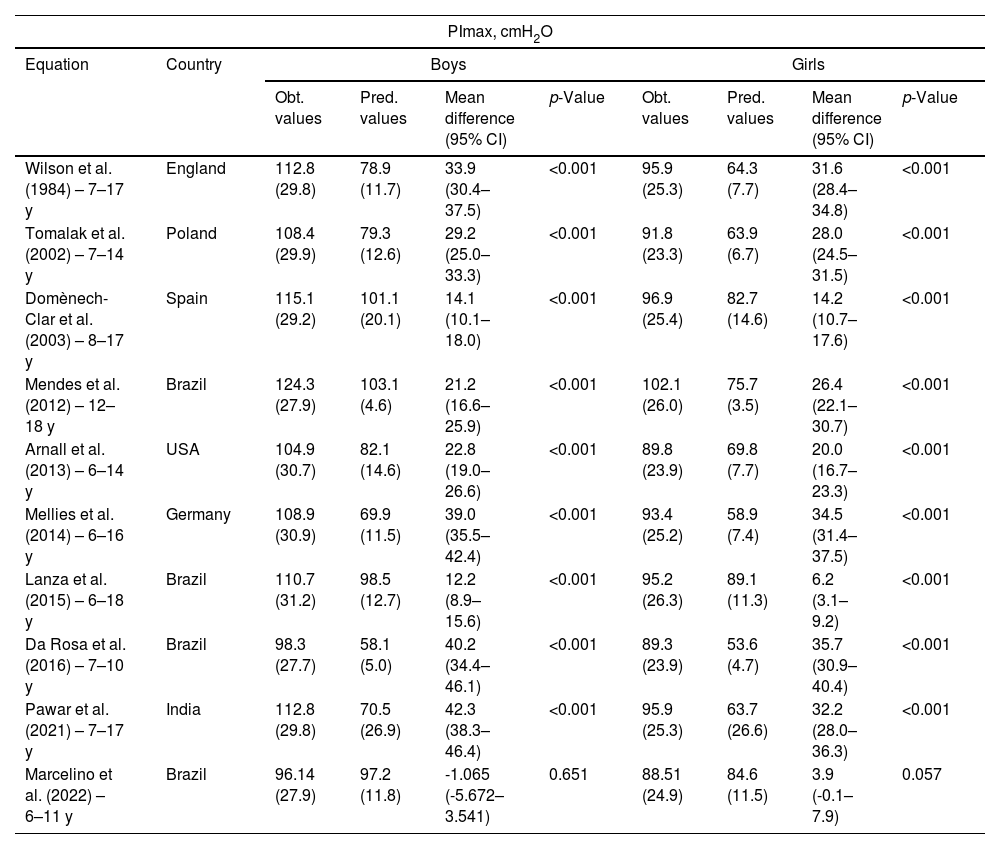
When comparing the values obtained in our sample to those predicted by existing paediatric reference equations, we observed that our PImax/PEmax values were significantly higher than the predicted ones (p<.001) [7–10,14,16,32–34], except for the predicted PImax by Marcelino et al. [20], where no significant difference was found (p=.34). A detailed comparison of these values, stratifying our sample according to the age groups considered by each author, is presented in Table 4 as well as in Fig. S1 of online Supplementary Material.
Comparison of maximal inspiratory and expiratory pressures values by sex obtained in our sample vs. those predicted by the reference equations from different authors, for the same age group.
| PImax, cmH2O | |||||||||
|---|---|---|---|---|---|---|---|---|---|
| Equation | Country | Boys | Girls | ||||||
| Obt. values | Pred. values | Mean difference (95% CI) | p-Value | Obt. values | Pred. values | Mean difference (95% CI) | p-Value | ||
| Wilson et al. (1984) – 7–17 y | England | 112.8 (29.8) | 78.9 (11.7) | 33.9 (30.4–37.5) | <0.001 | 95.9 (25.3) | 64.3 (7.7) | 31.6 (28.4–34.8) | <0.001 |
| Tomalak et al. (2002) – 7–14 y | Poland | 108.4 (29.9) | 79.3 (12.6) | 29.2 (25.0–33.3) | <0.001 | 91.8 (23.3) | 63.9 (6.7) | 28.0 (24.5–31.5) | <0.001 |
| Domènech-Clar et al. (2003) – 8–17 y | Spain | 115.1 (29.2) | 101.1 (20.1) | 14.1 (10.1–18.0) | <0.001 | 96.9 (25.4) | 82.7 (14.6) | 14.2 (10.7–17.6) | <0.001 |
| Mendes et al. (2012) – 12–18 y | Brazil | 124.3 (27.9) | 103.1 (4.6) | 21.2 (16.6–25.9) | <0.001 | 102.1 (26.0) | 75.7 (3.5) | 26.4 (22.1–30.7) | <0.001 |
| Arnall et al. (2013) – 6–14 y | USA | 104.9 (30.7) | 82.1 (14.6) | 22.8 (19.0–26.6) | <0.001 | 89.8 (23.9) | 69.8 (7.7) | 20.0 (16.7–23.3) | <0.001 |
| Mellies et al. (2014) – 6–16 y | Germany | 108.9 (30.9) | 69.9 (11.5) | 39.0 (35.5–42.4) | <0.001 | 93.4 (25.2) | 58.9 (7.4) | 34.5 (31.4–37.5) | <0.001 |
| Lanza et al. (2015) – 6–18 y | Brazil | 110.7 (31.2) | 98.5 (12.7) | 12.2 (8.9–15.6) | <0.001 | 95.2 (26.3) | 89.1 (11.3) | 6.2 (3.1–9.2) | <0.001 |
| Da Rosa et al. (2016) – 7–10 y | Brazil | 98.3 (27.7) | 58.1 (5.0) | 40.2 (34.4–46.1) | <0.001 | 89.3 (23.9) | 53.6 (4.7) | 35.7 (30.9–40.4) | <0.001 |
| Pawar et al. (2021) – 7–17 y | India | 112.8 (29.8) | 70.5 (26.9) | 42.3 (38.3–46.4) | <0.001 | 95.9 (25.3) | 63.7 (26.6) | 32.2 (28.0–36.3) | <0.001 |
| Marcelino et al. (2022) – 6–11 y | Brazil | 96.14 (27.9) | 97.2 (11.8) | -1.065 (-5.672–3.541) | 0.651 | 88.51 (24.9) | 84.6 (11.5) | 3.9 (-0.1–7.9) | 0.057 |
| PEmax, cmH2O | |||||||||
|---|---|---|---|---|---|---|---|---|---|
| Equation | Country | Boys | Girls | ||||||
| Obt. values | Pred. values | Mean difference (95% CI) | p-Value | Obt. values | Pred. values | Mean difference (95% CI) | p-Value | ||
| Wilson et al. (1984) – 7–17 y | England | 138.2 (36.5) | 100.0 (16.6) | 38.2 (34.0–42.4) | <0.001 | 119.5 (31.2) | 79.4 (14.3) | 40.1 (36.3–43.9) | <0.001 |
| Tomalak et al. (2002) – 7–14 y | Poland | 131.9 (34.3) | 77.4 (10.3) | 54.5 (49.9–59.2) | <0.001 | 113.9 (28.0) | 66.5 (5.2) | 47.4 (43.3–51.4) | <0.001 |
| Domènech-Clar et al. (2003) – 8–17 y | Spain | 142.0 (35.7) | 134.6 (33.0) | 7.4 (2.2–12.6) | 0.006 | 121.5 (31.2) | 103.1 (20.1) | 18.3 (14.1–22.6) | <0.001 |
| Mendes et al. (2012) – 12–18 y | Brazil | 154.9 (37.3) | 121.1 (0.0) | 33.8 (27.5–40.2) | <0.001 | 128.7 (32.8) | 86.9 (0.0) | 41.9 (36.2–47.6) | <0.001 |
| Arnall et al. (2013) – 6–14 y | USA | 126.5 (36.7) | 79.1 (14.3) | 47.4 (43.1–51.8) | <0.001 | 110.2 (29.3) | 67.8 (7.7) | 42.3 (38.5–46.2) | <0.001 |
| Lanza et al. (2015) – 6–18 y | Brazil | 135.7 (40.9) | 103.9 (8.5) | 31.8 (27.4–36.3) | <0.001 | 117.1 (32.5) | 91.8 (4.7) | 25.2 (21.5–29.0) | <0.001 |
| Da Rosa et al. (2016) – 7–10 y | Brazil | 118.1 (29.7) | 68.8 (5.5) | 49.3 (43.0–55.6) | <0.001 | 108.3 (24.6) | 60.1 (5.6) | 48.2 (43.3–53.0) | <0.001 |
| Pawar et al. (2021)- 7–17 y | India | 119.5 (31.2) | 64.0 (26.5) | 55.5 (51.2–59.8) | <0.001 | 119.5 (31.2) | 64.0 (26.5) | 55.5 (51.2–59.8) | <0.001 |
| Marcelino et al. (2022) – 6–11 y | Brazil | 105.6 (27.8) | 95.6 (7.6) | 9.9 (5.6–14.3) | <0.001 | 105.6 (27.8) | 95.6 (7.6) | 9.9 (5.6–14.3) | <0.001 |
Data are reported as mean (standard deviation).
cmH2O: centimetres of water; CI: confidence interval; obt.: obtained; PEmax: maximal expiratory pressure; PImax: maximal inspiratory pressure; pred.: predicted; USA: United States of America; y: years.
This study provides sex-specific reference equations for maximal respiratory pressures in a large cohort of healthy Spanish children aged 6–18 years. To date, it represents the largest dataset of PImax and PEmax values obtained with standardized assessments methods in a healthy European population. The new reference equations include age and BMI as explanatory variables for both sexes. Quadratic terms for age were added for girls due to their statistical significance and improved predictive accuracy. Additionally, we established age-stratified cut-offs, based on Z-scores, to identify respiratory muscle weakness in both sexes.
Our results confirm that, after sex [5,6], age is the second most relevant determinant of maximal respiratory pressures. We observed a progressive increase in respiratory muscle strength from ages 6 to 18, with boys steadily achieving higher values across all age groups. This aligns with previous studies which included age as an independent variable [7,8,10,13–16,19,20,33,34,36] and reported a similar trend [7,8,10,13–16,19,20,33,34,36].
The observed rise in PImax and PEmax with age reflects normal muscle development and maturation of the respiratory system, which occurs in parallel with somatic growth. Strength improves as children grow, with the most significant gains in muscle mass during adolescence [37]. In boys, static strength rises consistently from age six, accelerating around 13 and continuing into late adolescence; in girls, strength develops more gradually until approximately age 15 [37]. This is explained by quantitative (e.g., greater increase in muscle cross-sectional area) and qualitative factors (e.g. biochemical changes and neuro-motor control improvements) [37]. Testosterone promotes greater diaphragmatic and intercostal muscle development in boys, while girls undergo earlier but less pronounced changes. Thoracic growth during puberty also enhances lung volumes and mechanical advantage, particularly the diaphragm, contributing to higher PImax. The progressive increase in PEmax with age may also reflect improved lung recoil and chest wall stiffness, enabling more forceful expiratory efforts [20,34]. Sex differences in PImax and PEmax are further attributed to hormonal variation and greater skeletal and muscle mass in boys [20,33].
The another explanatory variable, BMI, has been considered in prior studies [15,19,33,34] but is absent from most reference equations. While many models include height and weight [7,8,13,15,20,32,33,36], our analysis found BMI improved predictive performance. The use of age and BMI is consistent with recently developed Spanish adult equations [30]. In this context, boys aged 12–14 years reach PImax values similar to adult males (121±29cmH2O for boys 12–14 years vs. 127±28cmH2O for 18–29-year-olds). Girls achieve adult female values earlier, between 9 and 11 years (95±29cmH2O for girls 9–11 years vs. 99±24cmH2O for women 18–29 years). These age ranges correspond with pubertal changes, when muscle mass increases significantly, especially early in girls [37]. PEmax shows wider gaps between children and adults, with the highest paediatric values recorded in the 15–18 age group: 163±40cmH2O for boys 15–18 years vs. 195±46cmH2O for men 18–29 years and 138±33cmH2O for girls 15–18 years vs. 142±31cmH2O for women 18–29 years.
Our reference equations yielded R2 values from 0.2 to 0.4, comparable to those reported by previous paediatric studies, where values spanning from 0.1 to 0.6 [7–9,12–14,16,19,20,32–34,36]. Although most models stratify equations by sex [7–10,12,13,15,16,19,20,32,36] and include similar variables (mainly age and anthropometric outcomes), R2 values vary significantly. This phenomenon, also observed in adult reference equations [30], reflects the high variability observed in the measurements.
To establish cut-offs for respiratory muscle weakness, we used the LLN for PImax/PEmax based on Z-scores, a standard approach for interpreting lung function [18]. Given sex and age differences, we defined specific cut-offs. To date, only four studies established paediatric cut-offs for maximal respiratory pressures [14,16,19,20] and just one provided absolute thresholds [14], involving 12–18-year-olds. Their LLN were 37cmH2O and 31cmH2O for PImax and 62cmH2O and 51cmH2O for PEmax in boys and girls, respectively. These are notably lower than our 12–14 and 15–18 age-groups values (Table 2). It should be noted that their methodology differed from ours, as they used Z-scores≥2SD below the mean [14]. Despite this discrepancy, we believe that establishing absolute cut-offs for such a wide age range may be inappropriate, considering the variability in maximal respiratory pressures within 12–18 years. Interestingly, our LLNs for girls aged 15–18 years are similar to those of Spanish women aged 18–29 years [16] (PImax: 66cmH2O; PEmax: 91cmH2O), whereas the LLNs for our boys aged 15–18 are below than those for men aged 18–29 years (PImax: 95cmH2O; PEmax: 121cmH2O). This may be due to men reaching peak respiratory pressures later (38–43 years) than women (30–36 years) [30], meaning boys 15–18 are still developing their respiratory muscle strength and further from this peak than girls.
Finally, we compared our PImax/PEmax values with those predicted by existing paediatric reference equations, stratifying the sample by sex and age ranges used in each model. Across all comparisons, significantly higher PImax and PEmax values were observed in our population (p<.001) [7–10,14,16,32–34], except for PImax predicted by Marcelino et al. [20], for which no significant differences were found in either sex.
As previously highlighted [5], factors like ethnic differences, methodological variations (particularly mean vs. peak pressure and the number of manoeuvres) and subject motivation can contribute to discrepancies between different equations. We believe our higher PImax/PEmax values stem from the rigorous methodology we employed. Our approach followed the SEPAR protocol [28], which adheres to internationally recognized standards [17,27]. In fact, it is stricter than the ERS. It requires at least six technically correct manoeuvres, instead of five recommended by the ATS/ERS [17]. While most published studies conduct three [7,8,10,13,15,16,19,20,33] to seven attempts [32], we believe that limiting the test to three manoeuvres may underestimate a subject's strength, considering the learning effect [29] and the higher variability observed in children [5]. The ERS notes maximum PImax is reached after 9 attempts and PEmax after 5–6 repetitions [27]. Furthermore, maximal respiratory pressures must be sustained for 3–5s, instead of 1.5s, and the maximal variability between the three best attempts is limited to 5%, compared to the 10% allowed by ATS/ERS [17]. Additionally, we provided visual feedback, which has been shown to improve collaboration during pulmonary function tests, particularly in paediatric populations [38].
This study has limitations. As with most studies developing reference equations, achieving a fully random sample was not possible. For ethical reasons, we did not have access to population censuses, introducing possible volunteer bias. Additionally, we were unable to measure lean body mass or hormonal levels, factors that could influence respiratory muscle strength [20]. However, to mitigate potential bias related to an overly fit sample, we accounted for two relevant cofounders: physical activity levels and handgrip strength, both related to respiratory performance [39,40]. Normative handgrip values confirmed that our participants were within expected ranges. However, standardized reference data for physical activity levels in the Spanish paediatric population are lacking. Nonetheless, including these variables in our analysis helped control for the potential impact of overall physical fitness on PImax/PEmax.
There are also several strengths. First, we recruited a large, well-balanced sample that is representative of sex, age groups and geographical distribution within Spain. Strict selection criteria were applied, excluding characteristics that could influence maximal respiratory pressures [28]. Furthermore, we are among the first to use WHO-based BMI percentiles to evaluate nutritional status. Second, we employed a rigorous methodology consistent with international guidelines and ensured strict quality control procedures throughout the study. Finally, we were the first to establish cut-off points based on the LLN for small age strata, offering a more accurate approach to diagnosing respiratory muscle weakness, avoid both misdiagnosing and overdiagnosing.
Both the reference equations and cut-offs can be readily implemented in clinical practice, providing a valuable resource for interpreting maximal respiratory pressures and enabling early detection of respiratory muscle weakness in children and adolescents. They may also help identify candidates for targeted respiratory muscle training, intervention which has shown to enhance physical capacity and reduce symptoms in various paediatric populations [4]. Developed from a large and diverse Spanish sample, these equations are likely generalizable to other European paediatric populations with similar anthropometric, health and lifestyle characteristics, particularly in neighbouring regions where tailored reference values are not yet available. Future studies should validate their applicability in different countries and among children with specific health conditions to further support their broader clinical use.
ConclusionsThis study presents novel reference equations for maximal respiratory pressures in the healthy Spanish paediatric population, derived from the largest paediatric sample in Europe and developed in accordance with international guidelines. For the first time in Spain, cut-off points for defining respiratory muscle weakness in children and adolescents have been established. These reference values will enhance the assessment, diagnosis, and monitoring of respiratory muscle dysfunction in diverse clinical conditions.
Authors contributionsConception and design of the work: ALP, MBF, LGD, SSC, DL, EGS, RTC, GF, MJMV.
Data analysis and data interpretation: MAJP, ALP, MBF, DL.
Draft the paper: MBF, ALP.
Data acquisition: MBF, ALP, MARB, MAB, AAE, GM, PBC, TC, RMV, CLC, FML, JASS, MFG, CMG, CMC, EGD, CSV, ABVF, PSJH, CGM, MPP, JVC, AFC, ATRC.
Revision and final approval of the paper: all authors.
Artificial intelligence involvementThe authors declare that artificial intelligence tools have utilized to assist in improving the clarity and fluency of the English language in the manuscript. All content was critically reviewed and edited by the authors.
Funding of the researchThis work was funded by a research grant from the Spanish Society of Pulmonology and Thoracic Surgery (SEPAR), project 1373/2023, from The Official College of Physiotherapists from Galicia (CoFiGa) and from The “San Juan de Dios” University School of Nursing and Physical Therapy.
Conflict of interestsNone declared.
We would like to express our sincere gratitude to all the children and their families for their voluntary participation, which made this study possible. We also wish to thank our colleagues who contributed to the data collection: Paula Gálvez Álvarez (University of Málaga) and Marta Rosende González (Complutense University of Madrid).
The followings are the supplementary data to this article:


