


The relationship between bronchodilator responsiveness and eosinophilic airway inflammation has not been well documented in COPD. It has been investigated in this retrospective study. This issue has grown in importance due to increasing interest in the asthma-COPD overlap syndrome.
Methods264 stable COPD patients with no past history of asthma were retrospectively analyzed. Correlation analyses between FEV1 reversibility and sputum eosinophil levels were conducted. Sputum eosinophil levels were dichotomized using FEV1 reversibility cut-off points (>0.4L and >15% vs. >0.2L and >12%) and compared. The effectiveness of FEV1 reversibility to predict sputum eosinophilia (>3%) was analyzed with a logistic regression and a ROC analysis.
Results82 (31.1%) patients with higher FEV1 reversibility values (0.14 vs. 0.11L, P=.01) presented sputum eosinophilia. FEV1 reversibility was weakly correlated with the sputum eosinophil level (r=0.162, P=.008). Patients with FEV1>0.4L and >15% increment had higher sputum eosinophil levels (6.11 vs. 1.02%, P=.049) whereas the level did not differ when dichotomized by FEV1 increment >0.2L and >12%. Very positive FEV1 reversibility (>0.4L and >15%) predicted sputum eosinophilia after adjustment forage, baseline FEV1 and FVC (OR: 4.262, P=.029). In the ROC analysis, the AUC was 0.58 (P=.034), and FEV1 increment>0.4L and >15% had a positive predictive value of 63.6% and an overall accuracy of 70.1%.
ConclusionsFEV1 reversibility was weakly correlated with sputum eosinophil levels in COPD. Positive FEV1 reversibility (>0.4L and >15%) is moderately successful in predicting sputum eosinophilia (>3%).
La relación entre la reactividad al broncodilatador y la inflamación eosinofílica de la vía aérea no está bien documentada en la EPOC y se ha investigado en este estudio retrospectivo. Esta cuestión ha adquirido mayor importancia debido al creciente interés que despierta el fenotipo mixto asma-EPOC.
MétodosSe analizó retrospectivamente a 264 pacientes con EPOC estable y sin antecedentes de asma. Se efectuaron análisis de correlación entre la reversibilidad del FEV1 y las concentraciones de eosinófilos en esputo, que se compararon una vez dicotomizadas en función de diferentes puntos de corte de la reversibilidad del FEV1 (> 0,4 l y > 15% vs. > 0,2 l y > 12%). La utilidad de la reversibilidad del FEV1 para predecir la eosinofilia del esputo (> 3%) se evaluó mediante una regresión logística y un análisis de la curva ROC.
ResultadosEn los 82 pacientes (31,1%) que presentaban eosinofilia del esputo, la reversibilidad del FEV1 fue mayor (0,14 vs. 0., 1 l, p=0,01). La reversibilidad del FEV1 se correlacionó débilmente con la concentración de eosinófilos en esputo (r=0,162, p=0,008). Los pacientes con incrementos del FEV1 > 0,4 l y > 15% mostraron mayores concentraciones de eosinófilos en el esputo (6,11 vs. 1,02%, p=0,049), aunque las concentraciones no difirieron tras dicotomizarlas de acuerdo a un incremento del FEV1 > 0,2 l y > 12%. Tras ajustarla en función de la edad, el FEV1 inicial y la FVC, la reversibilidad del FEV1 muy alta (> 0,4 l y > 15%) continuó siendo significativa para predecir la eosinofilia del esputo (OR: 4,262, p=0,029). El análisis de la curva ROC mostró que el valor predictivo positivo de un AUC de 0,58 (p=0,034) y un incremento del FEV1 > 0,4 l y > 15% es del 63,6%, con una precisión total del 70,1%.
ConclusionesEn pacientes con EPOC, la reversibilidad del FEV1 se correlacionó débilmente con las concentraciones de eosinófilos en esputo. Una reversibilidad del FEV1 muy alta (> 0,4l y > 15%) puede predecir la eosinofilia del esputo (> 3%), pero su rendimiento es modesto.
COPD and asthma are common obstructive lung diseases, both characterized by chronic airway inflammation and airflow limitation. Despite similar symptoms, they are thought of as two distinct conditions in terms of disease onset, frequency of symptoms and reversibility of airway obstruction and pathophysiology.1 However, the line between asthma and COPD is not well-demarcated, since a substantial number of patients may share features of both diseases. Patients occupying this gray area are now categorized as mixed COPD-asthma or asthma-COPD overlap syndrome (ACOS).2,3
Enhanced bronchodilator response and eosinophilic airway inflammation are considered characteristic of asthma, and their presence may support diagnosis.4 These features are also observed in a substantial number of COPD patients.5 Unlike asthma, the implication of bronchodilator responsiveness and eosinophilic airway inflammation in COPD has not been well documented. The role of these features has also been highlighted in the context of ACOS.2 Based on expert consensus, the recent Spanish COPD guidelines have adopted sputum eosinophilia and a very positive bronchodilator test ([VPBT]: FEV1 increase >15% and >400ml over baseline) as the major diagnostic criteria of ACOS, while a positive bronchodilator test ([PBT]: FEV1 increase >12% and >200ml over baseline) as one of the minor criteria.2 Nonetheless, the criteria established to define bronchodilator reversibility seem arbitrary, and evidence supporting these criteria or cut-offs is limited.
We hypothesized that bronchodilator reversibility would be linked to sputum eosinophilia in COPD. In this study, we evaluated the correlation between sputum eosinophil levels and the extent of bronchodilator reversibility in COPD patients. We also determine whether or not COPD patients with PBT or VPBT have eosinophilic airway inflammation evidenced by sputum eosinophil levels.
Materials and MethodsThe study was approved by the Institutional Review Board of Taipei Veterans General Hospital (VGHIRB No. 2015-09-004AC) and reported in accordance with the STROBE statement.6
Study SubjectsData from sputum analyses and bronchodilator tests from COPD patients included in our prospective clinical trials from 2002 to 20127–10 were retrospectively collected and analyzed. The process of patient selection is detailed in Fig. A1 in the appendix. The data were collected in the outpatient pulmonary clinic of Taipei Veterans General Hospital after obtaining written informed consent in each case. Due to no further follow-up or contact with the patients, the IRB approved the protocol of the current study and waived the requirement of a second informed consent.
These patients were diagnosed with COPD based on GOLD guidelines.11 Inclusion criteria were: age >40 years, smoking history ≥20 pack-years, either newly diagnosed or no use of oral/inhaled corticosteroids for a minimum of 3 months, and post-bronchodilator FEV1/FVC (forced expiratory volume in 1s/forced vital capacity)<70%. Subjects with acute exacerbation of COPD, respiratory tract infection within the 4 weeks prior to pulmonary function testing, or a past history of asthma, rhinitis or eczema, and other chronic lung disease were excluded.
Bronchodilator Reversibility, Sputum Analysis and Allergen TestBronchodilator tests were carried out in the morning, followed by sputum induction on the same day. Bronchodilator reversibility was defined as change inFEV1 (ΔFEV1) over pre-bronchodilator baseline levels 30min after inhalation of 400μg of salbutamol.12 Sputum was induced and processed as described previously.7 The allergen test was assessed by specific IgE levels against common aeroallergens, which were measured with fluoroenzyme immunoassay (ImmunoCAP, Pharmaca Diagnostics).9,10 The results were interpreted using 0.35kU/l as a cutoff.
Statistical AnalysesStatistical analyses were performed utilizing SPSS software (version 17.0; SPSS, Inc., Chicago, IL). Data were expressed as median (interquartile range) or percentage. Correlation was analyzed using Pearson's correlation test. Patients were dichotomized by the different definitions of bronchodilator response–PBT (ΔFEV1>0.2L and >12%) or VPBT (ΔFEV1>0.4L and >15%).2 Comparisons of continuous variables were assessed using the Mann–Whitney U test, due to their non-parametric distribution. Categorical variables were compared using the Chi square/Fisher's Exact Test. A binary logistic regression model was used for multivariate adjustment. A receiver operating characteristic (ROC) curve analysis was performed to determine the efficacy of FEV1 reversibility as a predictor of sputum eosinophilia (>3%)10,13 and its sensitivity/specificity/positive predictive value/negative predictive value/overall accuracy at the cut-off of 0.4L and 15% increment.14 Values of two-sided P<.05 were considered significant.
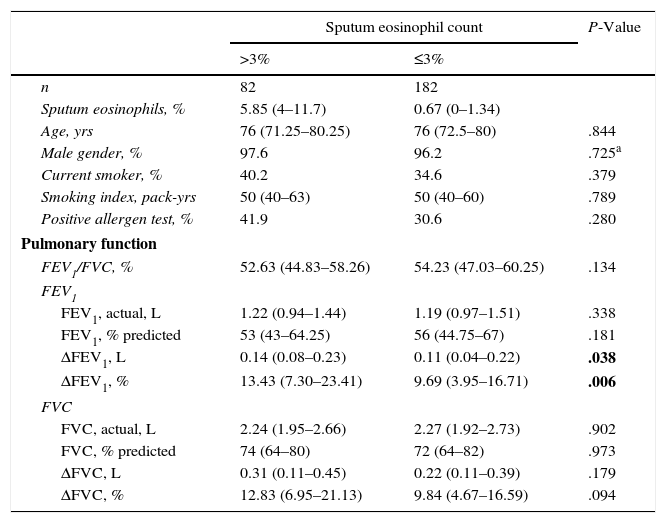
ResultsCharacteristics of Enrolled SubjectsIn total, 264 patients were included in the study, 82 (31.1%) with sputum eosinophilia (sputum eosinophil >3%). Comparisons between subjects with vs. without sputum eosinophilia are shown in Table 1, revealing no differences between groups in terms of age, gender, smoking status/pack-years, allergy, and baseline FEV1 and FVC. However, absolute values over baseline and percentage change in post-bronchodilator reversibility of FEV1 differed between groups.
Comparison of COPD Patients With vs. Without Sputum Eosinophilia.
| Sputum eosinophil count | P-Value | ||
|---|---|---|---|
| >3% | ≤3% | ||
| n | 82 | 182 | |
| Sputum eosinophils, % | 5.85 (4–11.7) | 0.67 (0–1.34) | |
| Age, yrs | 76 (71.25–80.25) | 76 (72.5–80) | .844 |
| Male gender, % | 97.6 | 96.2 | .725a |
| Current smoker, % | 40.2 | 34.6 | .379 |
| Smoking index, pack-yrs | 50 (40–63) | 50 (40–60) | .789 |
| Positive allergen test, % | 41.9 | 30.6 | .280 |
| Pulmonary function | |||
| FEV1/FVC, % | 52.63 (44.83–58.26) | 54.23 (47.03–60.25) | .134 |
| FEV1 | |||
| FEV1, actual, L | 1.22 (0.94–1.44) | 1.19 (0.97–1.51) | .338 |
| FEV1, % predicted | 53 (43–64.25) | 56 (44.75–67) | .181 |
| ΔFEV1, L | 0.14 (0.08–0.23) | 0.11 (0.04–0.22) | .038 |
| ΔFEV1, % | 13.43 (7.30–23.41) | 9.69 (3.95–16.71) | .006 |
| FVC | |||
| FVC, actual, L | 2.24 (1.95–2.66) | 2.27 (1.92–2.73) | .902 |
| FVC, % predicted | 74 (64–80) | 72 (64–82) | .973 |
| ΔFVC, L | 0.31 (0.11–0.45) | 0.22 (0.11–0.39) | .179 |
| ΔFVC, % | 12.83 (6.95–21.13) | 9.84 (4.67–16.59) | .094 |
Data are shown as median (interquartile range) or % unless stated otherwise. FEV1: forced expiratory volume in 1s; FVC: forced vital capacity; Δ: post-bronchodilator increment.
In bold, values < .05 (statistical significance).
The sputum eosinophil level was weakly correlated with extent of FEV1 reversibility, either in terms of absolute value (r=0.162, P=.008, Fig. 1) or percentage change (r=0.134, P=.029), but was not correlated with the post-bronchodilator difference in FVC.
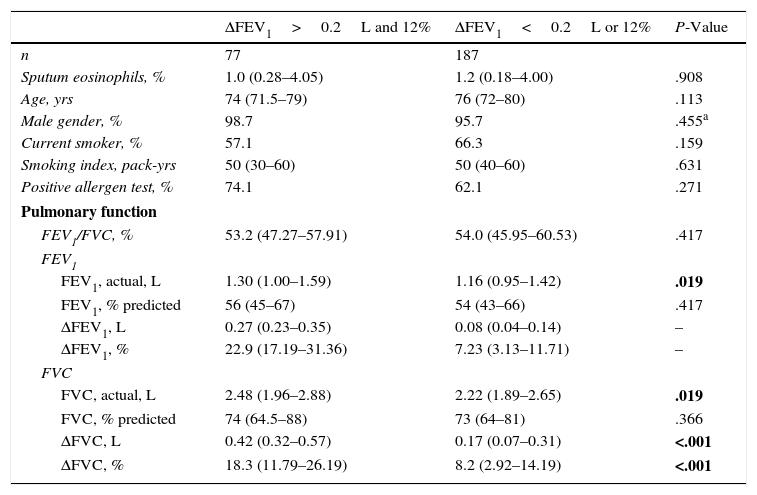
Comparisons Between Subjects With vs. Without PBT (Increase in FEV1>12% and >200ml Over Baseline).")
Subjects with a positive bronchodilator test (n=77, 29.2%) had higher baseline FEV1 and FVC and higher post-bronchodilator change in FVC compared to those with a negative bronchodilator test (Table 2). There was no significant difference in levels of sputum eosinophils, age, gender, smoking and allergy status (Table A1 in the appendix).
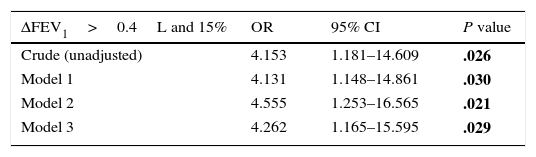
The Role of Post-bronchodilator Increment of FEV1>0.4L and >15% in Prediction of Sputum Eosinophilia (>3%) in COPD Patients.
| ΔFEV1>0.4L and 15% | OR | 95% CI | P value |
|---|---|---|---|
| Crude (unadjusted) | 4.153 | 1.181–14.609 | .026 |
| Model 1 | 4.131 | 1.148–14.861 | .030 |
| Model 2 | 4.555 | 1.253–16.565 | .021 |
| Model 3 | 4.262 | 1.165–15.595 | .029 |
OR: odds ratio; CI: confidence interval.
Model 1: adjusted for age.
Model 2: adjusted for age and baseline FEV1.
Model 3: adjusted for age, baseline FEV1 and FVC.
In bold, values < .05 (statistical significance).
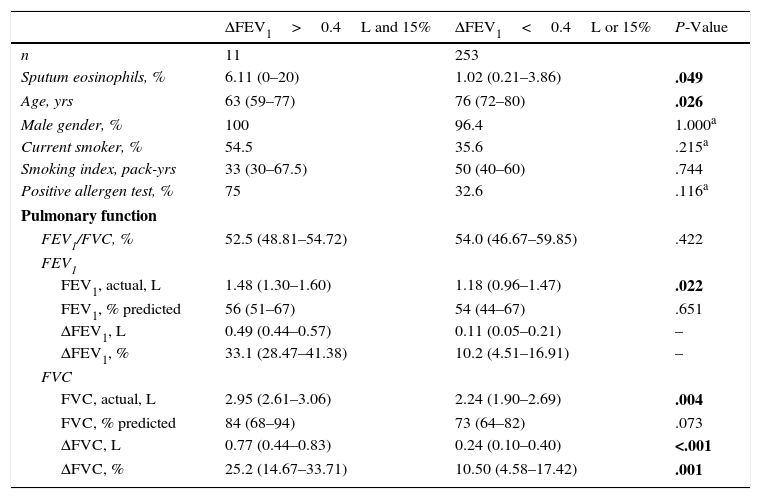
Subjects with VPBT (n=11, 4.2%) were younger, had more sputum eosinophils, higher baseline FEV1 and FVC values and post-bronchodilator FVC change compared to other subjects. However, there was no significant difference in gender, smoking and allergy status (Table 3).
Characteristics of COPD Patients With and Without Post-bronchodilator Reversibility of FEV1>0.4L and 15%.
| ΔFEV1>0.4L and 15% | ΔFEV1<0.4L or 15% | P-Value | |
|---|---|---|---|
| n | 11 | 253 | |
| Sputum eosinophils, % | 6.11 (0–20) | 1.02 (0.21–3.86) | .049 |
| Age, yrs | 63 (59–77) | 76 (72–80) | .026 |
| Male gender, % | 100 | 96.4 | 1.000a |
| Current smoker, % | 54.5 | 35.6 | .215a |
| Smoking index, pack-yrs | 33 (30–67.5) | 50 (40–60) | .744 |
| Positive allergen test, % | 75 | 32.6 | .116a |
| Pulmonary function | |||
| FEV1/FVC, % | 52.5 (48.81–54.72) | 54.0 (46.67–59.85) | .422 |
| FEV1 | |||
| FEV1, actual, L | 1.48 (1.30–1.60) | 1.18 (0.96–1.47) | .022 |
| FEV1, % predicted | 56 (51–67) | 54 (44–67) | .651 |
| ΔFEV1, L | 0.49 (0.44–0.57) | 0.11 (0.05–0.21) | – |
| ΔFEV1, % | 33.1 (28.47–41.38) | 10.2 (4.51–16.91) | – |
| FVC | |||
| FVC, actual, L | 2.95 (2.61–3.06) | 2.24 (1.90–2.69) | .004 |
| FVC, % predicted | 84 (68–94) | 73 (64–82) | .073 |
| ΔFVC, L | 0.77 (0.44–0.83) | 0.24 (0.10–0.40) | <.001 |
| ΔFVC, % | 25.2 (14.67–33.71) | 10.50 (4.58–17.42) | .001 |
Data are shown as median (interquartile range) or % unless mentioned otherwise. FEV1: forced expiratory volume in 1s; FVC: forced vital capacity; Δ: post-bronchodilator increment.
In bold, values < .05 (statistical significance).
The crude (unadjusted) odds ratio (OR) of VPBT (ΔFEV1>0.4L and 15%) to predict sputum eosinophilia was 4.153 (95% confidence interval [CI]=1.181–14.609, P=.026). VPBT independently predicted sputum eosinophilia even after serial adjustment for age, baseline FEV1 and FVC (Table 2). The fully adjusted OR was 4.262 (95% CI=1.165–15.595, P=.029, Table 2).
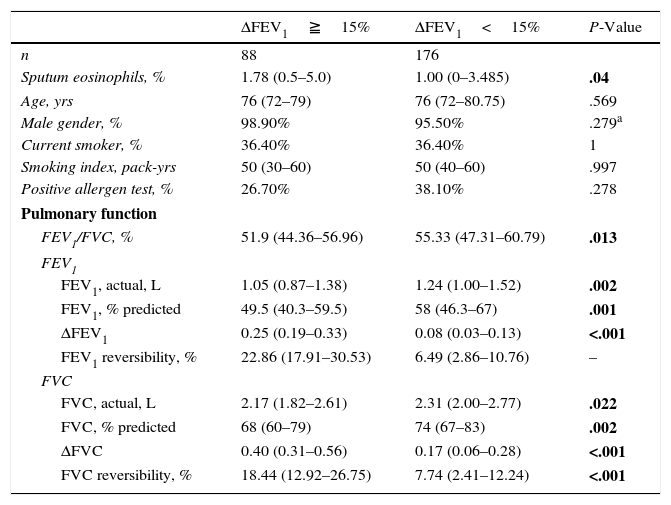
Characteristics of Subjects Dichotomized According to Post-bronchodilator FEV1 Increment Greater Than 15%When subjects were dichotomized by FEV1 increment >15% from pre-dose values (ACCP criteria for positive bronchodilator reversibility),15 a subtle albeit statistically significant difference in the levels of sputum eosinophils was observed (1.78 vs 1.00%, P=.04, Table A2 in the appendix).
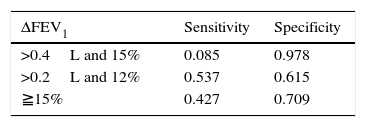
ROC Analysis Evaluating FEV1 Reversibility as a Predictor of Sputum Eosinophilia (>3%)ROC analysis showed an area under the curve of 0.58, P=.034 (Fig. 2). In prediction of sputum eosinophilia, FEV1 reversibility at the cut-off point of 0.4L had a sensitivity of 8.5% and a specificity of 97.8%. Positive and negative predictive values were 63.6% and 70.4%, respectively. The overall accuracy ([true negatives+true positives]/total patient number) was 70.1%.
. Area under the curve=0.58, P=.034.")
The sensitivity and specificity of post-bronchodilator FEV1 increment at different cut-offs is shown in Table A3 in the appendix.
DiscussionThis study showed that correlation between the sputum eosinophil level and bronchodilator reversibility was weak. Although COPD patients with VPBT (ΔFEV1>0.4L and >15%) had significantly higher levels of sputum eosinophils than those without, the ability of VPBT to predict sputum eosinophilia is modest (positive predictive value: 63.6%, overall accuracy: 70.1%). In contrast, levels of sputum eosinophils did not differ between groups when subjects were dichotomized according to the widely accepted criterion for PBT (ΔFEV1>0.2L and >12%),16 which was adopted in the GINA guidelines for asthma and the 2010 version of the GOLD guidelines for COPD.4,17
Current guidelines no longer consider the extent of bronchodilator reversibility to be beneficial in the diagnosis of COPD or the differential diagnosis with asthma, even though post-bronchodilator spirometry is required for the diagnosis and assessment of COPD.6 Bronchodilator reversibility, however, has been reappraised in the context of ACOS. In addition to sputum eosinophilia, enhanced bronchodilator reversibility determined by two different cut-offs (ΔFEV1>0.2L and >12% as PBT; ΔFEV1>0.4L and >15% as VPBT) was included in the diagnostic criteria of ACOS, recommended by the Spanish guidelines based on expert consensus.2,18 Similarly, a recent joint recommendation published by GINA and GOLD states that marked reversibility (ΔFEV1>0.4L and >12%) is compatible with diagnosis of ACOS.3
Despite the lack of universally accepted diagnostic criteria for ACOS, some features are considered to carry a higher risk for the syndrome.2,19 For instance, previous history of asthma is the most frequently mentioned characteristic of ACOS and one of most widely accepted diagnostic criteria.20,21 Apart from ACOS related to long-standing asthma, COPD with eosinophilic inflammation may constitute another important component of ACOS.22 Some small studies have shown that this subpopulation also had better response to corticosteroids and greater bronchodilator reversibility.23–26,8,27 This favorable response to treatment shows the need for characterization and early identification of such populations.28 However, attempting to identify these patients on the basis of clinical presentation can be difficult, particularly in the absence of a previous history of asthma. For this reason, we focused on COPD patients without asthma history to explore the link between bronchodilator reversibility and sputum eosinophil levels.
In this study, we demonstrated a weak correlation between bronchodilator reversibility of FEV1 and sputum eosinophil levels in COPD. Even though VPBT (>0.4L and >15%) can predict sputum eosinophilia (>3%), its yield is modest (positive predictive value: 63.6%, overall accuracy: 70.1%), and the lower prevalence of VPBT in COPD patients restricts its use. Cosio et al.29 reported a low percentage of subjects (4.7%, 39/831) with VPBT in their COPD cohort. Likewise, only 4.2% (11/264) of our patients had VPBT. The small number of patients exhibiting VPBT also contributed to a wider distribution of sputum eosinophil levels (0–20%).
To sum up, our results show that a suspicion of ACOS does not need to be based on the combination of two major criteria (VPBT plus sputum eosinophilia), in other words, patients can be identified on the basis of either of these. However, VPBT does not perfectly predict, and therefore cannot replace, sputum eosinophilia, thus justifying the presence of both measurements in the major criteria of Spanish ACOS definitions.
In our study, even though all ACOS patients included met the definition of the Spanish ACOS definition (fulfilling two major or one major plus two minor criteria), the percentage of ACOS patients in the COPD population is 6.0% (data not shown). Using the Spanish consensus guidelines as the criteria for ACOS, Miravitlles et al.30 and Golpe et al.31 estimated the prevalence of ACOS at 5.8% and 5% (of smoking-related COPD), respectively, which is similar to our data. However, this prevalence (5–6%) is far lower than the estimated percentage (15–20%) of COPD patients presenting ACOS.19 This may be explained by the exclusion of subjects with a history of asthma from our study, or the use of different definitions of ACOS. Using definitions that are either too strict or too broad causes problems in patient identification. Efforts should be made to refine definitions of ACOS and improve the availability and accuracy of diagnostic tools in order to bring these figures closer to real-world estimates. For example, Cosio et al.29 revised the Spanish ACOS definitions by substituting a blood eosinophil percentage >5% in the minor criteria for sputum eosinophilia in the major criteria, which can identify a similar percentage (13%) of ACOS patients from a COPD cohort.29 Moreover, Alcazar-Navarrete et al. evaluate dutility of the exhaled nitric oxide level in the diagnosis of COPD phenotypes, showing it to be more accurate than the bronchodilator test in the diagnosis of ACOS and COPD phenotypes.32 Apparently, blood eosinophil and exhaled nitric oxide levels are far more accessible and time/labor-saving than sputum analysis, hence facilitating their clinical application.
This study has several limitations. First, induced sputum cannot show airway inflammation as accurately as a biopsy. Despite this, induction of sputum is both inexpensive and less invasive. Secondly, the inherent within-subject variability in response to bronchodilator could contribute to inconsistent results at different measurement points, causing bias in the assessment and classification of bronchodilator reversibility.5,32 Thirdly, the cellular inflammatory profile of sputum is very likely to change with COPD medication, mostly notable corticosteroids.33 In this study, our results were derived from either newly diagnosed COPD patients or those that had not taken oral/inhaled corticosteroid for a minimum of 3 months. Whether our conclusions can be extrapolated to COPD patients receiving corticosteroid therapy may warrant further exploration. Furthermore, our subjects were mostly male, relatively older, and of Chinese ethnicity, which may be a concern with regard to external validity.
In conclusion, FEV1 reversibility and sputum eosinophil levels were weakly correlated in COPD. Very positive bronchodilator reversibility (>0.4L and >15%) may predict sputum eosinophilia (>3%), but its yield is modest.
AuthorshipDr. Perng had full access to all data in the study and takes responsibility for the integrity of the data and the accuracy of the data analysis.
Dr. Chou: contributed to study design, data acquisition, data analysis, manuscript preparation and gave approval of the final version.
Dr. Su KC: contributed to data analysis and manuscript preparation and approval.
Dr. Ko: contributed to data analysis and manuscript revision and approval.
Dr. Huang: contributed to data analysis and statistical analysis, manuscript revision and approval.
Dr. Hsiao: contributed to analysis of data, manuscript revision and approval.
Dr. Tseng: contributed to analysis of data, manuscript revision and approval.
Dr. Su VYF: contributed to acquisition, analysis and interpretation of data, manuscript revision and approval.
Dr. Perng: contributed to study design, supervision of the work, and manuscript preparation and approval.
Conflict of InterestThe authors declare that they have no conflicts of interest.

Characteristics of COPD Patients With and Without Post-bronchodilator Reversibility of FEV1 Greater Than 0.2L and 12%.
| ΔFEV1>0.2L and 12% | ΔFEV1<0.2L or 12% | P-Value | |
|---|---|---|---|
| n | 77 | 187 | |
| Sputum eosinophils, % | 1.0 (0.28–4.05) | 1.2 (0.18–4.00) | .908 |
| Age, yrs | 74 (71.5–79) | 76 (72–80) | .113 |
| Male gender, % | 98.7 | 95.7 | .455a |
| Current smoker, % | 57.1 | 66.3 | .159 |
| Smoking index, pack-yrs | 50 (30–60) | 50 (40–60) | .631 |
| Positive allergen test, % | 74.1 | 62.1 | .271 |
| Pulmonary function | |||
| FEV1/FVC, % | 53.2 (47.27–57.91) | 54.0 (45.95–60.53) | .417 |
| FEV1 | |||
| FEV1, actual, L | 1.30 (1.00–1.59) | 1.16 (0.95–1.42) | .019 |
| FEV1, % predicted | 56 (45–67) | 54 (43–66) | .417 |
| ΔFEV1, L | 0.27 (0.23–0.35) | 0.08 (0.04–0.14) | – |
| ΔFEV1, % | 22.9 (17.19–31.36) | 7.23 (3.13–11.71) | – |
| FVC | |||
| FVC, actual, L | 2.48 (1.96–2.88) | 2.22 (1.89–2.65) | .019 |
| FVC, % predicted | 74 (64.5–88) | 73 (64–81) | .366 |
| ΔFVC, L | 0.42 (0.32–0.57) | 0.17 (0.07–0.31) | <.001 |
| ΔFVC, % | 18.3 (11.79–26.19) | 8.2 (2.92–14.19) | <.001 |
Data are shown as median (interquartile range) or % unless mentioned otherwise. FEV1: forced expiratory volume in 1s; FVC: forced vital capacity; Δ: post-bronchodilator increment.
In bold, values < .05 (statistical significance).
Characteristics of COPD Patients With and Without Post-bronchodilator Reversibility of FEV1≧15%.
| ΔFEV1≧15% | ΔFEV1<15% | P-Value | |
|---|---|---|---|
| n | 88 | 176 | |
| Sputum eosinophils, % | 1.78 (0.5–5.0) | 1.00 (0–3.485) | .04 |
| Age, yrs | 76 (72–79) | 76 (72–80.75) | .569 |
| Male gender, % | 98.90% | 95.50% | .279a |
| Current smoker, % | 36.40% | 36.40% | 1 |
| Smoking index, pack-yrs | 50 (30–60) | 50 (40–60) | .997 |
| Positive allergen test, % | 26.70% | 38.10% | .278 |
| Pulmonary function | |||
| FEV1/FVC, % | 51.9 (44.36–56.96) | 55.33 (47.31–60.79) | .013 |
| FEV1 | |||
| FEV1, actual, L | 1.05 (0.87–1.38) | 1.24 (1.00–1.52) | .002 |
| FEV1, % predicted | 49.5 (40.3–59.5) | 58 (46.3–67) | .001 |
| ΔFEV1 | 0.25 (0.19–0.33) | 0.08 (0.03–0.13) | <.001 |
| FEV1 reversibility, % | 22.86 (17.91–30.53) | 6.49 (2.86–10.76) | – |
| FVC | |||
| FVC, actual, L | 2.17 (1.82–2.61) | 2.31 (2.00–2.77) | .022 |
| FVC, % predicted | 68 (60–79) | 74 (67–83) | .002 |
| ΔFVC | 0.40 (0.31–0.56) | 0.17 (0.06–0.28) | <.001 |
| FVC reversibility, % | 18.44 (12.92–26.75) | 7.74 (2.41–12.24) | <.001 |
Data are shown as median (interquartile range) or % unless noted otherwise. FEV1: forced expiratory volume in 1s; FVC: forced vital capacity; Δ: post-bronchodilator increment.
In bold, values < .05 (statistical significance).


