


Obstructive sleep apnea (OSA) is heterogeneous and complex, but its severity is still based on the apnea–hypoapnea index (AHI). The present study explores using cluster analysis (CA), the additional information provided from routine polysomnography (PSG) to optimize OSA categorization.
MethodsCross-sectional study of OSA subjects diagnosed by PSG in a tertiary hospital sleep unit during 2016–2020. PSG, demographical, clinical variables, and comorbidities were recorded. Phenotypes were constructed from PSG variables using CA. Results are shown as median (interquartile range).
Results981 subjects were studied: 41% females, age 56 years (45–66), overall AHI 23events/h (13–42) and body mass index (BMI) 30kg/m2 (27–34). Three PSG clusters were identified: Cluster 1: “Supine and obstructive apnea predominance” (433 patients, 44%). Cluster 2: “Central, REM and shorter-hypopnea predominance” (374 patients, 38%). Cluster 3: “Severe hypoxemic burden and higher wake after sleep onset” (174 patients, 18%). Based on classical OSA severity classification, subjects are distributed among the PSG clusters as severe OSA patients (AHI≥30events/h): 46% in cluster 1, 17% in cluster 2 and 36% in cluster 3; moderate OSA (15≤AHI<30events/h): 57% in cluster 1, 34% in cluster 2 and 9% in cluster 3; mild OSA (5≤AHI<15events/h): 28% in cluster 1, 68% in cluster 2 and 4% in cluster 3.
ConclusionsThe CA identifies three specific PSG phenotypes that do not completely agree with classical OSA severity classification. This emphasized that using a simplistic AHI approach, the OSA severity is assessed by an incorrect or incomplete analysis of the heterogeneity of the disorder.
Obstructive sleep apnea (OSA) is a heterogeneous and complex disease with different risk factors, pathophysiological pathways, symptoms, related comorbidities, and prognostic implications; a one-size-fits-all approach may not be worthy for all OSA patients.1,2 Nevertheless, OSA diagnosis and severity are still based on a single sleep parameter, the overall apnea–hypoapnea index (AHI) and continuous positive airway pressure (CPAP) remains the first-line therapy for the majority of patients. However, it is known that AHI alone represents a small fraction of the physiological data generated by sleep studies and it may not fully capture the polysomnographic diversity of OSA (hypoxemic burden,3,4 sleep fragmentation,5 periodic limb movements,6 event duration)7 and the heterogeneity of the disorder. This simple categorization may explain partially the lack of response to CPAP in some clinical trials.8,9
Phenotyping strategies can be broadly grouped into two analytic approaches: hypothesis-driven (or supervised) and hypothesis generating (or unsupervised).10 Cluster analysis (CA), a type of unsupervised learning methodology, can integrate multiple characteristics without priori groupings. The main objective of CA is to minimize the differences between two individuals within a same phenotype and maximize the differences between two individuals having distinct phenotypes. The present study plans to explore using CA additional information provided from the routine polysomnography (PSG) besides the AHI to optimize OSA categorization and consequently to move to a more precise and personalized treatment.
Many previous studies indicate that additional sleep parameters may be valuable to better approximate the prognostic implications of OSA. The depth and the duration of hypoxemia4 or the duration of the respiratory events7 seems to improve mortality prediction over the AHI alone. Regardless identical AHI, many specific sleep phenotypes (higher hypoxemia or periodic limb movements) are associated with higher cardiovascular risk.11 Many of those previous works were conducted in large community-based cohorts including mainly middle-aged men. Information on this topic in younger and female cohorts is lacking.
The primary objective of the present study is to explore applying CA, whether exist specific polysomnographic phenotypes based on sleep metrics besides the overall AHI that could help improving OSA categorization from routine polysomnographic recordings in a large real-life cohort of patients referred to our sleep lab due to clinical suspected OSA. Then, to contrast clinical manifestations and comorbidities among these new sleep phenotypes and to compare this novel classification with the classical AHI categorization.
MethodsStudy design and setting: Ambispective cross-sectional study at the Multidisciplinary Sleep Unit of Respiratory Medicine Department of the Hospital Universitari de Bellvitge (L’Hospitalet Llobregat, Barcelona).
Study population: Inclusion criteria: all patients aged≥18 years referred to the sleep unit due to suspected OSA studied by routine PSG during the period between 2016 and 2020. Exclusion criteria: time of sleep<180min. Total AHI<5events/h. Subjects with missing data on any polysomnographic variables were excluded due to CA requirements. Ethical aspects: All participants gave informed written consent to use data derived from routine PSG for research purpose. This document was approved by Ethics committee of our center following Data Protection and Confidentiality Code of Current EU regulation and based on applicable state endorsement (registry number: PR206/23).
Demographical and anthropometric variables: At enrollment (time of PSG), demographic (age, gender) and anthropometric characteristics (body mass index, BMI; neck circumference; waist circumference), cardiovascular risk factors (systemic hypertension, HTA; diabetes; dyslipidemia; coronary heart disease, CHD; atrial fibrillation; congestive heart failure, CHF; stroke or transient ischemic attack; and other medical comorbidities (chronic pulmonary obstructive disease, COPD; depression) were collected. OSA-related symptoms: Each patient fulfilled a questionnaire regarding OSA-related symptoms using a 4-point scale (always, frequently, sometimes, and never); excessive daytime sleepiness was assessed using Epworth Sleepiness Scale12 (ESS). Sleep variables: Sleep studies were done using routine healthcare polysomnography devices: Siesta (Compumedics, Melbourne, Australia) or Somté-PSG (Compumedics). Sleep13 and respiratory events14 were codified manually following AASM Guidelines. The following polysomnographic variables were recorded: total recording time (TRT), period between “switch off light” and “switch on light” in minutes; total sleep time (TST), the sum of all the epochs scored as sleep time in minutes; sleep latency (SL), period between “switch off lights” and the first epoch scored as sleep in minutes; sleep efficiency (SE), TST divided by TRT×100 in percentage. TST percentage for each sleep stage: NREM (non-rapid-eye movement) stage 1, NREM stage 2, NREM stage 3 and REM (rapid-eye movement) stage in percentage; and WASO (wake after sleep onset) calculated by the formula: WASO=TRT−SL−TST.
Respiratory variables were: the apnea–hypoapnea index (AHI), the sum of apneas and hypoapnes per hour of sleep as events/hour and derived variables: total AHI as the AHI calculated from the overall TST, supine-AHI calculated from the TST in supine position, non-supine-AHI calculated from the TST in non-supine position, REM-AHI calculated from REM TST and non-REM-AHI calculated from NREM TST. Additionally, apnea, hypoapnea, obstructive apnea, mixed apnea and central apnea indexes were calculated. Median and maximal length of events was calculated for all events, only for apneas, and only for hypoapneas. The degree of nocturnal desaturation was assessed by the mean percentage of sleep time with arterial oxygen saturation measured by pulse-oximetry<90% (TC<90%). Five recalculated variables were obtained: REM predominance (REM-AHI divided by NREM-AHI), supine predominance (supine-AHI divided by non-supine-AHI), WASO, hypoapnea fraction (number of hypoapneas divided by [number of apneas plus number of hypoapneas]×100) and obstructive apnea fraction [number of obstructive apneas divided by the total number of apneas]×100.
Statistical analysisCategorical variables were presented as number of cases and percentages, while continuous variables were presented as mean and standard deviation (SD) or median and interquartile range (IQR). Seven sleep variables were suitable for the CA: hypopnea fraction, WASO, maximal length of events duration, obstructive apnea fraction, REM predominance, supine predominance, and TC<90%. To define final number of clusters, dissimilarity matrix was calculated with Gower's distance. Then, hierarchical divisive clustering was performed. Hierarchical divisive clustering assumes all individuals are one big cluster and divides most dissimilar ones into separate groups. Using then Elbow and Silhouette to analyze how the within sum of squares changes for the different number of clusters, the final number of clusters chosen was 3. Once the clusters were defined, standardized mean differences were used to compare variables between clusters. Subjects were distributed based on the novel phenotyping stratification and the classical AHI severity categorization (mild OSA [5≤AHI<15events/h], moderate OSA [15≤AHI<30events/h] or severe OSA [AHI≥30events/h). All analyses were performed with a two-sided significance level of 0.05 and conducted with the use of R software version 4.1.0 (cran.r-project.org).
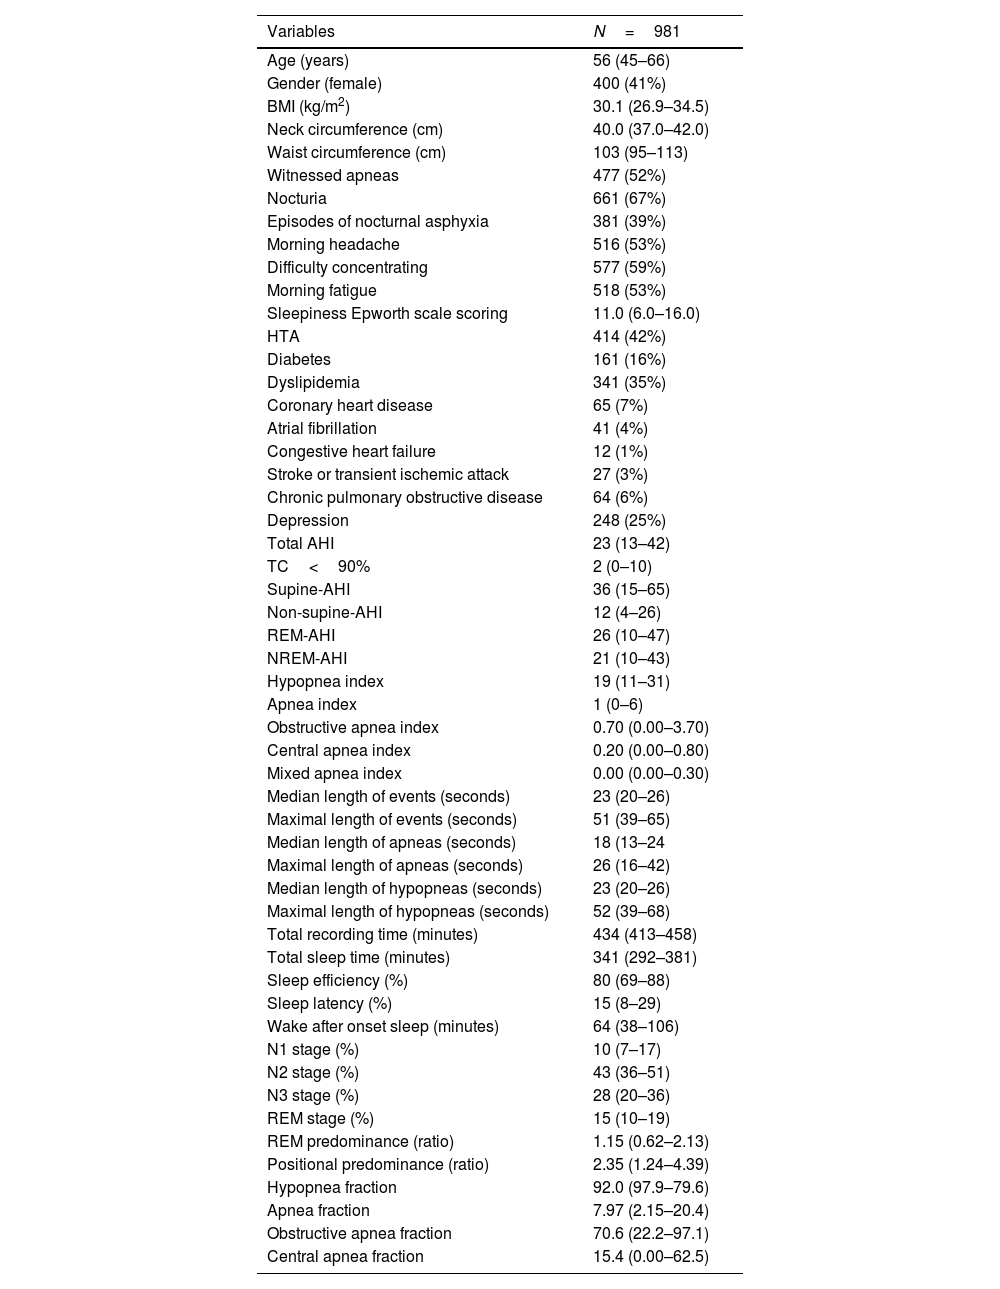
ResultsThe study population (n=981) although predominantly male, the female proportion was wide representative (41%, n=400). The cohort had an average age of 56.0 (45.0–66.0) years old, a mean total AHI of 23.3 (12.7–42.2)events/h and a mean BMI of 30.1 (26.9–34.5)kg/m2. The main characteristics of the cohort are illustrated in Table 1.
Main characteristics of the study cohort.
| Variables | N=981 |
|---|---|
| Age (years) | 56 (45–66) |
| Gender (female) | 400 (41%) |
| BMI (kg/m2) | 30.1 (26.9–34.5) |
| Neck circumference (cm) | 40.0 (37.0–42.0) |
| Waist circumference (cm) | 103 (95–113) |
| Witnessed apneas | 477 (52%) |
| Nocturia | 661 (67%) |
| Episodes of nocturnal asphyxia | 381 (39%) |
| Morning headache | 516 (53%) |
| Difficulty concentrating | 577 (59%) |
| Morning fatigue | 518 (53%) |
| Sleepiness Epworth scale scoring | 11.0 (6.0–16.0) |
| HTA | 414 (42%) |
| Diabetes | 161 (16%) |
| Dyslipidemia | 341 (35%) |
| Coronary heart disease | 65 (7%) |
| Atrial fibrillation | 41 (4%) |
| Congestive heart failure | 12 (1%) |
| Stroke or transient ischemic attack | 27 (3%) |
| Chronic pulmonary obstructive disease | 64 (6%) |
| Depression | 248 (25%) |
| Total AHI | 23 (13–42) |
| TC<90% | 2 (0–10) |
| Supine-AHI | 36 (15–65) |
| Non-supine-AHI | 12 (4–26) |
| REM-AHI | 26 (10–47) |
| NREM-AHI | 21 (10–43) |
| Hypopnea index | 19 (11–31) |
| Apnea index | 1 (0–6) |
| Obstructive apnea index | 0.70 (0.00–3.70) |
| Central apnea index | 0.20 (0.00–0.80) |
| Mixed apnea index | 0.00 (0.00–0.30) |
| Median length of events (seconds) | 23 (20–26) |
| Maximal length of events (seconds) | 51 (39–65) |
| Median length of apneas (seconds) | 18 (13–24 |
| Maximal length of apneas (seconds) | 26 (16–42) |
| Median length of hypopneas (seconds) | 23 (20–26) |
| Maximal length of hypopneas (seconds) | 52 (39–68) |
| Total recording time (minutes) | 434 (413–458) |
| Total sleep time (minutes) | 341 (292–381) |
| Sleep efficiency (%) | 80 (69–88) |
| Sleep latency (%) | 15 (8–29) |
| Wake after onset sleep (minutes) | 64 (38–106) |
| N1 stage (%) | 10 (7–17) |
| N2 stage (%) | 43 (36–51) |
| N3 stage (%) | 28 (20–36) |
| REM stage (%) | 15 (10–19) |
| REM predominance (ratio) | 1.15 (0.62–2.13) |
| Positional predominance (ratio) | 2.35 (1.24–4.39) |
| Hypopnea fraction | 92.0 (97.9–79.6) |
| Apnea fraction | 7.97 (2.15–20.4) |
| Obstructive apnea fraction | 70.6 (22.2–97.1) |
| Central apnea fraction | 15.4 (0.00–62.5) |
Abbreviations: HTA, systemic hypertension; AHI, apnea–hypoapnea index; TC<90%, the mean percentage of sleep time with arterial oxygen saturation measured by pulse-oximetry below 90%; REM, rapid-eye movement.
The dendrogram of the cluster distribution is shown in Fig. 1 with three distinct polysomnographic phenotypes.

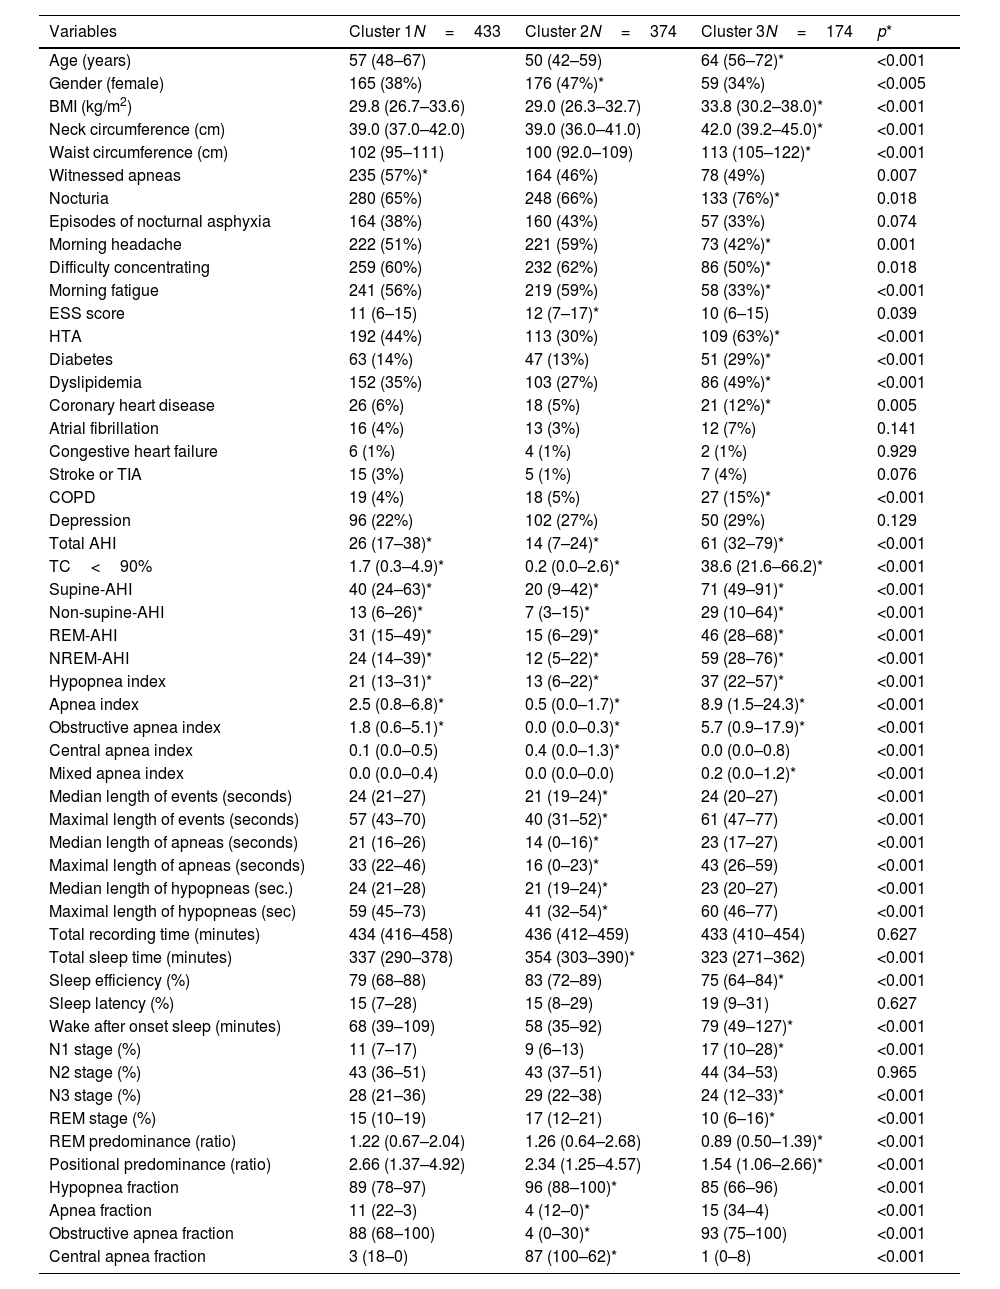
Table 2 describes and compares the main characteristics among the clusters.
General characteristics among patients assigned to the different clusters.
| Variables | Cluster 1N=433 | Cluster 2N=374 | Cluster 3N=174 | p* |
|---|---|---|---|---|
| Age (years) | 57 (48–67) | 50 (42–59) | 64 (56–72)* | <0.001 |
| Gender (female) | 165 (38%) | 176 (47%)* | 59 (34%) | <0.005 |
| BMI (kg/m2) | 29.8 (26.7–33.6) | 29.0 (26.3–32.7) | 33.8 (30.2–38.0)* | <0.001 |
| Neck circumference (cm) | 39.0 (37.0–42.0) | 39.0 (36.0–41.0) | 42.0 (39.2–45.0)* | <0.001 |
| Waist circumference (cm) | 102 (95–111) | 100 (92.0–109) | 113 (105–122)* | <0.001 |
| Witnessed apneas | 235 (57%)* | 164 (46%) | 78 (49%) | 0.007 |
| Nocturia | 280 (65%) | 248 (66%) | 133 (76%)* | 0.018 |
| Episodes of nocturnal asphyxia | 164 (38%) | 160 (43%) | 57 (33%) | 0.074 |
| Morning headache | 222 (51%) | 221 (59%) | 73 (42%)* | 0.001 |
| Difficulty concentrating | 259 (60%) | 232 (62%) | 86 (50%)* | 0.018 |
| Morning fatigue | 241 (56%) | 219 (59%) | 58 (33%)* | <0.001 |
| ESS score | 11 (6–15) | 12 (7–17)* | 10 (6–15) | 0.039 |
| HTA | 192 (44%) | 113 (30%) | 109 (63%)* | <0.001 |
| Diabetes | 63 (14%) | 47 (13%) | 51 (29%)* | <0.001 |
| Dyslipidemia | 152 (35%) | 103 (27%) | 86 (49%)* | <0.001 |
| Coronary heart disease | 26 (6%) | 18 (5%) | 21 (12%)* | 0.005 |
| Atrial fibrillation | 16 (4%) | 13 (3%) | 12 (7%) | 0.141 |
| Congestive heart failure | 6 (1%) | 4 (1%) | 2 (1%) | 0.929 |
| Stroke or TIA | 15 (3%) | 5 (1%) | 7 (4%) | 0.076 |
| COPD | 19 (4%) | 18 (5%) | 27 (15%)* | <0.001 |
| Depression | 96 (22%) | 102 (27%) | 50 (29%) | 0.129 |
| Total AHI | 26 (17–38)* | 14 (7–24)* | 61 (32–79)* | <0.001 |
| TC<90% | 1.7 (0.3–4.9)* | 0.2 (0.0–2.6)* | 38.6 (21.6–66.2)* | <0.001 |
| Supine-AHI | 40 (24–63)* | 20 (9–42)* | 71 (49–91)* | <0.001 |
| Non-supine-AHI | 13 (6–26)* | 7 (3–15)* | 29 (10–64)* | <0.001 |
| REM-AHI | 31 (15–49)* | 15 (6–29)* | 46 (28–68)* | <0.001 |
| NREM-AHI | 24 (14–39)* | 12 (5–22)* | 59 (28–76)* | <0.001 |
| Hypopnea index | 21 (13–31)* | 13 (6–22)* | 37 (22–57)* | <0.001 |
| Apnea index | 2.5 (0.8–6.8)* | 0.5 (0.0–1.7)* | 8.9 (1.5–24.3)* | <0.001 |
| Obstructive apnea index | 1.8 (0.6–5.1)* | 0.0 (0.0–0.3)* | 5.7 (0.9–17.9)* | <0.001 |
| Central apnea index | 0.1 (0.0–0.5) | 0.4 (0.0–1.3)* | 0.0 (0.0–0.8) | <0.001 |
| Mixed apnea index | 0.0 (0.0–0.4) | 0.0 (0.0–0.0) | 0.2 (0.0–1.2)* | <0.001 |
| Median length of events (seconds) | 24 (21–27) | 21 (19–24)* | 24 (20–27) | <0.001 |
| Maximal length of events (seconds) | 57 (43–70) | 40 (31–52)* | 61 (47–77) | <0.001 |
| Median length of apneas (seconds) | 21 (16–26) | 14 (0–16)* | 23 (17–27) | <0.001 |
| Maximal length of apneas (seconds) | 33 (22–46) | 16 (0–23)* | 43 (26–59) | <0.001 |
| Median length of hypopneas (sec.) | 24 (21–28) | 21 (19–24)* | 23 (20–27) | <0.001 |
| Maximal length of hypopneas (sec) | 59 (45–73) | 41 (32–54)* | 60 (46–77) | <0.001 |
| Total recording time (minutes) | 434 (416–458) | 436 (412–459) | 433 (410–454) | 0.627 |
| Total sleep time (minutes) | 337 (290–378) | 354 (303–390)* | 323 (271–362) | <0.001 |
| Sleep efficiency (%) | 79 (68–88) | 83 (72–89) | 75 (64–84)* | <0.001 |
| Sleep latency (%) | 15 (7–28) | 15 (8–29) | 19 (9–31) | 0.627 |
| Wake after onset sleep (minutes) | 68 (39–109) | 58 (35–92) | 79 (49–127)* | <0.001 |
| N1 stage (%) | 11 (7–17) | 9 (6–13) | 17 (10–28)* | <0.001 |
| N2 stage (%) | 43 (36–51) | 43 (37–51) | 44 (34–53) | 0.965 |
| N3 stage (%) | 28 (21–36) | 29 (22–38) | 24 (12–33)* | <0.001 |
| REM stage (%) | 15 (10–19) | 17 (12–21) | 10 (6–16)* | <0.001 |
| REM predominance (ratio) | 1.22 (0.67–2.04) | 1.26 (0.64–2.68) | 0.89 (0.50–1.39)* | <0.001 |
| Positional predominance (ratio) | 2.66 (1.37–4.92) | 2.34 (1.25–4.57) | 1.54 (1.06–2.66)* | <0.001 |
| Hypopnea fraction | 89 (78–97) | 96 (88–100)* | 85 (66–96) | <0.001 |
| Apnea fraction | 11 (22–3) | 4 (12–0)* | 15 (34–4) | <0.001 |
| Obstructive apnea fraction | 88 (68–100) | 4 (0–30)* | 93 (75–100) | <0.001 |
| Central apnea fraction | 3 (18–0) | 87 (100–62)* | 1 (0–8) | <0.001 |
Abbreviations: ESS, Epworth sleepiness scale; HTA, systemic hypertension; TIA, transient ischemic attack; COPD, chronic obstructive pulmonary disease; AHI, apnea–hypoapnea index; TC<90%, the mean percentage of sleep time with arterial oxygen saturation measured by pulse-oximetry below 90%; REM, rapid-eye movement.
Cluster 1: “Supine and obstructive apnea predominance cluster” (44.14% of the cohort). Subjects in this cluster had a moderate median AHI value (26events/h, IQR 17–38) and mild nocturnal hypoxia (median TC<90% 1.7, IQR 0.3–4.9). They have a well-structured sleep based on WASO, sleep efficacy and latency and percentage of sleep stages. Main respiratory events are hypopneas (89% of all events) and obstructive apneas (88% of all apneas) with a moderate length duration of events (maximal and median length values are 57 and 24s, respectively). They have a significant supine predominance (median supine-AHI of 40events/h compared with median non-supine-AHI of 13events/h, position predominance value of 2.66) and a moderate REM predominance (median REM-AHI and median NREM-AHI of 31events/h and 24events/h, respectively, REM predominance of 1.22). This cluster is characterized by middle-aged subjects with an overweight or mild obesity, male predominance, higher percentage of witnessed apneas and moderate cardiovascular risk profile.
Cluster 2: “Central, REM and shorter-hypopnea predominance cluster” (38.12% of the cohort). Subjects in this cluster had a mild median AHI value (14events/h, IQR 7–24events/h) with minimal nocturnal hypoxia (median TC<90% 0.2, IQR 0.0–2.6). They have also a well-structured sleep based on WASO, sleep efficacy and latency and percentage of sleep stages. Main respiratory events are hypopneas (96% of all events) and from apnea fraction (4%), 87% are central apneas. Regarding length duration of events, this cluster has the shortest maximal and median values (for all respiratory events: 40s and 21s; specifically for apneas, maximal and median length values are 16s and 14s, respectively). Like cluster 1, this cluster has a significant supine predominance (median supine-AHI, median non-supine-AHI and supine predominance value are 20events/h, 7events/h and 2.34, respectively). They also have even a more REM predominance than cluster 1 (median REM-AHI, median NREM-AHI and REM predominance ratio value 15events/h, 12events/h and 1.26, respectively). Younger subjects characterize this cluster with overweight or mild obesity, higher female representation (47%), and more percentage of unrefreshing sleep complaints and less cardiovascular comorbidity.
Cluster 3: “Severe hypoxemic burden and higher WASO cluster” (17.74% of the cohort). Subjects in this cluster had the highest median AHI values (61events/h, IQR 32–79events/h) with severe nocturnal hypoxia (median TC<90% 38.6, IQR 21.6–66.2). They have the worse structured sleep based on WASO, sleep efficacy and latency and percentage of sleep stages. Main respiratory events are hypopneas (85% of all events) and from apnea fraction (5%), 93% are obstructive apneas. Regarding length duration of events, there is no significant difference between cluster 1 and 3 (median values: 24s in cluster 1 vs 24s in cluster 3; maximal values: 57s in cluster 1 vs 61s in cluster 3). This cluster has also supine predominance but significant lesser than cluster 1 and 2 (median supine-AHI, median non-supine-AHI and supine predominance value are 71events/h, 29events/h and 1.54, respectively). Unlike the other clusters, the cluster 3 has NREM predominance (median REM-AHI, median NREM-AHI and REM predominance ratio value 46events/h, 59events/h and 0.89, respectively). This cluster is characterized by older age with moderate to severe obesity, male predominance, classical OSA complaints, specially nocturia and the worst comorbidity profile (cardiovascular and non-cardiovascular). Excessive daytime sleepiness based on ESS did not differ between clusters.
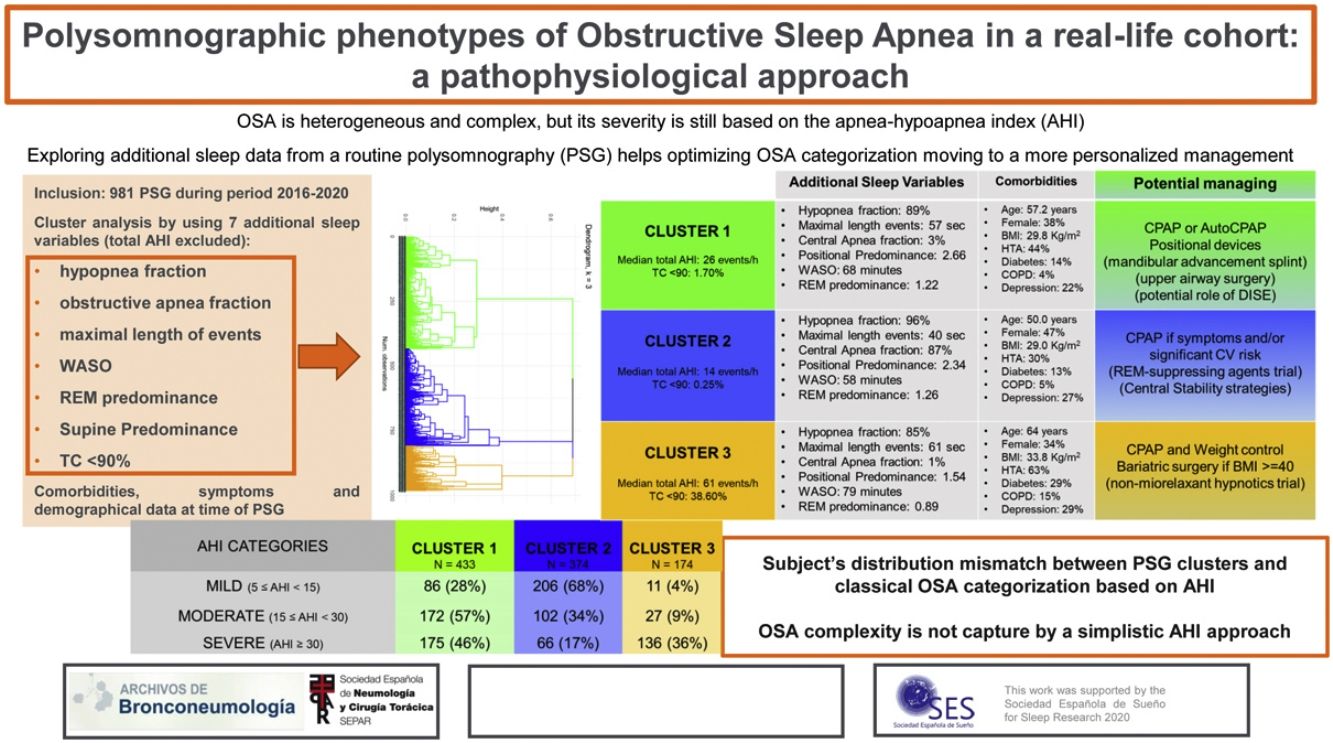
Fig. 2 summarizes the main sleep complaints, comorbidities, and sleep study data of patients among clusters and their potential implications in OSA management.

Main sleep complaints, comorbidities, and sleep study results of patients among clusters and their potential implications in OSA management. Abbreviations: AHI, apnea–hypoapnea index; WASO, wake after sleep onset; REM, rapid-eye movement; TC<90%, the mean percentage of sleep time with arterial oxygen saturation measured by pulse-oximetry below 90%; BMI, body mass index; HTA, systemic hypertension; TIA, transient ischemic attack; COPD, chronic obstructive pulmonary disease; CPAP, continuous positive airway pressure; DISE, drug induced sleep endoscopy; CV, cardiovascular.
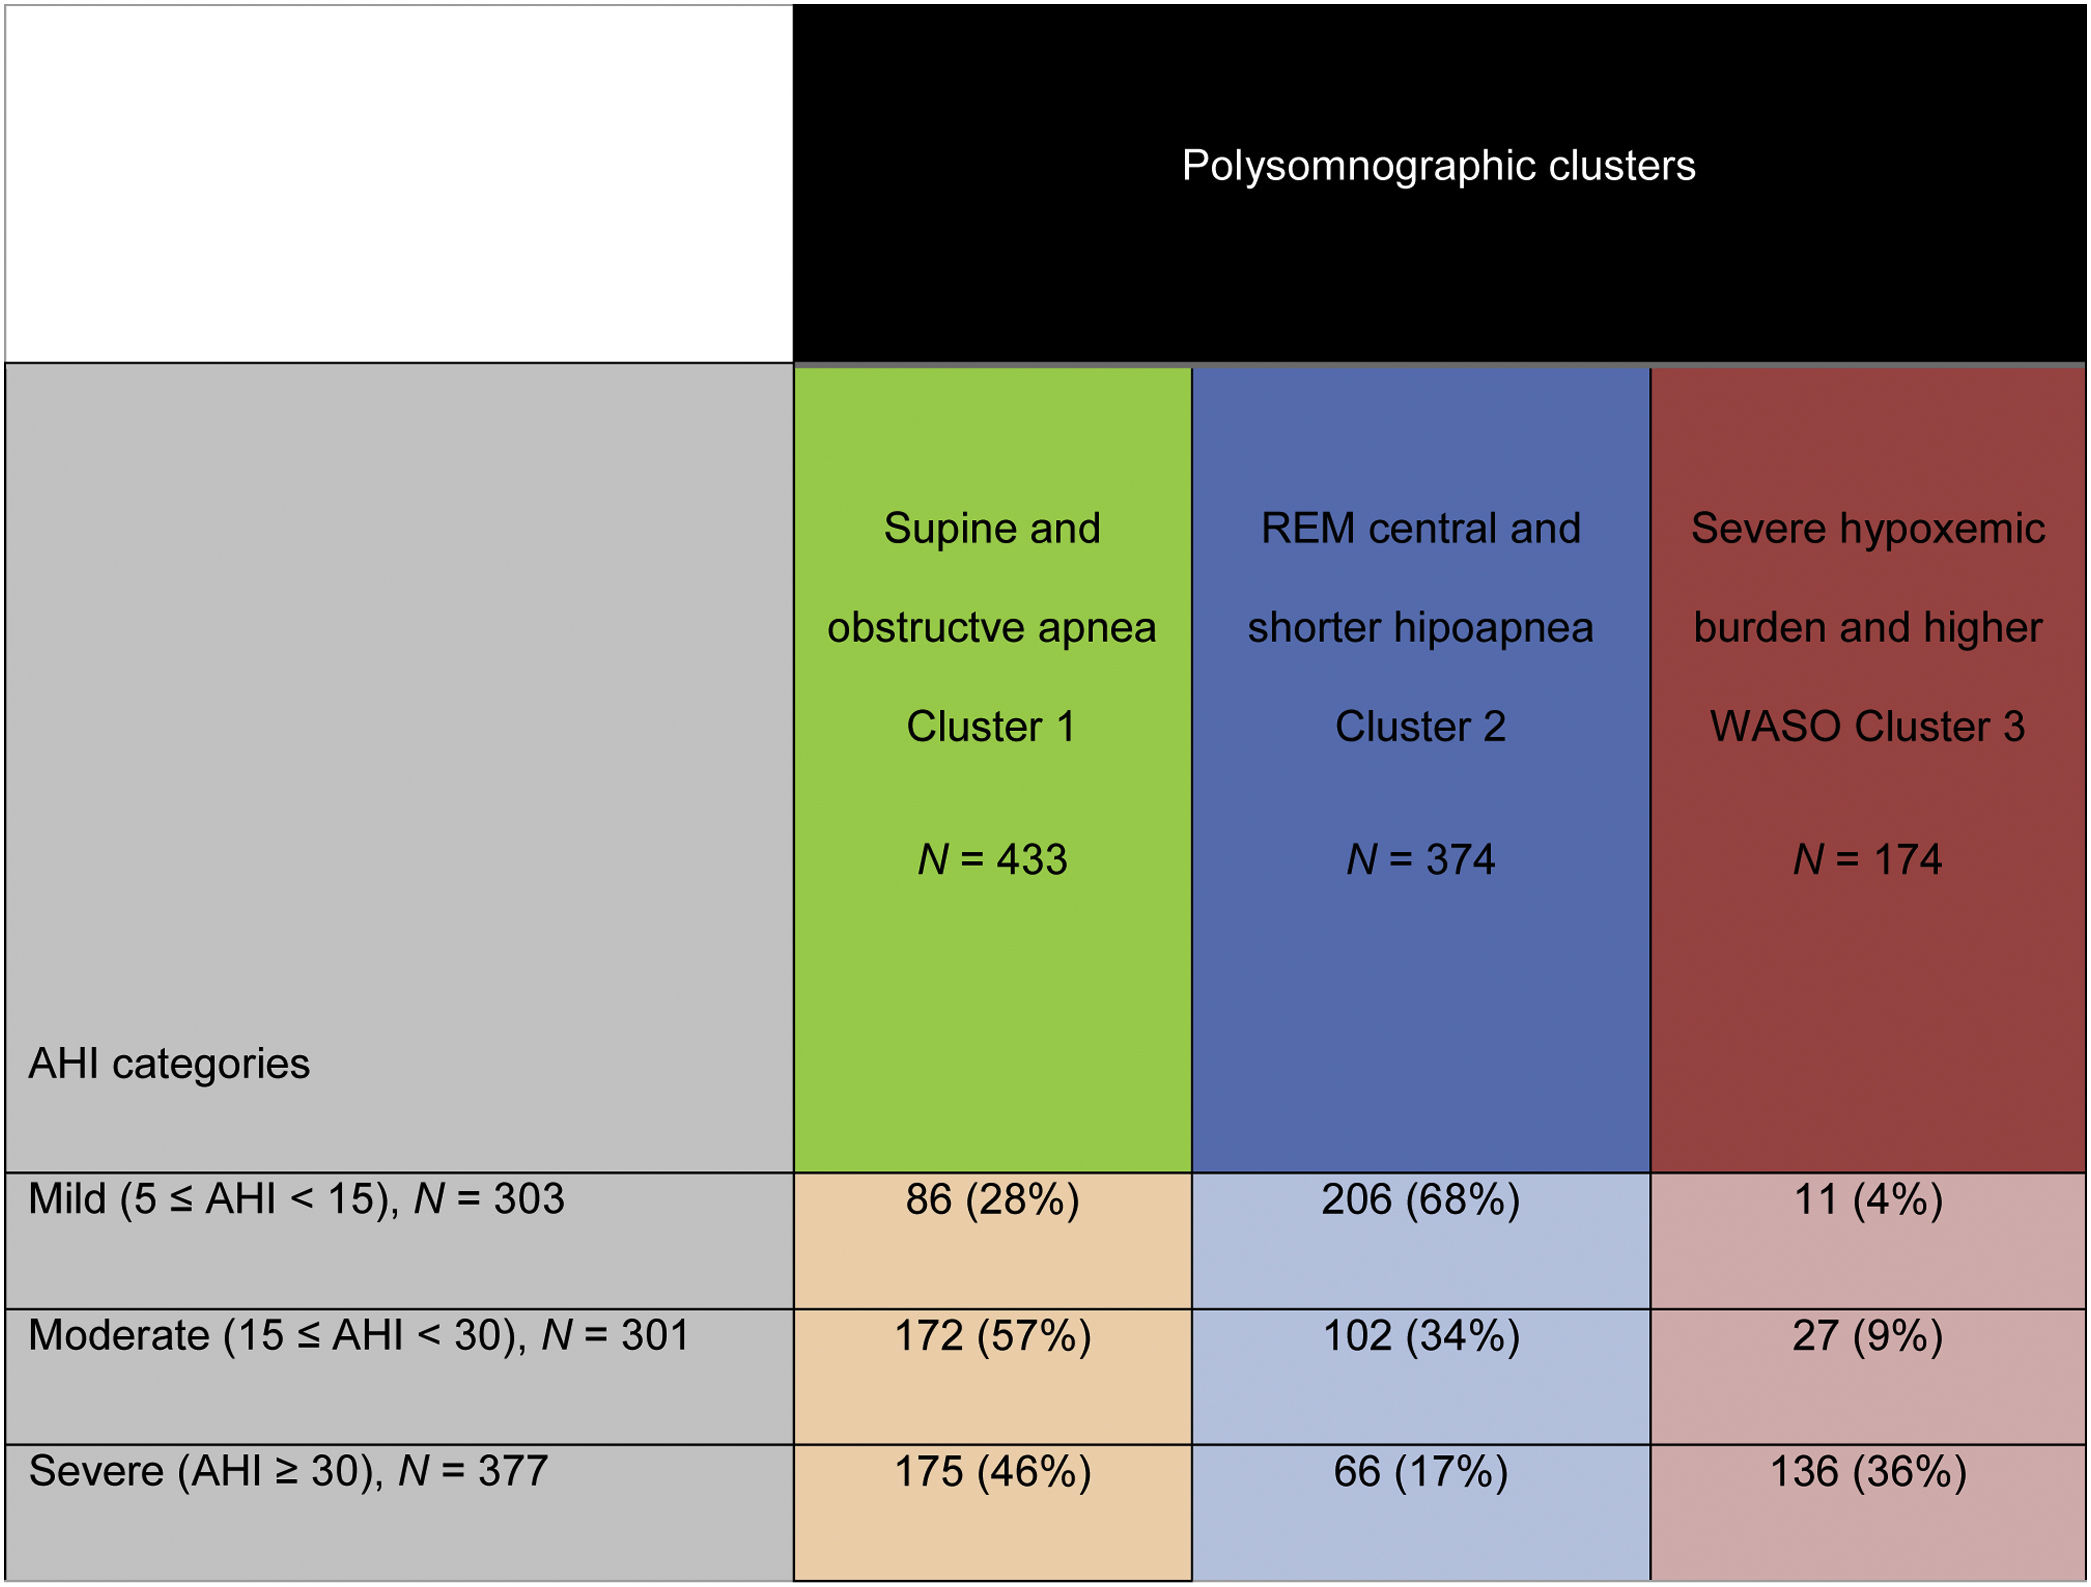
Patient's distribution based on conventional AHI categories and based on the present polysomnographic cluster analysis is shown in Table 3. Subjects classified as severe OSA based on the AHI classification are distributed among the three-polysomnographic clusters (<50% within any cluster): 46% in cluster 1, 17% in cluster 2 and 36% in cluster 3. Many subjects categorized as moderate OSA are distributed in the “supine and obstructive apnea” cluster (57%) but more than one-third (34%) are identified in the “REM central and shorter-hypopnea” cluster and 9% in the “Severe hypoxemic burden and higher WASO” cluster. Most of patients classified as mild OSA are distributed in the “REM central and shorter-hypopnea” cluster (68%) but 28% are included in the “supine and obstructive apnea” Cluster and 4% in the “Severe hypoxemic burden and higher WASO” cluster.
Discussion
Using practical available data and unsupervised analytic methods, we identified three specific polysomnographic clusters in a real-life cohort studied by PSG due to suspected OSA. From a simplistic point of view, cluster 3 (“Severe hypoxemic burden and higher WASO cluster”) is closer to the severe OSA category based on the classical AHI classification, cluster 1 (“Supine and obstructive apnea cluster”) is equal to the moderate OSA category and cluster 2 (“Central, REM and shorter-hypopnea cluster”) coincide with the mild OSA category. However, many subjects considered as severe OSA are labelled in cluster 1 and few others in cluster 2. Moreover, not all patients categorized as moderate OSA are identified in cluster 1 and not all patients considered as mild OSA are included in cluster 2. The present work highlights that if we consider only the AHI to determine OSA severity, we may not collect the polysomnographic heterogenicity of the disorder and hence, consequently we could not offer the best treatment for each patient. From clinical practice, the present work pretends to generate hypothesis for future approaches to define distinct PSG patterns that offer more information than the AHI alone as the unique deterministic polysomnographic parameter. In these misclassified patients, OSA severity and hence, OSA management may be under or over-estimated according to conventional AHI classification making less benefit of CPAP therapy because it is not the best treatment for them. Nevertheless, future studies focused on longitudinal assessment as well as on response to therapy are crucial to answer this issue.
There are at least four key traits of phenotypes that contribute to OSA pathogenesis: pharyngeal collapsibility, poor muscle compensation, ventilatory instability (high loop gain), and arousability from sleep (low arousal threshold).16 Over the past decade and in recent years in particular, major steps towards have been focused on moving from one-size-fits-all management approach to a more precision and customized approach.17 But the sleep research laboratories capable to phenotype OSA patients are available only in few centers and the procedures are time-consuming and require expertise. Moreover, this physiopathology approach will not be available in clinical routine in the near future. Therefore, there is growing concern to analyze in more detail the information provided by the routine PSG to move closer to a better understanding of polysomnographic patterns/traits that brings indirect data related to distinct OSA pathological pathways not captured by the AHI. This pragmatic approach offers the background for polycentric studies in the clinical setting.
Based on this practical approach, many previous works have been published on this topic. Many of them construct PSG phenotypes of OSA and explore differences between these phenotypes on demographic, clinical manifestations, and comorbidities.18–20 Many others construct mixed phenotypes including sleep and clinical variables.21–24 Recently few large cohorts associated specific PSG phenotypes with strong outcomes15 (incident global mortality associated only in “severe hypoxia” Cluster, incident diabetes in “hypopnea and hypoxia” and “PLMS” subgroups, major adverse cardiovascular events in “higher TC 90% OSA” cluster that is reduced by regular CPAP compliance). Joosten et al.18 studied 1184 OSA subjects (mean AHI 15±7events/h, mean age 51±13 years, mean BMI 30.3±6kg/m2) showing that OSA heterogenicity is based on body position and sleep stage but not on classical AHI categorization. However, this study was limited to mild–moderate OSA subjects (AHI between 5 and 30events/h) and other additional PSG variables besides sleep stage and body position were not recorded. Lacedonia et al.19 studied 198 OSA patients (AHI>5events/h) by polygraphy adding TC<90%, oxygen desaturation index, arterial blood gases and lung functional items to perform CA. They did not find differences in the prevalence of cardiovascular comorbidities among clusters. Authors suggested that the small number of subjects and the final available variables were limited reducing the potential statistical power. Like the present work, Nakayama et al.20 identified three clusters in 210 moderate–severe OSA men with significant variations in polysomnographic variables depending on sleep stage and body position and with clear distinct apnea type among groups. Zinchuck et al.11 studied 1247 PSG from a U.S. Veteran cohort (mean AHI 25±30events/h, mean age 58±12 years, mean BMI 34.6±7.3kg/m2, 95% men) identifying seven distinct physiological phenotypes. Only three clusters (“periodic limb movement of sleep”, “hypopnea and hypoxia” and “combined severe”) were associated with higher risk of adverse cardiovascular outcomes. By contrast, this risk was not captured when subjects were categorized by conventional OSA severity classification. Most of the mentioned works11,20 included mainly male cohorts with little female representation missing the gender effect. Many others8,19 analyze few additional variables instead of all possible variables available in a routine PSG losing notable information. The present cohort, including subjects with a broad overall AHI spectrum (median 23events/h, IQR 13–42) and with a significant female proportion (n=400, 41%) still shows heterogenous PSG traits among clusters supporting that OSA complexity certainly is not captured by the AHI alone. From our results we hypothesized that subjects identified in cluster 3 but classified as mild OSA (AHI 5–15events/h) may have higher global burden than presumed and subjects identified in cluster 2 but classified as severe OSA (AHI≥30events/h) may have less burden than assumed.
Respect strengths and limitations: (1) There is no longitudinal assessment with no data on management implications; its observational design attempt to generate new hypothesis using available signals from routine PSG to help identifying PSG patterns that may be closer to specific and plausible OSA pathological pathways. (2) Subjects included are those where PSG was indicated in clinical practice probably due to additional complex comorbidities that interfere in sleep (depression, insomnia, fibromyalgia, etc.). Thus, results could not be extrapolated to subjects where OSA diagnosis could be confirmed by validated simplified sleep tests. (3) Difficulties to assess sleep fragmentation. Sleep efficiency, latency or sleep stages percentages are a limited view of heterogenous sleep physiology. From the available data, we choose a composite variable (WASO=TRT−SL−TST) because although it is not able to distinguish between different patterns of sleep fragmentation, it brings more information than any other related variables alone. Furthermore, WASO is easily recorded in any PSG in real-life.
ConclusionsThe present cluster analysis identifies three specific polysomnographic phenotypes from a large cohort referred to sleep lab due to OSA suspicious by a routine PSG. The distribution of subjects within the PSG phenotypes does not completely agree with distribution of subjects based on OSA severity categories based on classical AHI classification. This emphasized that using a simplistic AHI approach, the OSA severity is assessed by an incorrect or incomplete analysis of the heterogeneity of the disorder.
Authors’ contributionsAll authors contributed substantially to this study. MG participated in study design, acquisition, analysis, and interpretation of data, and in the elaboration of the manuscript. MG and SP had full access to all the data in the study and take responsibility for the integrity and the accuracy of the data analysis. EF, SP and EP participated in acquisition of data. NP participated in study analysis performing cluster analysis. CM, NS and SS participated in study design, interpretation of data and in the revision of the final manuscript. All authors read and approved the final manuscript.
Statement of ethicsAll subjects studied in our sleep unit before performing any sleep study gave informed written consent to use their clinical data derived from routine sleep studies for research purpose. This document was approved by the ethics committee of our center following the Data Protection and Confidentiality Code of the current EU regulation and based on the applicable state endorsement.
Data availability statementAll data generated or analyzed during this study are included in this article. Further inquiries can be addressed to the corresponding author.
FundingThis work was supported by the Sociedad Española de Sueño (Grant for Sleep Research 2020 to MG as principal investigator).
Conflict of interestAny of the authors participating in this manuscript has conflicts of interest to declare.
The authors are grateful to all participants and staff of Bellvitge's sleep unit to make possible this study.
The following are the supplementary data to this article:


