


The definition of asthma phenotypes has not been fully established, neither there are cluster studies showing homogeneous results to solidly establish clear phenotypes. The purpose of this study was to develop a classification algorithm based on unsupervised cluster analysis, identifying clusters that represent clinically relevant asthma phenotypes that may share asthma-related outcomes.
MethodsWe performed a multicentre prospective cohort study, including adult patients with asthma (N=512) from the MEGA study (Mechanisms underlying the Genesis and evolution of Asthma). A standardised clinical history was completed for each patient. Cluster analysis was performed using the kernel k-groups algorithm.
ResultsFour clusters were identified. Cluster 1 (31.5% of subjects) includes adult-onset atopic patients with better lung function, lower BMI, good asthma control, low ICS dose, and few exacerbations. Cluster 2 (23.6%) is made of adolescent-onset atopic asthma patients with normal lung function, but low adherence to treatment (59% well-controlled) and smokers (48%). Cluster 3 (17.1%) includes adult-onset patients, mostly severe non-atopic, with overweight, the worse lung function and asthma control, and receiving combination of treatments. Cluster 4 (26.7%) consists of the elderly-onset patients, mostly female, atopic (64%), with high BMI and normal lung function, prevalence of smokers and comorbidities.
ConclusionWe defined four phenotypes of asthma using unsupervised cluster analysis. These clusters are clinically relevant and differ from each other as regards FEV1, age of onset, age, BMI, atopy, asthma severity, exacerbations, control, social class, smoking and nasal polyps.
The classification of asthma severity in the guidelines establishes levels based on the symptoms, treatment, lung function, and the control of the disease. Using this classification, a similar treatment was proposed for all patients in each level, without taking into account the heterogeneity of the individuals in each severity level.1,2 This approach has some weaknesses when applied in routine clinical practice, since it is unable to identify which patients respond to a particular treatment,3,4 or who is at risk of developing life-threatening exacerbations, which may even be observed in patients classified as ‘mild’.5
The need to better classify such a heterogeneous group of patients has seemingly become clearer, which may be because there is access to best tools in order to identify diverse characteristics of the disease and due to the need to use new treatments efficiently.6–9 Identifying asthma phenotypes could improve knowledge of the disease's underlying pathophysiology and the prognostic factors, as well as optimise the personalisation of the treatment, which is associated with high socioeconomic costs.6,10,11 The definition of these phenotypes has not yet been fully established, and has even been modified at short notice, gaining expert approval. Thus, the latest Spanish Guidelines for the Management of Asthma (GEMA) have modified the classification into severe asthma phenotypes, rejecting the one associated with obesity, which was consolidated in the previous version.2
Cluster analysis uses a group of variables to define patient subgroups that share specific critical characteristics. However, there are still no cluster studies available up until now that have shown homogeneous results with the ability to solidly establish clear phenotypes. Previous cluster analysis studies have shown significant differences among them, in both patient inclusion criteria and in the variables analysed or in the results obtained.8,12–16 Furthermore, reproducibility studies are crucial to the advancement of science.17 With this in mind, it seems reasonable to advocate the need to continue with research in this area by including more variables which allow the definition of identified clusters and its clinical applicability to improve.8,9,12
Previous results for the MEGA Study (Mechanisms underlying the Genesis and evolution of Asthma) supported the greatest prevalence of chronic rhinosinusitis with nasal polyps (CRSwNP), severe rhinitis, anxiety, depression, gastroesophageal reflux and bronchiectasis in patients with severe asthma.18,19 Similarly, some treatable traits such as obesity and anxiety seem to have a decisive impact on asthma control and quality of life.20
The aim of our study is to gain more of an understanding of asthma's heterogeneity and to develop a classification algorithm based on unsupervised cluster analysis, identifying and characterising clusters that may represent clinically relevant asthma phenotypes. Furthermore, we have tested the hypothesis that patients included in a given cluster share asthma-related health outcomes.
MethodsWe have conducted a multicentre prospective cohort study including consecutive patients with asthma from eight hospitals in Spain. Standard data collection methods were used in all of the participating centres with an electronic database.18,19
We included patients consecutively, via the outpatient clinic of the participant institutions, with asthma who were between 18 and 75 years old and who were diagnosed at least 1 year before inclusion based on the Global Initiative for Asthma (GINA) criteria. Patients were excluded if they had other acute or chronic active lung disorders. All patients signed an informed consent form.1,18,19
A standardised clinical history was completed for each patient.18,19 Validated Spanish versions of the following questionnaires were administered: the Asthma Control Test (ACT),18 the Asthma Quality of Life Questionnaire (Mini-AQLQ),18 the Sino-Nasal Outcome Test 22 (SNOT-22)18 and the Hospital Anxiety and Depression Scale (HADS).18
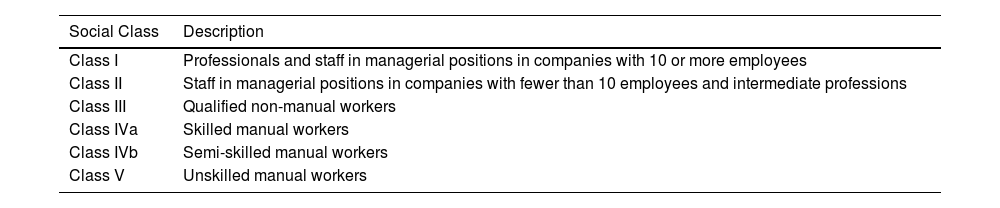
All study subjects underwent a detailed clinical examination, including body mass index (BMI) and respiratory function tests (baseline spirometry, the bronchodilator test, lung volume measurement by plethysmography, fraction of exhaled nitric oxide [FeNO], and the CO transfer test [DLCO] using the single-breath method), in accordance with the recommendations of the European Respiratory Society.21,22 The methacholine challenge (PC20) was performed at baseline.18,23 Chest X-ray and skin prick tests (SPT) with common aeroallergens were performed at the beginning of the study.18 Atopy was defined as the presence of at least one positive SPT or aeroallergen-specific immunoglobulin E (IgE) in serum associated with compatible symptoms.18,19 The social class was classified into 6 levels in accordance with the criteria set by the Spanish Society of Epidemiology (Table 1).18
Classification into Social Class in Accordance With Spanish Society of Epidemiology Criteria.
| Social Class | Description |
|---|---|
| Class I | Professionals and staff in managerial positions in companies with 10 or more employees |
| Class II | Staff in managerial positions in companies with fewer than 10 employees and intermediate professions |
| Class III | Qualified non-manual workers |
| Class IVa | Skilled manual workers |
| Class IVb | Semi-skilled manual workers |
| Class V | Unskilled manual workers |
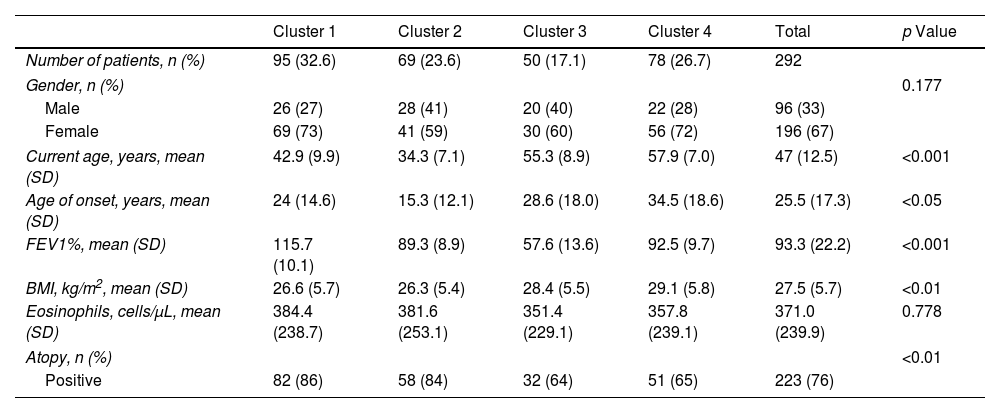
In order to define the clusters, we selected seven variables (gender, current age, age onset of asthma, FEV1, body mass index, blood eosinophil count and atopy) that were considered to be of special relevance by a multidisciplinary team of project investigators, choosing parameters that were highly relevant for evaluating asthma patients, widely available in real-life clinical practice and that have shown a significant impact on earlier cluster studies (Table 2). We also added variables that we classified into 4 groups associated with asthma disease, social aspects, comorbidities and treatment (Tables 3–6).
Variables for Cluster Modelling. Differences Between Clusters.
| Cluster 1 | Cluster 2 | Cluster 3 | Cluster 4 | Total | p Value | |
|---|---|---|---|---|---|---|
| Number of patients, n (%) | 95 (32.6) | 69 (23.6) | 50 (17.1) | 78 (26.7) | 292 | |
| Gender, n (%) | 0.177 | |||||
| Male | 26 (27) | 28 (41) | 20 (40) | 22 (28) | 96 (33) | |
| Female | 69 (73) | 41 (59) | 30 (60) | 56 (72) | 196 (67) | |
| Current age, years, mean (SD) | 42.9 (9.9) | 34.3 (7.1) | 55.3 (8.9) | 57.9 (7.0) | 47 (12.5) | <0.001 |
| Age of onset, years, mean (SD) | 24 (14.6) | 15.3 (12.1) | 28.6 (18.0) | 34.5 (18.6) | 25.5 (17.3) | <0.05 |
| FEV1%, mean (SD) | 115.7 (10.1) | 89.3 (8.9) | 57.6 (13.6) | 92.5 (9.7) | 93.3 (22.2) | <0.001 |
| BMI, kg/m2, mean (SD) | 26.6 (5.7) | 26.3 (5.4) | 28.4 (5.5) | 29.1 (5.8) | 27.5 (5.7) | <0.01 |
| Eosinophils, cells/μL, mean (SD) | 384.4 (238.7) | 381.6 (253.1) | 351.4 (229.1) | 357.8 (239.1) | 371.0 (239.9) | 0.778 |
| Atopy, n (%) | <0.01 | |||||
| Positive | 82 (86) | 58 (84) | 32 (64) | 51 (65) | 223 (76) | |
n: number of patients; SD: standard deviation; FEV1%: forced expiratory volume in the first second (percentage of reference value); BMI: body mass index; Atopy positive: prick test or radioallergosorbent test positive.
Variables Related to Asthma Disease. Differences Between Clusters.
| Cluster 1 | Cluster 2 | Cluster 3 | Cluster 4 | Total | p Value | |
|---|---|---|---|---|---|---|
| Number of patients, n (%) | 95 (32.6) | 69 (23.6) | 50 (17.1) | 78 (26.7) | 292 | |
| Asthma duration, years, mean (SD) | 18.9 (12.8) | 19.0 (12.1) | 26.7 (16.3) | 23.4 (17.3) | 21.5 (14.8) | <0.01 |
| Asthma severity at diagnosis, n (%) | ||||||
| Intermittent | 23 (24) | 6 (9) | 1 (2) | 12 (15) | 42 (14) | <0.001 |
| Mild | 26 (27) | 22 (32) | 5 (10) | 20 (26) | 73 (25) | |
| Moderate | 28 (29) | 19 (27) | 23 (46) | 19 (24) | 89 (31) | |
| Severe | 18 (19) | 22 (32) | 21 (42) | 27 (35) | 88 (30) | |
| Current asthma severity, n (%) | ||||||
| Intermittent | 11 (12) | 1 (2) | 0 | 3 (4) | 15 (5) | <0.001 |
| Mild | 27 (28) | 14 (20) | 1 (2) | 12 (15) | 54 (19) | |
| Moderate | 37 (39) | 27 (39) | 17 (34) | 25 (32) | 106 (36) | |
| Severe | 20 (21) | 27 (39) | 32 (64) | 38 (49) | 117 (40) | |
| Asthma control, n (%) | ||||||
| Controlled | 65 (69) | 41 (59) | 18 (36) | 41 (53) | 165 (57) | <0.001 |
| Not controlled | 14 (15) | 15 (22) | 9 (18) | 21 (27) | 59 (20) | |
| Partially controlled | 15 (16) | 13 (19) | 23 (46) | 16 (21) | 67 (23) | |
| Severe exacerbations (last 3 years), n (%) | ||||||
| 0 | 72 (76) | 40 (58) | 24 (48) | 44 (56) | 180 (62) | <0.01 |
| 1 | 8 (8) | 19 (28) | 11 (22) | 12 (15) | 50 (17) | |
| ≥2 | 15 (16) | 10 (14) | 15 (30) | 21 (29) | 61 (21) | |
| Exacerbations last year, n (%) | ||||||
| 0 | 62 (65) | 41 (59) | 20 (40) | 42 (54) | 165 (56) | NS |
| 1 | 12 (13) | 14 (20) | 10 (20) | 8 (10) | 44 (15) | |
| ≥2 | 21 (22) | 14 (20) | 20 (40) | 28 (36) | 83 (28) | |
| Lifetime hospital admissions due to asthma (ICU excluded), n (%) | ||||||
| 0 | 78 (83) | 44 (64) | 26 (55) | 52 (67) | 200 (69) | <0.01 |
| 1 | 11 (12) | 12 (17) | 9 (19) | 10 (13) | 42 (15) | |
| ≥2 | 5 (5) | 13 (19) | 12 (26) | 16 (20) | 45 (16) | |
| Hospital admissions due to asthma last year (ICU excluded), n (%) | ||||||
| 0 | 90 (95) | 64 (93) | 42 (86) | 67 (86) | 263 (90) | NS |
| 1 | 4 (4) | 4 (6) | 4 (8) | 8 (10) | 20 (7) | |
| ≥2 | 1 (1) | 1 (1) | 3 (6) | 3 (4) | 8 (3) | |
| Lifetime ICU admissions due to asthma, n (%) | ||||||
| 0 | 93 (99) | 63 (91) | 41 (84) | 66 (86) | 263 (91) | <0.001 |
| 1 | 1 (1) | 5 (7) | 7 (14) | 6 (8) | 19 (7) | |
| ≥2 | 0 | 1 (1) | 1 (2) | 5 (6) | 7 (2) | |
| FVC%, mean (SD) | 117.6 (10.8) | 98.2 (13.4) | 81.8 (16.8) | 100.6 (14.3) | 103.0 (17.9) | <0.001 |
| FEV1/FVC, mean (SD) | 99 (0.1) | 92 (0.1) | 76 (0.2) | 93 (0.1) | 92 (0.1) | <0.001 |
| RV%, mean (SD) | 109.4 (24.8) | 104.5 (30.1) | 109.0 (31.5) | 113.3 (17.8) | 109.0 (25.4) | NS |
| DLCO%, mean (SD) | 100.8 (16.7) | 97.8 (18.5) | 86.5 (17.7) | 101.2 (16.8) | 98.6 (17.6) | NS |
| FeNO, mean (SD), ppb | 51.4 (49.6) | 40.0 (39.2) | 38.9 (27.3) | 39.1 (26.0) | 42.4 (36.5) | NS |
| ACT, mean (SD) | 21.7 (4.0) | 20.2 (4.2) | 19.0 (4.7) | 20.0 (5.4) | 20.4 (4.6) | <0.001 |
| Mini-AQLQ, mean (SD) | 5.7 (1.3) | 5.6 (1.0) | 5.1 (1.2) | 5.4 (1.3) | 5.5 (1.2) | <0.05 |
n: number of patients; SD: standard deviation; ICU: intensive care unit; FVC%: forced vital capacity (percentage of reference value); RV: residual volume; DLCO: diffusing capacity for carbon monoxide; FeNO: fractional exhaled nitric oxide; ACT: asthma control test; AQLQ: Asthma Quality of Life Questionnaire; NT: not signficant.
Comorbidities. Differences Between Clusters.
| Cluster 1 | Cluster 2 | Cluster 3 | Cluster 4 | Total | p Value | |
|---|---|---|---|---|---|---|
| Number of patients, n (%) | 95 (32.6) | 69 (23.6) | 50 (17.1) | 78 (26.7) | 292 | |
| Smokers, n (%) | ||||||
| Current | 7 (7) | 7 (10) | 2 (4) | 3 (4) | 19 (7) | <0.05 |
| Former | 18 (19) | 19 (28) | 16 (32) | 33 (42) | 86 (30) | |
| Never | 62 (66) | 39 (57) | 27 (54) | 32 (41) | 160 (55) | |
| Passive (cohabiting) | 7 (7) | 3 (4) | 5 (10) | 10 (13) | 25 (9) | |
| NSAID intolerance, n (%) | ||||||
| Yes | 16 (17) | 16 (23) | 11 (22) | 18 (23) | 61 (21) | NS |
| Rhinitis, n (%) | ||||||
| Yes | 63 (66) | 46 (67) | 33 (67) | 48 (62) | 190 (65) | NS |
| Nasal polyps, n (%) | ||||||
| Yes | 30 (32) | 12 (17) | 20 (41) | 28 (36) | 90 (31) | <0.05 |
| Gastroesophageal reflux, n (%) | ||||||
| Yes | 19 (20.0) | 10 (16.9) | 7 (16.3) | 17 (27.9) | 53 (18.1) | NS |
| Diabetes, n (%) | ||||||
| Yes | 1 (1) | 0 (0) | 4 (8) | 9 (11.5) | 14 (4.8) | <0.01 |
| Heart disease, n (%) | ||||||
| Yes | 2 (2.1) | 1 (1.4) | 2 (4.0) | 4 (5.1) | 9 (3.1) | NS |
| Hypelipidemia, n (%) | ||||||
| Yes | 7 (7.4) | 1 (1.4) | 12 (24.0) | 20 (25.6) | 40 (13.7) | <0.01 |
| Obesity, n (%) | ||||||
| Yes | 16 (16.8) | 13 (18.8) | 12 (24.0) | 25 (32.0) | 66 (22.6) | NS |
| Psychiatric disease, n (%) | ||||||
| Yes | 7 (7.4) | 6 (8.7) | 8 (16.0) | 22 (28.2) | 43 (14.7) | <0.05 |
| IgE, IU/mL, mean (SD) | 154 (84) | 140 (91) | 175 (82) | 148 (93) | 152 (88) | NS |
| Depression, n (%) | ||||||
| Borderline | 6 (7) | 4 (6) | 5 (10) | 9 (12) | 24 (9) | NS |
| Normal | 80 (89) | 62 (91) | 40 (82) | 60 (81) | 242 (86) | |
| Abnormal | 4 (4) | 2 (3) | 4 (8) | 5 (7) | 15 (5) | |
| Anxiety, n (%) | ||||||
| Borderline | 17 (19) | 17 (25) | 14 (29) | 18 (24) | 66 (23) | NS |
| Normal | 57 (63) | 39 (57) | 29 (59) | 41 (55) | 166 (59) | |
| Abnormal | 16 (18) | 12 (18) | 6 (12) | 15 (20) | 49 (17) | |
| SNOT-22, mean (SD) | 27.1 (20.6) | 28.8 (19.7) | 29.0 (16.4) | 30.0 (23.1) | 28.6 (20.4) | NS |
NSAID: non-steroidal anti-inflammatory drug; IU: international units; SD: standard deviation; SNOT: sino-nasal outcome test; NT: not signficant.
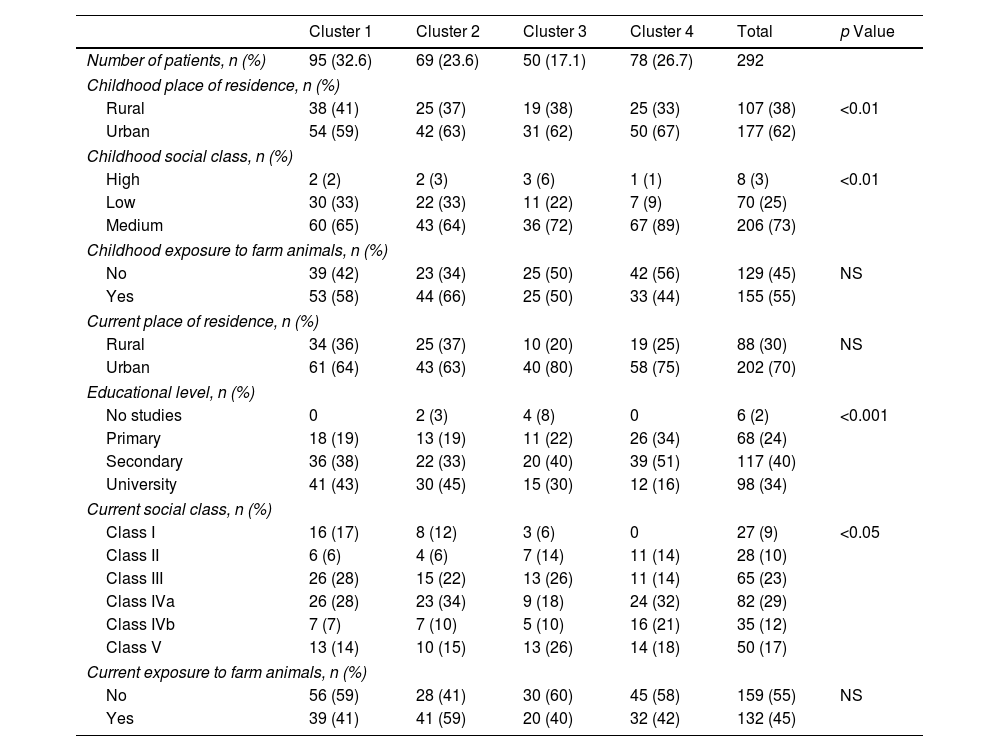
Social Factors. Differences Between Clusters.
| Cluster 1 | Cluster 2 | Cluster 3 | Cluster 4 | Total | p Value | |
|---|---|---|---|---|---|---|
| Number of patients, n (%) | 95 (32.6) | 69 (23.6) | 50 (17.1) | 78 (26.7) | 292 | |
| Childhood place of residence, n (%) | ||||||
| Rural | 38 (41) | 25 (37) | 19 (38) | 25 (33) | 107 (38) | <0.01 |
| Urban | 54 (59) | 42 (63) | 31 (62) | 50 (67) | 177 (62) | |
| Childhood social class, n (%) | ||||||
| High | 2 (2) | 2 (3) | 3 (6) | 1 (1) | 8 (3) | <0.01 |
| Low | 30 (33) | 22 (33) | 11 (22) | 7 (9) | 70 (25) | |
| Medium | 60 (65) | 43 (64) | 36 (72) | 67 (89) | 206 (73) | |
| Childhood exposure to farm animals, n (%) | ||||||
| No | 39 (42) | 23 (34) | 25 (50) | 42 (56) | 129 (45) | NS |
| Yes | 53 (58) | 44 (66) | 25 (50) | 33 (44) | 155 (55) | |
| Current place of residence, n (%) | ||||||
| Rural | 34 (36) | 25 (37) | 10 (20) | 19 (25) | 88 (30) | NS |
| Urban | 61 (64) | 43 (63) | 40 (80) | 58 (75) | 202 (70) | |
| Educational level, n (%) | ||||||
| No studies | 0 | 2 (3) | 4 (8) | 0 | 6 (2) | <0.001 |
| Primary | 18 (19) | 13 (19) | 11 (22) | 26 (34) | 68 (24) | |
| Secondary | 36 (38) | 22 (33) | 20 (40) | 39 (51) | 117 (40) | |
| University | 41 (43) | 30 (45) | 15 (30) | 12 (16) | 98 (34) | |
| Current social class, n (%) | ||||||
| Class I | 16 (17) | 8 (12) | 3 (6) | 0 | 27 (9) | <0.05 |
| Class II | 6 (6) | 4 (6) | 7 (14) | 11 (14) | 28 (10) | |
| Class III | 26 (28) | 15 (22) | 13 (26) | 11 (14) | 65 (23) | |
| Class IVa | 26 (28) | 23 (34) | 9 (18) | 24 (32) | 82 (29) | |
| Class IVb | 7 (7) | 7 (10) | 5 (10) | 16 (21) | 35 (12) | |
| Class V | 13 (14) | 10 (15) | 13 (26) | 14 (18) | 50 (17) | |
| Current exposure to farm animals, n (%) | ||||||
| No | 56 (59) | 28 (41) | 30 (60) | 45 (58) | 159 (55) | NS |
| Yes | 39 (41) | 41 (59) | 20 (40) | 32 (42) | 132 (45) | |
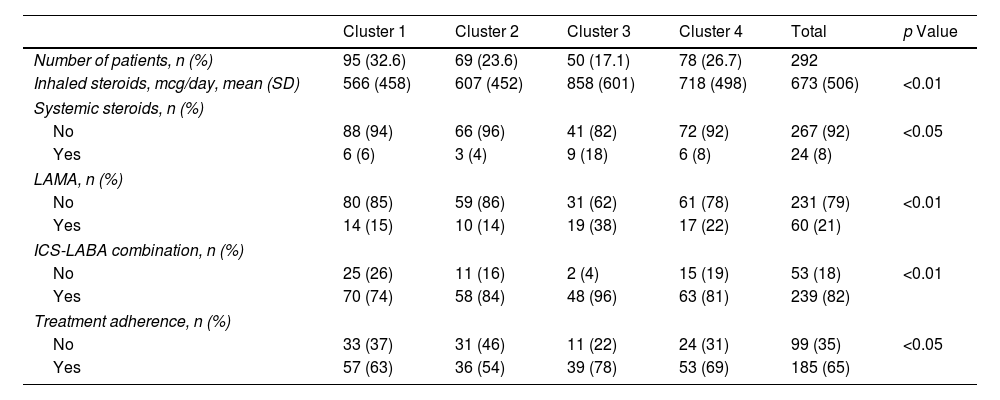
Treatment. Differences Between Clusters.
| Cluster 1 | Cluster 2 | Cluster 3 | Cluster 4 | Total | p Value | |
|---|---|---|---|---|---|---|
| Number of patients, n (%) | 95 (32.6) | 69 (23.6) | 50 (17.1) | 78 (26.7) | 292 | |
| Inhaled steroids, mcg/day, mean (SD) | 566 (458) | 607 (452) | 858 (601) | 718 (498) | 673 (506) | <0.01 |
| Systemic steroids, n (%) | ||||||
| No | 88 (94) | 66 (96) | 41 (82) | 72 (92) | 267 (92) | <0.05 |
| Yes | 6 (6) | 3 (4) | 9 (18) | 6 (8) | 24 (8) | |
| LAMA, n (%) | ||||||
| No | 80 (85) | 59 (86) | 31 (62) | 61 (78) | 231 (79) | <0.01 |
| Yes | 14 (15) | 10 (14) | 19 (38) | 17 (22) | 60 (21) | |
| ICS-LABA combination, n (%) | ||||||
| No | 25 (26) | 11 (16) | 2 (4) | 15 (19) | 53 (18) | <0.01 |
| Yes | 70 (74) | 58 (84) | 48 (96) | 63 (81) | 239 (82) | |
| Treatment adherence, n (%) | ||||||
| No | 33 (37) | 31 (46) | 11 (22) | 24 (31) | 99 (35) | <0.05 |
| Yes | 57 (63) | 36 (54) | 39 (78) | 53 (69) | 185 (65) | |
n: number of patients; SD: standard deviation; LAMA: long-acting muscarinic antagonist; ICS: inhaled corticosteroids; LABA: long acting beta agonist.
This research project has been approved by the Clinical Research Ethics Committee of all the hospitals participating in the study.
Statistical AnalysisThe cluster analysis was carried out using the kernel k-groups algorithm, a calculation of the similarity between the elements of each cluster using the energy distance. The Alpha coefficient was selected with a value equal to 1, and the number of clusters was fixed at k=4. The variables introduced in the algorithm to define the clusters can be seen in Table 2. Next, we described the characteristics of the new phenotypes in a wider group of variables (Tables 3–6). To do this, we carried out a descriptive analysis whereby the mean and variance of the patients of each cluster were calculated in the continuous variables, and the percentage of each category was reported as categorical variables. Using these variables with the distance components (DISCO) test, we tried to establish whether there were any statistically significant differences in the 4 clusters formed by each one of the mentioned variables. A p-value <0.05 was considered significant.
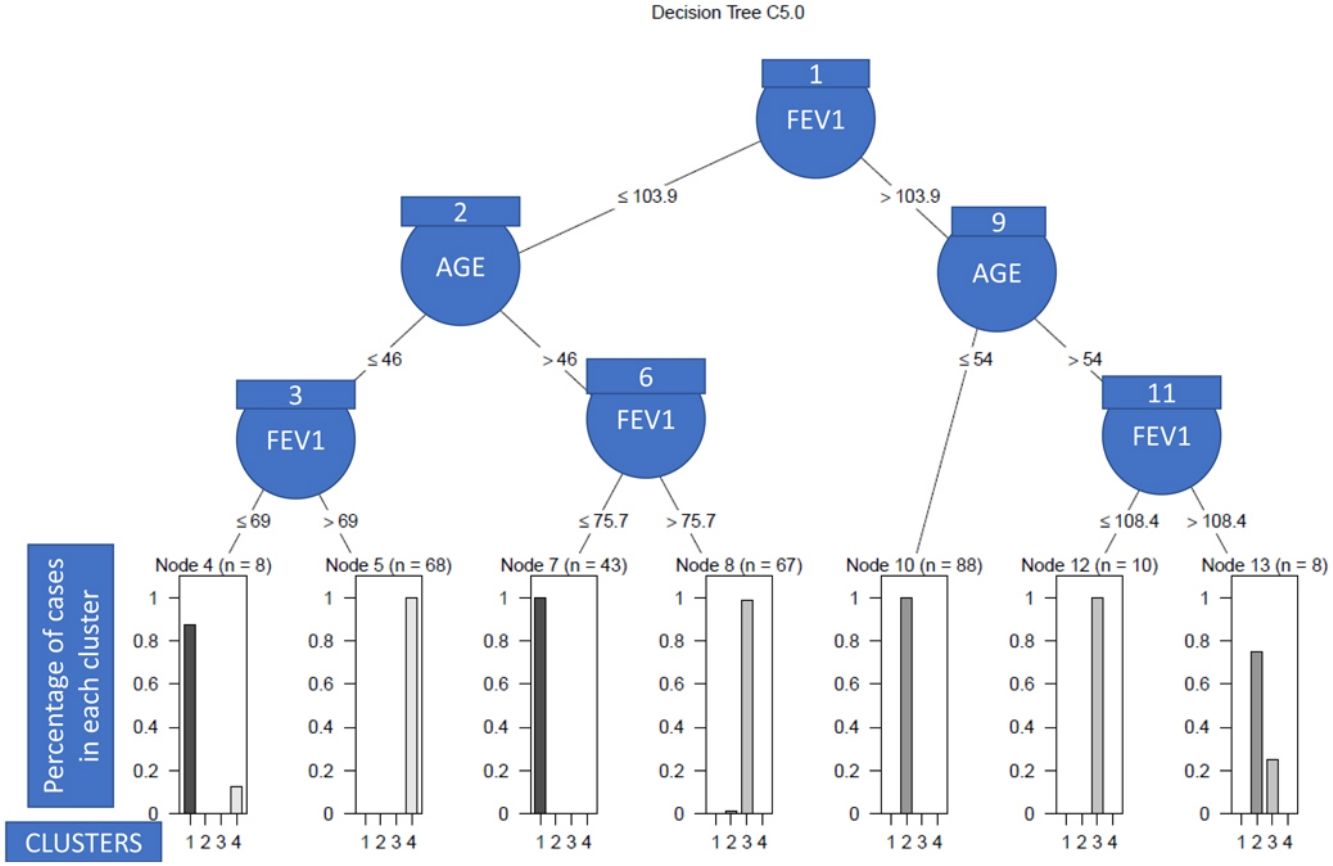
Finally, to obtain a set of clinical decision rules that should explain the differences between the patients that make up the different clusters, a C.50 classification tree was fitted using the variables that defined the clusters.24
All the statistical analyses were carried out using the R 3.4.5 statistics software. The k-groups algorithm, in addition to the DISCO test, can be freely used from the R energy package, while the C.50 classification algorithm has been set using the R C.50 package.
ResultsA total of 512 patients were included in the MEGA cohort, with a mean age of 47.3 years, 66.2% of whom were female (Table 2). For the cluster study, we included 292 patients for whom all the data required for the study was available.
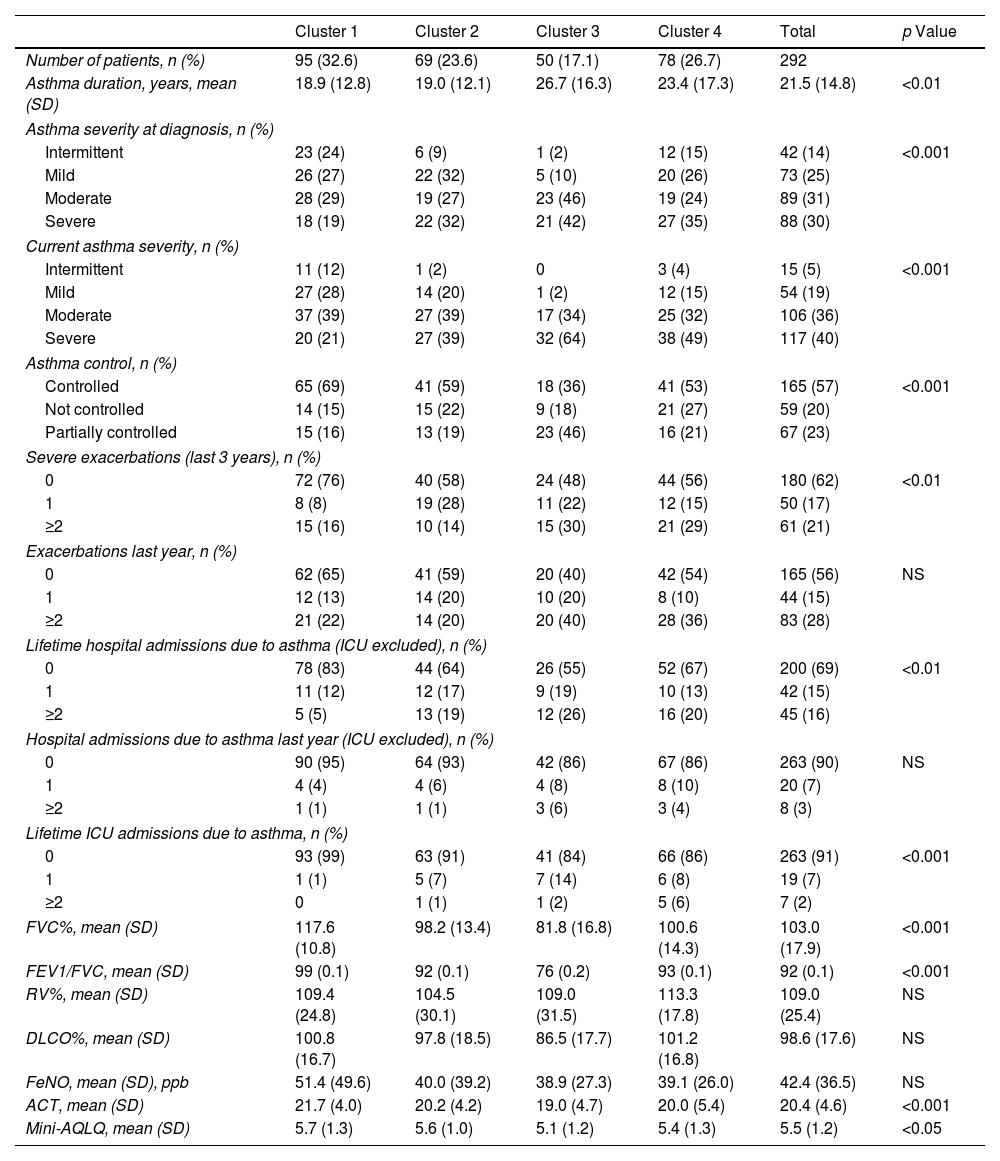
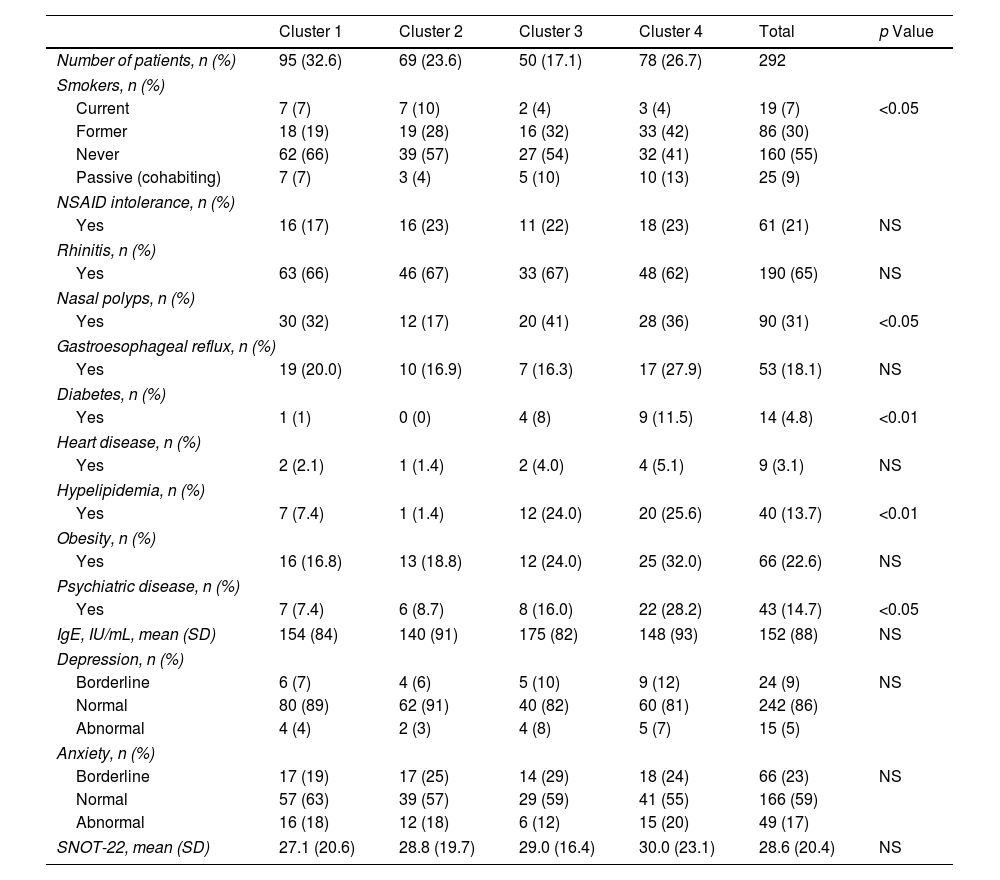
We identified 4 clusters which were all significantly different from each other as regards FEV1, age of asthma onset, current age of patients, BMI and atopy. No major variations were observed between clusters either for gender or for blood eosinophil count (BEC), exceeding 300cells/μL in all groups (Table 2). Nevertheless, notable differences were found among the clusters for certain asthma characteristics such as severity, exacerbations and asthma control. There were also widespread dissimilarities for other variables such as level of studies, social class, smoking and nasal polyps as well as other comorbidities (Tables 3–6).
Cluster 1 was the largest group with 32.5% of the patients. It was noted for adult-onset asthma, better lung function, more atopy and less overweight. Most of cluster 1 patients were university graduates, less likely to be smokers, in a lower social class in childhood, with better asthma control and fewer exacerbations. They were also prescribed lower doses of inhaled corticosteroids (ICS) and had a better quality of life.
Cluster 2 included 23.6% of the patients, with younger age, adolescent onset asthma, normal lung function, and a high percentage of atopy, 59% being well-controlled. Like in cluster 1, they were brought up in a lower social class as children, but formed the highest percentage of individuals with tertiary education qualifications. Most of these patients were smokers and 48% were obese, but only 17% had CRSwNP. As for treatment, it was the cluster with the lowest use of long-term anticholinergics and systemic corticosteroids and with the least adherence to treatment.
Cluster 3 was the smallest cluster and included 17.1% of the all the patients, with worse lung function, less atopy, who were of advanced age, with adult-onset asthma and were overweight. These were the patients that had had asthma for the longest, with the highest figures in the following areas: percentage belonging to low social classes, prevalence of CRSwNP, severity of asthma, exacerbation rates, admissions to the intensive care unit, adherence to treatment and use of long-acting muscarinic antagonists (LAMA), systemic corticosteroids (SCSs), ICS and long-acting beta-agonist (LABA) combinations. They also had the lowest quality of life and the least control of the disease. It was the only cluster with a mean ACT <20.
Cluster 4 included 26.7% of patients that were the oldest, with the highest age of asthma onset and BMI and normal lung function, 64% of whom had atopy and the majority of whom were female. Although most patients in this cluster came from a medium-high social class in childhood, they now had a less privileged social situation and comorbidity; the cluster also had the lowest percentage of patients with school-leaving or tertiary qualifications, the most smokers, and the highest prevalence of psychiatric comorbidity and vascular risk factors.
As we can see in Fig. 1, in order to explain what the clinical variables were and their cut-off points that enabled the patients to be discriminated between clusters with a high degree of accuracy, we only needed the post-bronchodilation FEV1 and the age of the patient to correctly classify 98% of the individuals included in the study. Specifically, the patients with low lung function were assigned to clusters 2 and 3 (see nodes 1–8), and the rest to clusters 1 and 4 (nodes 9–13). More nodes than clusters were observed due to the overlapping between patients of different clusters, which in turn was due to the heterogeneity. Thus, so that the algorithm had a high predictive capacity, it was necessary to construct more terminal nodes than clusters.
Discussion
Seven variables were applied to an unsupervised cluster approach, with four distinct clusters being identified. The current age of the patient and lung function were the parameters with the greatest capacity for discriminating between the clusters, although significant differences were observed regarding the age of onset, BMI and atopy. A predominance of females and high BEC (greater than 300cells/μL) were common in all the clusters, but with no significant differences between them.
A predominance of females who were overweight was observed, and around one third were smokers or ex-smokers, similar to other Western populations.13,15,25–27
In relation to the severity of the asthma, the majority (76% of the total) of patients had moderate-severe disease, which varied between 60% in cluster 1 and 98% in cluster 4, with most being atopic, usually associated with milder forms of the disease.14 This high percentage of moderate-severe patients was probably owing to the patients having been recruited from specialised asthma units, as was the case with another study carried out in Primary Care in Spain where the percentage of patients with moderate-severe asthma (37.2%) was lower.25
Most women in adult asthma studies have been constant, which has been associated with factors such as high susceptibility to environmental contaminants, hormonal impact on airway inflammation, the differing distributions of body fat between genders and a higher remission rate of asthma in males.28–30
Taking the BEC into account, other similar studies evaluating patients in real life conditions displayed levels greater than 292cells/μL in all the clusters identified.14,16 In our population, this result was to be expected, given that most of our patients had moderate-severe asthma, which is associated with high counts of these cells.31,32
Seventy-six percent of our patients were atopic, in line with most studies.13,15 Atopy prevalence differed significantly between the clusters, less so in patients with the most severe asthma and, as a result, it seems reasonable to include it so as to describe the phenotypes. In our study, 37% of the patients were smokers or ex-smokers, as was observed in asthma patients managed in Primary Care in Spain.25 These patients have often been excluded from asthma studies, but smoking is fairly common in asthmatics, and as such it more accurately reflects the real world.16,25,27 Likewise, it is known that smoking influences the course of the disease, causing more severe forms of asthma, a greater decline in lung function, more exacerbations, and a poorer response to corticosteroids.16,27,33
Cluster 1 was similar to cluster 1 of the Severe Asthma Research Program (SARP) “benign asthma” cohort study by Haldar et al.13,15 These patients had the best lung function and quality of life, least severity, and the lowest hospital admissions. This finding supports a low prevalence of factors associated with a poor prognosis of asthma as there were few smokers, little obesity, many tertiary qualifications and little psychiatric comorbidity.27,34–36
Cluster 2 showed characteristics similar to cluster 1 (early-onset atopic asthma) of the UK cohort and cluster 2 of Moore.13,15 This group of young patients with normal lung function but with a high percentage of obesity, highlighted that they were the group with the least adherence to treatment. It is known that low severity and young age are associated with low adherence.37,38
The patients of cluster 3 were the most severe, with the least atopy and with adult-onset asthma, similar to cluster 5 of the SARP cohort.15 In agreement with other authors,11 despite having the highest severity, they did not have the most hospital admissions or exacerbations in the past year. This could be due to a good control of the disease in severe asthma under SCSs, since the beneficial impact of these drugs for severe asthma is well known.39 The 41% of patients in this cluster had CRSwNP, a comorbidity associated with the most severe form of asthma, which backed up the results of our study.40 This relationship seems to lead to different underlying endotypes and could be useful in routine clinical practice, since patients with asthma and CRSwNP have a different type 2 inflammation and molecular signatures, and a dissimilar response to treatment with monoclonal antibodies when compared with asthmatic patients without nasal polyposis.41
Cluster 4 was characterised by elderly onset asthma, predominance of females, normal lung function and elevated BMI, which was similar to cluster 3 of the SARP cohort15 and to the inflammation predominance cluster of the study by Haldar et al.,13 even though in the latter, there was a predominance of males.13,15 In the study by Moore et al.,15 that cluster had the most patients with arterial hypertension, as occurred in our study. Those patients had the lowest qualification levels, and the highest prevalence of smoking and comorbidities, psychiatric illnesses in particular, which were twice as high as any of the other clusters. The relationship between asthma and psychological problems as well as the high prevalence of psychiatric illnesses in individuals at low socioeconomic levels are well known.34,42
As with other cluster studies, there were no significant differences in rhinitis prevalence8,12,16 or in the BEC14,15 between the different groups of patients.
Our study appears to support the relevance of lung function and age in asthma patients, as they are the variables which have the greatest capacity for discriminating among clusters. Most authors obtained similar results for lung function,8,14–16,43 although Haldar et al. did not observe significant differences in FEV1 among clusters.13
Upon analysing the impact of the age of the patient, there is more divergence among studies, at least partly, due to methodological differences. Indeed, in some studies, current age was not analysed15,16,43 whereas others that did include it, noticed significant differences among clusters.8,14
Our results may be useful for identifying factors related with a worse prognosis, given that the clusters identified show significant differences in baseline severity, quality of life, asthma control, history of severe exacerbations and hospital admissions. Patients with a specific phenotype should benefit from particularly intense surveillance and therapy to improve their outcomes. It is known that targeting treatable traits using a personalised-medicine approach in severe asthma leads to improvements in health-related quality of life and asthma control as well as a reduction in unscheduled primary care visits.44
Significant differences were also identified among clusters regarding the prevalence of treatable traits such as adherence and psychiatric disease and many comorbidities that could be useful for guiding future research. Indeed, variables that were significantly different among clusters may be targets for research in order to modify future risk.45,46
Our work may have several limitations; firstly, as for the methodology of the cluster analysis, since the disease is a continuous spectrum, the separation into discrete clusters may not be realistic, especially in such a heterogeneous disease; secondly, inclusion bias can occur as our patients came from specialised asthma units of hospitals, implying that the results may not be extrapolated to the general asthmatic population; thirdly, the variables for cluster definition may be rather subjective as they were pre-selected by the research team even though they were chosen with relevant parameters in mind in order to classify patients with asthma and measure them in routine clinical practice, leaving aside other possible variables of major significance to define phenotypes; fourthly, the potential impact of SCSs on eosinophilia and lung function should not be excluded either, but it would have been very difficult to avoid this effect as patients with severe asthma were included; fifthly, we did not include historical patient BEC values, meaning that the results of this parameter could be influenced by treatment; sixthly, we did not include induced sputum data since these measurements were not carried out in all the participating centres of the study, which would have also significantly reduced the size of the sample included; finally, only data from 8 hospitals was included, implying that the results may not be applicable to the whole asthmatic population in Spain.
This study has some strengths too; firstly, we included a large sample size with a considerable number of clinical, analytical and socioeconomic variables; secondly, the clusters identified appear to be clinically relevant since they show significant differences in aspects such as baseline severity, control of the disease, the number of exacerbations, and hospital admissions; thirdly, when making comparisons with other similar studies, our clusters coincide with those observed for other Western populations like the SARP study and the study of Leicester20,21; finally, the use of a new clustering k-groups algorithm, which obtains more complex and general clusters than other clustering algorithms previously used to determine clinical phenotypes of asthma. The application of the k-means algorithm may be limited in many ways; for instance, it only detects differences in the mean between the groups established, while the hierarchical algorithms, given their heuristic nature, can give rise to suboptimal results. On the other hand, the k-groups algorithm can detect a general distributional form between established clusters, which involves differences in variance, kurtosis and other high-order moments, whereas the traditional algorithms are more likely to behave sub-optimally.
ConclusionsFour phenotypes of asthma were defined using a classification algorithm based on unsupervised cluster analysis. These clusters differ from each other as regards FEV1, age of onset, age, BMI, atopy, asthma severity, exacerbations, asthma control, social class, smoking and nasal polyps. These clusters are clinically relevant and support the heterogeneity of asthma. The different phenotypes observed suggest endotypes that may have an effect on the course of the disease.
Ethics Approval and Consent to ParticipateThis research project has been approved by the Clinical Research Ethics Committee of all the hospitals participating in the study, in accordance with the Personal Data Protection Act 15/1999, the Biomedical Research Act 14/2007 and the Biomedical Research Royal Decree 1716/2011. All patients signed an informed consent form.
Authors’ ContributionsMM; FJS, JJNF, VDP, JS, and FJGB have contributed to the conception, design, analysis and interpretation of data, and have drafted the work. MJAP, EA, PB, IB, MLC, JAC, BC, MJC, EC, JDO, JAL, CMR, JM, XM, JRC, JMO, CP, VP, SQ, MJR, CRM, BS, LSR, AV, MVM, have contributed to the design, analysis and interpretation of data, and have revised the work. All authors read and approved the final manuscript.
FundingThis study has been supported by Sanofi [02/055], the Health Research Fund (Fondo de Investigación Sanitaria – FIS [PI15/00803]), [PI15/01900], the Merck Health Foundation, 6CIBER (Biomedical Research Centre Network) Respiratory Diseases (Centro de Investigación Biomédica en Red – Enfermedades Respiratorias [CIBERES]), a Carlos III Institute of Health Initiative, and European Regional Development Funds (ERDF). Dr. Nieto-Fontarigo is recipient of a Sara Borrell Fellowship from Instituto de Salud Carlos III (European Social Fund, ESF+).
Conflict of InterestsMM, FJS, JJFN, EA, PB, IB, MLC, JAC, BC, JRC, BS, have nothing to disclose. XM declares grants from ASTRA, GSK, SANOFI and NOVARTIS, consulting fees from ASTRA, GSK, SANOFI and NOVARTIS, payment for lectures from ASTRA, GSK, BOEHRINGUER, CHIESI and SANOFI, and support for attending meetings from ASTRA, NOVARTIS, MENARINI, GSK and FAES. AV has received payments for lectures from Chiesi, GSK, Orion Pharma and NOVARTIS. CP has received payments for lectures from Astra-Zeneca, GSK, NOVARTIS and MERCK. CMR has received consulting fees from GSK, Astra Zeneca, Sanofi, TEVA, Mundipharma, payment for lectures from GSK, Astra Zeneca, Novartis, TEVA, Sanofi, Chiesi, and Support for attending meetings from GSK, Novartis, Sanofi, Chiesi. JDO has received consulting fees from Sanofi, AstraZeneca, GSK and Chiesi, and payment for lectures from AstraZeneca, GSK, TEVA, Sanofi, Leti Pharma, Chiesi and Novartis. MJR has received payment for lectures from AstraZeneca, GSK, TEVA, and Novartis. SQ has received payment for lectures from GSK, AZ, Sanofi, Teva, Novartis, and Chiesi. JS has received grants from SANOFI, consulting fees from SANOFI, ABBVIE and NOVARTIS, payment for lectures from SANOFI, GSK and FAES FARMA, and support for attending meetings from SANOFI. FJGB has received consulting fees and payment for lectures from ALK, Astra-Zeneca, Bial, Chiesi, Gebro Pharma, GlaxoSmithKline, Menarini, Novartis, Rovi, Roxall, Sanofi, Stallergenes-Greer, and Teva, support for attending meetings from ALK, Menarini and SANOFI, Participation on a Data Safety Monitoring Board or Advisory Board from ALK, Astra-Zeneca, GlaxoSmithKline, Menarini, Novartis, Sanofi, Teva. JAL has received payment for lectures from AstraZeneca. MJAP has received support for attending meetings from LETI and Chiesi. VP has received support for the present manuscript from MSD, consulting fees from Sanofi, payment for lectures from AstraZeneca, Chiesi, MSD, and Boehringer Ingelheim, support for attending meetings from AstraZeneca and grants for research from Chiesi and Menarini. VDP has received grants from AstraZeneca, and payment for lectures from AstraZeneca and GSK. MVM has received consulting fees from Organon Pharma, and payments for lectures from GSK. JM reports personal fees and other from SANOFI-GENZYME & REGENERON, personal fees and other from NOVARTIS, personal fees and other from ALLAKOS, grants and personal fees from VIATRIS (MYLAN-MEDA Pharma), grants and personal fees from URIACH Group, personal fees from Mitsubishi-Tanabe, personal fees from Menarini, personal fees from UCB, personal fees and other from AstraZeneca, personal fees and other from GSK, personal fees from MSD, outside the submitted work. LSR has received payment for lectures from Sanofi, AstraZeneca and GSK. JMO has received payment for lectures from AstraZeneca, GSK, Mundipharma and ALK. EC has received grants from SEPAR, SOCAP, payment for lectures from AstraZeneca, Chiesi, TEVA and Novartis, and support for attending meetings from Chiesi. MJC has received grants from ISCIII. CRM has received personal fees from TEVA and GSK.
The authors would like to thank David Brown and Adam G. Joseph for proof-reading and editing the manuscript.
The following are the supplementary data to this article:


