
Sputum colour has emerged as a clinically accessible biomarker in bronchiectasis, reflecting underlying airway inflammation and predicting disease severity, exacerbation risk and mortality [1]. Beyond signalling inflammation, sputum colour may also indicate changes in biophysical properties, such as impaired rheology and elevated solids concentrations driven by extracellular DNA, proteases and degraded mucins [2]. These alterations, particularly in rheology, have been linked to worse symptoms in bronchiectasis [3] and are thought to drive the disease's vicious vortex pathophysiology [4].
Rheological characterisation of sputum typically involves the storage or elastic modulus (G′), the loss or viscous modulus (G″) and complex viscosity (η*) [5]. By definition, G′ is the real component of the complex shear modulus (G*=G′+iG″), from which the complex viscosity is derived as η*=G*/ω. Thus, the three parameters are inherently inter-dependent. Moreover, it has been demonstrated that, in airway sputum samples, G′ and G″ change in parallel, correlating with disease activity [6]. Accordingly, we report G′ as a robust surrogate of overall viscoelasticity.
Despite their highly relevance, rheological measurements are not easily applicable in clinical routine, limiting their practical utility. By contrast, determining sputum solids concentration is straightforward, inexpensive, and serves as a more accessible biomarker; however, the role of sputum solids concentration in bronchiectasis is limited, particularly its relationship with rheological behaviour/characteristics of sputum. We therefore performed a post hoc analysis of data obtained from the study by Herrero-Cortina et al. [7] to examine how solids concentration inter-relates with the elastic modulus (G′) and sputum colour in bronchiectasis. Assessing whether a simple, colour-based visual scale reflects these biophysical markers could enable point-of-care stratification and help guide personalised airway-clearance strategies.
A total of 99 spontaneous sputum samples were collected from 28 individuals with bronchiectasis during stable clinical periods (mean age 64 (17) years; 64% female), with each patient providing at least three samples over a two-month period. Baseline characteristics of the study population are detailed elsewhere [7]. A physiotherapist with experience in the management of bronchiectasis classified all samples according to the Sputum Colour Chart (SCC) [8].
Solids concentration (%) of sputum samples was measured in all samples by freeze-drying, whereas rheological characterisation was possible in 91 samples only, due to insufficient volume (<0.5mL) for both analyses. Rheological measurements were performed as previously described [3], and the elastic modulus (G′) was obtained at a shear stress of 1Pa from each sweep to allow direct comparison between samples. Normality was assessed using the Shapiro–Wilk test and differences among groups were analysed by one-way ANOVA followed by Tukey's post hoc test when the assumptions of normality and homogeneity of variances were satisfied. Otherwise, a Kruskal–Wallis test with Dunn–Sidak post hoc correction was applied. Results were reported descriptively, and statistical significance was set at p<0.05.
Top-left panel of Fig. 1 shows the elastic modulus (G′, left y-axis) and sputum solid content (%, right y-axis) for mucoid, mucopurulent, and purulent samples. Table 1 presents both parameters stratified by sputum colour classification. No significant differences were found in G′ when comparing mucoid and mucopurulent (p=0.146) or mucoid and purulent (p=0.824) samples; however, the differences between mucopurulent and purulent samples approached statistical significance (p=0.055). This pattern suggests that viscoelastic stiffening, though more moderate, parallels the colour-solids continuum and supports our earlier studies that assessed rheology alone [3]. On the other hand, sputum solid concentration differed significantly (95% CI) across the three colour groups. Post hoc comparisons confirmed higher values in mucopurulent versus mucoid (+0.79%: −0.0 to+1.6; p=0.002), purulent versus mucoid (+1.90%: 1.15–2.65; p<0.0001), and purulent versus mucopurulent samples (+1.11%: 0.50–1.72; p=0.001). These results demonstrate a progressive increase in solids concentration across colour classification based on SCC scores (top-right panel illustration). This gradient is clinically relevant because higher solids concentration decreases the hydration of the mucus layer, impair ciliary beating, and make airway clearance techniques more challenging. Patients whose sputum samples are repeatedly classified as purulent could therefore benefit from adjuvant strategies to improve mucus clearance such as inhaled hypertonic solutions or high flow therapy [9]. Pragmatic prospective trials should evaluate whether tailoring airway clearance modalities to sputum solids concentration leads to fewer exacerbations and improved quality of life.
 Dot-plots of single frequency elastic modulus (G′, blue; left y-axis) and percent-solids (orange; right y-axis) grouped as mucoid, mucopurulent and purulent (** p<0.01, **** p<0.0001). (B) %-solids for each square of the Murray colour chart (points), coloured by the three clinical categories (grey=mucoid, amber=mucopurulent, green=purulent). (C) Scatter-plot of G′ versus %-solids for all samples; symbols coloured as in B. The positive trend illustrates the coupling between hyper-concentration and elastic stiffening. (D) Decision map showing centroids and convex hulls (dashed) for each group in the solids – G′ plane, delineating thresholds that could aid rapid bedside stratification.")
Figure in colour. Sputum colour, solid concentration and viscoelasticity in bronchiectasis. (A) Dot-plots of single frequency elastic modulus (G′, blue; left y-axis) and percent-solids (orange; right y-axis) grouped as mucoid, mucopurulent and purulent (** p<0.01, **** p<0.0001). (B) %-solids for each square of the Murray colour chart (points), coloured by the three clinical categories (grey=mucoid, amber=mucopurulent, green=purulent). (C) Scatter-plot of G′ versus %-solids for all samples; symbols coloured as in B. The positive trend illustrates the coupling between hyper-concentration and elastic stiffening. (D) Decision map showing centroids and convex hulls (dashed) for each group in the solids – G′ plane, delineating thresholds that could aid rapid bedside stratification.
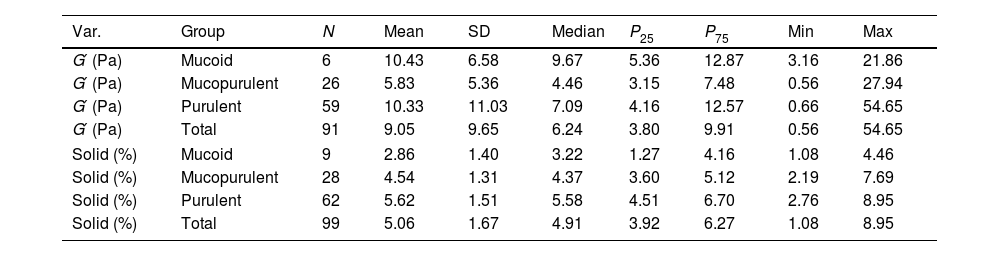
Descriptive statistics of sputum rheology (G′, elastic modulus) and solids concentration (%) by colour.
| Var. | Group | N | Mean | SD | Median | P25 | P75 | Min | Max |
|---|---|---|---|---|---|---|---|---|---|
| G′ (Pa) | Mucoid | 6 | 10.43 | 6.58 | 9.67 | 5.36 | 12.87 | 3.16 | 21.86 |
| G′ (Pa) | Mucopurulent | 26 | 5.83 | 5.36 | 4.46 | 3.15 | 7.48 | 0.56 | 27.94 |
| G′ (Pa) | Purulent | 59 | 10.33 | 11.03 | 7.09 | 4.16 | 12.57 | 0.66 | 54.65 |
| G′ (Pa) | Total | 91 | 9.05 | 9.65 | 6.24 | 3.80 | 9.91 | 0.56 | 54.65 |
| Solid (%) | Mucoid | 9 | 2.86 | 1.40 | 3.22 | 1.27 | 4.16 | 1.08 | 4.46 |
| Solid (%) | Mucopurulent | 28 | 4.54 | 1.31 | 4.37 | 3.60 | 5.12 | 2.19 | 7.69 |
| Solid (%) | Purulent | 62 | 5.62 | 1.51 | 5.58 | 4.51 | 6.70 | 2.76 | 8.95 |
| Solid (%) | Total | 99 | 5.06 | 1.67 | 4.91 | 3.92 | 6.27 | 1.08 | 8.95 |
Data are presented as mean, standard deviation (SD), median, 25th percentile (P25), 75th percentile (P75), minimum (Min), and maximum (Max). G′: Elastic modulus (Pa). Solid: Sputum solid concentration (%). Descriptive statistics are presented for each sputum colour group (mucoid, mucopurulent, purulent) and for the overall sample. Pairwise comparisons and p-values are reported in the text.
The bottom-left scatter plot shows the distribution of individual data points for G′ against sputum solid content, with each symbol illustrating one of the three sputum categories. The bottom-right plot further clarifies these distributions by displaying boundary lines (convex hulls) that delimit the range of values for each subgroup, along with their corresponding centroids. This visualisation clearly shows that mucoid samples predominantly cluster at lower values of both G′ and solid content, while mucopurulent and purulent samples progressively extend towards higher values, suggesting an association between increased viscoelasticity and higher solid concentrations, typically linked to worse clinical outcomes in people with bronchiectasis [2].
Our contribution lies in combining both dimensions—solids concentration and rheology—within the same colour-based framework. To our knowledge, no previous studies in bronchiectasis have simultaneously profiled mucoid, mucopurulent and purulent sputum samples by these two complementary biophysical metrics. These parameters might reflect the underlying inflammatory status and bacterial load, frequently observed in patients with more severe pulmonary disease [10]. Furthermore, merging solid concentration with rheological measurements of G′ could significantly improve the accuracy with which clinicians identify the hyper-concentrated, highly elastic sputum phenotype, often linked to poor airway clearance and frequent exacerbations, and sharpen prognostic precision for future disease progression.
Notably, gravimetric measurement of sputum percent-solids is methodologically simple and highly reproducible; coefficients of variation are around 4% when ≥100μL aliquots are analysed in patients with muco-obstructive lung disease [11]. Since SCC is already used in routine bronchiectasis assessments [1], adding a quick %-solids read-out could convert that purely visual scale into a semi-quantitative tool: the hue draws attention to the patient at risk, the dry-mass percentage estimates the bulk of secretion that must be mobilised, and G′ clarifies how resistant that sputum is to deformation and clearance.
Coupling both, metrics could help guide clinicians in selecting the most suitable airway clearance strategy for each individual, in deciding whether adjunctive measures such as hypertonic saline or high-flow therapy are warranted, and in providing and objective benchmark or monitoring the response to anti-inflammatory or antibiotic therapy [12]. In practical terms, patients whose sputum samples show higher solids concentration together with increased elastic components may be good candidates for mucoactive or hydrator strategies combined with airway-clearance techniques, whereas those with lower solids and less impairment in sputum elasticity could initially be managed with conventional airway clearance techniques. These approaches, which are already supported by current guidelines, may be further refined by incorporating simple solids and G′ read-outs into routine assessment.
This study has several limitations. First, the number of mucoid samples was unbalanced compared with the mucopurulent and purulent groups, which partially limits the strength of the inferences. However, non-parametric statistical methods were applied to mitigate this limitation. Second, microbiological isolates for the sputum were not analysed, although both may influence rheological composition, as has been recently proposed in different chronic muco-obstructive pulmonary diseases [12]. In addition, because patients contributed more than one sample, intra-individual variability may have affected group distributions. However, since sputum properties are known to exhibit high variability, increasing the number of samples, even from the same patients, may strengthen the findings and improve consistency. Finally, the cross-sectional limits the ability to clarify the role of these properties in prognosis and clinical outcomes.
Future longitudinal studies with balanced sampling, and considering microbiological and microbiome assessment are needed to test whether serial changes in solids concentration and G′ provide prognostic information that complements, rather than replaces, current clinical scores, such as predicting exacerbations or objectively tracking treatment response. Mechanistic work linking biophysical alterations to microbiome composition and neutrophilic inflammation will further clarify their role in disease progression. Ultimately, enhancing these biomarkers may facilitate personalised therapeutic strategies, enabling clinicians not only to tailor interventions according to objective sputum biophysical characteristics but also to monitor and analyse patients’ responsiveness to therapy in real time.
In conclusion, our findings reveal that sputum colour is not only a visual indicator of inflammation but also reflects the impairment of sputum biophysical properties: purulent samples contain significantly more solids and exhibit a moderate increase in elastic stiffness. Combining a simple solids measurement with a single-frequency G′ value, can provide clinicians with a quick quantitative assessment of secretions amount and mechanical properties, complementing standard SCC. These combined biomarkers may improve prognosis, help tailor airway-clearance and muco-active therapies, and offer an objective way to monitor treatment response in bronchiectasis. Future prospective studies should assess whether tracking these two parameters leads to fewer exacerbations and better patients’ outcomes.
Artificial intelligence involvementNo generative AI was used to create or analyse the scientific content; language-model tools were employed solely for minor English-style editing under the authors’ direct supervision.
FundingH.S-F has received funding from the Alectors-2024 programme, funded by the Universitat Politècnica de Catalunya, with grant no. R-02598.
Conflicts of interestThe authors declare not to have any conflicts of interest that may be considered to influence directly or indirectly the content of the manuscript.


