


Noninvasive mechanical ventilation (NIV) appeared in the 1980s as an alternative to invasive mechanical ventilation (IMV) in patients with acute respiratory failure. We evaluated the introduction of NIV and the results in patients with acute exacerbation of chronic obstructive pulmonary disease in the Region of Murcia (Spain).
Subjects and methodsA retrospective observational study based on the minimum basic hospital discharge data of all patients hospitalised for this pathology in all public hospitals in the region between 1997 and 2010. We performed a time trend analysis on hospital attendance, the use of each ventilatory intervention and hospital mortality through JoinPoint regression.
ResultsWe identified 30027 hospital discharges. JoinPoint analysis: downward trend in attendance (annual percentage change [APC]=−3.4, 95% CI: −4.8 to −2.0, P<.05) and in the group without ventilatory intervention (APC=−4.2%, −5.6 to −2.8, P<.05); upward trend in the use of NIV (APC=16.4, 12.0–20.9, P<.05), and downward trend that was not statistically significant in IMV (APC=−4.5%, −10.3 to 1.7). We observed an upward trend without statistical significance in overall mortality (APC=0.5, −1.3 to 2.4) and in the group without intervention (APC=0.1, −1.6 to 1.9); downward trend with statistical significance in the NIV group (APC=−7.1, −11.7 to −2.2, P<.05) and not statistically significant in the IMV group (APC=−0.8, −6, 1–4.8). The mean stay did not change substantially.
ConclusionsThe introduction of NIV has reduced the group of patients not receiving assisted ventilation. No improvement in results was found in terms of mortality or length of stay.
La ventilación mecánica no invasiva (VMNI) aparece, en los 80, como alternativa a la ventilación mecánica invasiva (VMI) en pacientes con fracaso respiratorio agudo. Se pretende valorar la introducción de la VMNI y los resultados sobre los pacientes hospitalizados por agudización de enfermedad pulmonar obstructiva crónica en la Región de Murcia.
Sujetos y métodosEstudio observacional retrospectivo basado en el conjunto mínimo básico de datos al alta hospitalaria de todos los pacientes hospitalizados en todos los hospitales públicos de la región entre 1997-2010. Se realizó análisis de tendencias temporales en la frecuentación hospitalaria, el uso de cada intervención ventilatoria y la mortalidad hospitalaria mediante regresión joinpoint.
ResultadosEn los 14 años estudiados se identificaron 30.027 casos. Análisis joinpoint: tendencia descendente de la frecuentación (porcentaje de cambio anual [PCA]=−3,4; IC95%: 4,8÷−2,0; p<0,05) y en el grupo sin intervención ventilatoria (PCA=−4,2; −5,6÷−2,8; p<0,05), ascendente en el uso de VMNI (PCA=16,4; 12,0÷20,9; p<0,05); el uso de la VMI presenta una tendencia descendente sin significación estadística (PCA=−4,5; −10,3÷1,7). Se aprecia una tendencia ascendente sin significación estadística en la mortalidad global (PCA=0,5; −1,3÷2,4) y en el grupo sin intervención (PCA=0,1; −1,6÷1,9); decreciente con significación estadística en el grupo VMNI (PCA=−7,1; −11,7÷−2,2; p<0,05) y sin significación estadística en el grupo VMI (PCA=−0,8; −6,1÷4,8). La estancia media no varía sustancialmente.
ConclusionesLa introducción de la VMNI ha hecho disminuir el grupo de pacientes que no reciben ventilación asistida. No se aprecia mejora de los resultados en términos de mortalidad o estancia media global.
Chronic obstructive pulmonary disease (COPD) is a complex chronic, progressive respiratory illness, with high morbidity and mortality and high public healthcare costs.1 One of the characteristic aspects of this disease is the presence of acute exacerbations that lead to deterioration in the quality of life, accelerate lung function decline, generate high socioeconomic costs and increase the risk of death, especially exacerbations that require hospitalisation.2–5 Therefore, an important pillar in the management of COPD patients is the treatment of these exacerbations, which includes, among other measures, the use of assisted ventilation if there is severe respiratory failure.1
Until the 1980s, invasive mechanical ventilation (IMV) was the only option available for treating acute respiratory failure (ARF) refractory to conventional treatment, incurring significant morbidity and mortality6; thus, at the end of the 1980s, non-invasive mechanical ventilation (NIV) emerged as a potential alternative in patients with ARF.7,8
Since then, an increasing number of published studies have supported the use of NIV as the treatment of choice in patients with ARF (especially hypercapnic) due to acute COPD exacerbations, as it reduces the need for orotracheal intubation9–21 and its complications,20 mortality9–12,14,15,20 and hospital stay,9,11,15,16,19,20 improves clinical status and blood gases16,18,19 and reduces costs.22,23
In clinical practice, the use of NIV has varied over time,24,25 between hospitals24,26,27 and geographical regions,24,27 depending on the diagnosis26–28 and on the area or department of the hospital where the patient is located.28
All new healthcare technologies must be rigorously evaluated after its introduction into clinical practice to determine, among other aspects, whether it improves patient results (and to what extent) in terms of mortality, morbidity, quality of life and cost-effectiveness with respect to the previous technique, and to examine whether it meets clinical trial expectations regarding use, effectiveness and safety in routine practice.29,30 However, most of the studies on the implementation of this technology both in Spain and abroad are based on surveys among professionals25–28 and not on clinical information.
In 2009, the Bipap (Biphasic positive airway pressure) Programme for the Murcia Region was launched, with the aim of rationally introducing this new technology in all Murcia Health Service hospitals, standardising the criteria for use and providing adequate training. This study aims to assess the introduction of NIV and its impact on patients hospitalised for COPD exacerbation in the Murcia Region between 1997 and 2010.
Subjects and MethodsThis is a retrospective, observational study based on the Regional Registry Minimum Data Set for Acute Patients (MDS) of the Ministry of Health and Social Policy for the Murcia Region (MR).
Study PopulationThe study population consisted of all episodes of COPD exacerbation in persons resident in the MR admitted to public hospitals of the Murcia Health Service between 1997 (in one of the first hospitals to introduce NIV in this region) and 2010, the last year with available data.
DefinitionsCOPD exacerbation: Patients with a primary diagnosis (ICD-9-CM codes) of COPD (490-492 and 496) or respiratory failure (518.81–84) with a diagnosis (secondary) of COPD. Type of ventilatory intervention: NIV defined by code ICD-9-CM 93.90 and IMV defined by codes ICD-9-CM 93.91, 96.70, 96.71 and 96.72. In accordance with this, patients were classified into three groups: patients with NIV, patients with IMV and patients without any type of ventilatory intervention. It was agreed to include patients who received both types of ventilation in the same episode in the IMV group, as it was not possible to establish the sequence with the information available.
Study VariablesStudy variables were those found in the information source: sex, age, primary diagnosis (understood as the reason for admission), secondary diagnoses, hospital attendance (number of discharges per 100000 population), use of each ventilatory intervention (number per 100000 population), hospital mortality (deaths per 100 discharges) and mean stay.
The Charlson Index was calculated for each episode from all existing diagnoses; this is an indicator of the risk of long-term mortality associated with the comorbidity.31
To calculate the rates (attendance and use of each technique), the populations were estimated mid-year by arithmetic interpolation based on the pattern at 1 January (Spanish National Statistics Institute).32 The standardised rates for attendance and use were calculated according to the direct method, using the mid-term Murcian population as standard. In the case of annual mortality, the standardised rates were calculated by the direct method using all the episodes of hospitalisation in the period as standard.
Validity of the InformationThe completeness of the MBDS-HD was verified by comparing the total number of reported episodes with the number of cases reported to the Survey on Healthcare Establishment Inpatient Facilities [Encuesta de Establecimientos Sanitarios en Régimen de Internado] for each year. Likewise, to confirm the reliability of the cases selected, the number of cases, population discharge rate, comorbidity (Charlson Index), mean number of diagnoses, sex distribution and mean age for each year of the study period were evaluated, calculating the index of variation.
Statistical AnalysisA descriptive analysis was performed using two periods of equal length: 1997–2003, the initial period of introduction of NIV in Murcian hospitals and 2004–2010, the second period, with more consolidated use of this technique, using the SPSS statistics program.
Changes in the time trends for hospital attendance, use of each ventilatory intervention and hospital mortality were analysed using a JoinPoint regression model, which identifies the years in which there are significant inflections or changes in trend and estimates the annual percentage change (APC). For estimation of these models, standardised rates and their standard errors were used. A maximum of two inflection points was permitted in each regression, using the Hudson method to find the best fit for the model, then estimating its statistical significance by Monte Carlo permutations. The APC value was considered statistically significant if it differed from 0 with P<.05. This analysis was performed using the JoinPoint program, version 4.0.1.33
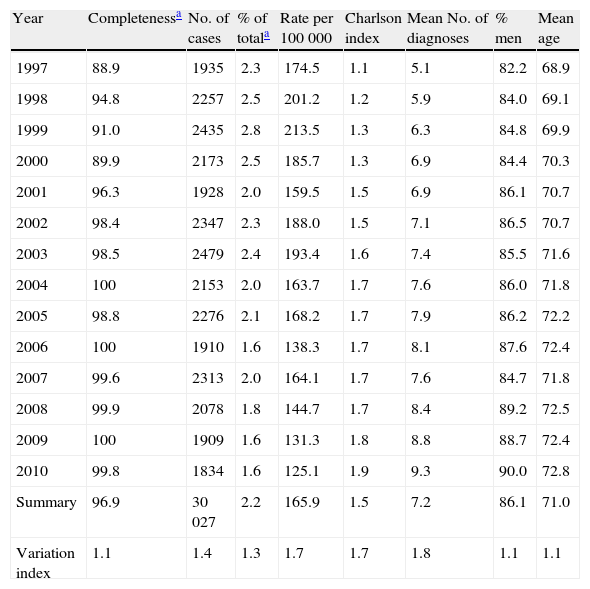
ResultsValidity of the InformationThe completeness of the MBDS-HD in Murcia Health Service hospitals has increased gradually since 1997, the first year in which this indicator was available, recording more than 98.0% of the total number of all-cause discharges since 2002 (Table 1). The number of discharges of patients with COPD exacerbation accounted for between 1.6% and 2.8% of all discharges recorded, and presented a cyclical variation, which is shown in the population rates.
Assessment of the Reliability of the Information Source. MBDS-HD. Murcia Region. 1997–2010.
| Year | Completenessa | No. of cases | % of totala | Rate per 100000 | Charlson index | Mean No. of diagnoses | % men | Mean age |
| 1997 | 88.9 | 1935 | 2.3 | 174.5 | 1.1 | 5.1 | 82.2 | 68.9 |
| 1998 | 94.8 | 2257 | 2.5 | 201.2 | 1.2 | 5.9 | 84.0 | 69.1 |
| 1999 | 91.0 | 2435 | 2.8 | 213.5 | 1.3 | 6.3 | 84.8 | 69.9 |
| 2000 | 89.9 | 2173 | 2.5 | 185.7 | 1.3 | 6.9 | 84.4 | 70.3 |
| 2001 | 96.3 | 1928 | 2.0 | 159.5 | 1.5 | 6.9 | 86.1 | 70.7 |
| 2002 | 98.4 | 2347 | 2.3 | 188.0 | 1.5 | 7.1 | 86.5 | 70.7 |
| 2003 | 98.5 | 2479 | 2.4 | 193.4 | 1.6 | 7.4 | 85.5 | 71.6 |
| 2004 | 100 | 2153 | 2.0 | 163.7 | 1.7 | 7.6 | 86.0 | 71.8 |
| 2005 | 98.8 | 2276 | 2.1 | 168.2 | 1.7 | 7.9 | 86.2 | 72.2 |
| 2006 | 100 | 1910 | 1.6 | 138.3 | 1.7 | 8.1 | 87.6 | 72.4 |
| 2007 | 99.6 | 2313 | 2.0 | 164.1 | 1.7 | 7.6 | 84.7 | 71.8 |
| 2008 | 99.9 | 2078 | 1.8 | 144.7 | 1.7 | 8.4 | 89.2 | 72.5 |
| 2009 | 100 | 1909 | 1.6 | 131.3 | 1.8 | 8.8 | 88.7 | 72.4 |
| 2010 | 99.8 | 1834 | 1.6 | 125.1 | 1.9 | 9.3 | 90.0 | 72.8 |
| Summary | 96.9 | 30027 | 2.2 | 165.9 | 1.5 | 7.2 | 86.1 | 71.0 |
| Variation index | 1.1 | 1.4 | 1.3 | 1.7 | 1.7 | 1.8 | 1.1 | 1.1 |
The mean number of diagnoses per episode and the Charlson Index increased over the period studied, showing a high correlation between them (r=0.96, P=.01).
The proportion of males and the mean age were the variables with least variation. The mean age increased from 68.9 to 72.8 (Table 1).
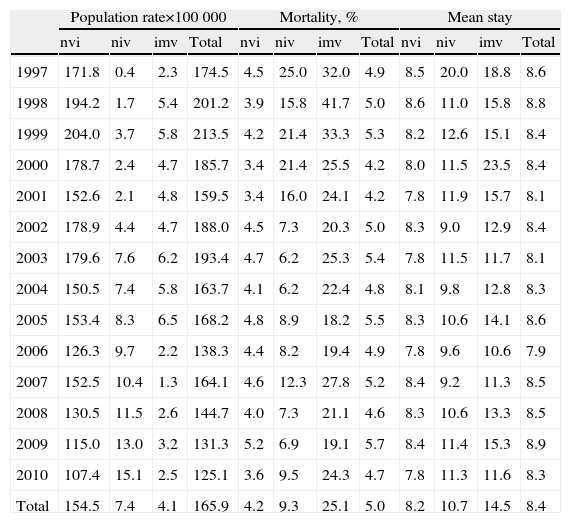
AnalysisIn the 14 years investigated, a total of 30027 hospital discharges were identified, of which 86.1% were males with a mean age of 71.0 years. Of the patients treated, 6.9% required treatment with mechanical ventilation: 4.4% with NIV and 2.5% with IMV (Table 2). The overall mortality was 5.0%, and was greater in the group that received IMV (25.1%). The mean stay was 8.4 days (SD=8.2), increasing depending on the therapeutic intensity.
Annual Evolution of the Use, Mortality and Hospital Stay for Each Type of Ventilatory Intervention. Murcia Region. 1997–2010.
| Population rate×100000 | Mortality, % | Mean stay | ||||||||||
| nvi | niv | imv | Total | nvi | niv | imv | Total | nvi | niv | imv | Total | |
| 1997 | 171.8 | 0.4 | 2.3 | 174.5 | 4.5 | 25.0 | 32.0 | 4.9 | 8.5 | 20.0 | 18.8 | 8.6 |
| 1998 | 194.2 | 1.7 | 5.4 | 201.2 | 3.9 | 15.8 | 41.7 | 5.0 | 8.6 | 11.0 | 15.8 | 8.8 |
| 1999 | 204.0 | 3.7 | 5.8 | 213.5 | 4.2 | 21.4 | 33.3 | 5.3 | 8.2 | 12.6 | 15.1 | 8.4 |
| 2000 | 178.7 | 2.4 | 4.7 | 185.7 | 3.4 | 21.4 | 25.5 | 4.2 | 8.0 | 11.5 | 23.5 | 8.4 |
| 2001 | 152.6 | 2.1 | 4.8 | 159.5 | 3.4 | 16.0 | 24.1 | 4.2 | 7.8 | 11.9 | 15.7 | 8.1 |
| 2002 | 178.9 | 4.4 | 4.7 | 188.0 | 4.5 | 7.3 | 20.3 | 5.0 | 8.3 | 9.0 | 12.9 | 8.4 |
| 2003 | 179.6 | 7.6 | 6.2 | 193.4 | 4.7 | 6.2 | 25.3 | 5.4 | 7.8 | 11.5 | 11.7 | 8.1 |
| 2004 | 150.5 | 7.4 | 5.8 | 163.7 | 4.1 | 6.2 | 22.4 | 4.8 | 8.1 | 9.8 | 12.8 | 8.3 |
| 2005 | 153.4 | 8.3 | 6.5 | 168.2 | 4.8 | 8.9 | 18.2 | 5.5 | 8.3 | 10.6 | 14.1 | 8.6 |
| 2006 | 126.3 | 9.7 | 2.2 | 138.3 | 4.4 | 8.2 | 19.4 | 4.9 | 7.8 | 9.6 | 10.6 | 7.9 |
| 2007 | 152.5 | 10.4 | 1.3 | 164.1 | 4.6 | 12.3 | 27.8 | 5.2 | 8.4 | 9.2 | 11.3 | 8.5 |
| 2008 | 130.5 | 11.5 | 2.6 | 144.7 | 4.0 | 7.3 | 21.1 | 4.6 | 8.3 | 10.6 | 13.3 | 8.5 |
| 2009 | 115.0 | 13.0 | 3.2 | 131.3 | 5.2 | 6.9 | 19.1 | 5.7 | 8.4 | 11.4 | 15.3 | 8.9 |
| 2010 | 107.4 | 15.1 | 2.5 | 125.1 | 3.6 | 9.5 | 24.3 | 4.7 | 7.8 | 11.3 | 11.6 | 8.3 |
| Total | 154.5 | 7.4 | 4.1 | 165.9 | 4.2 | 9.3 | 25.1 | 5.0 | 8.2 | 10.7 | 14.5 | 8.4 |
nvi, no ventilatory intervention; niv, non-invasive mechanical ventilation; imv, invasive mechanical ventilation.
Of the 737 patients included in the IMV group, 11.4% had also received NIV in the same episode. Patients who received both treatments did not differ in age, sex or mortality from the other patients, although the mean stay was longer (20.9 days versus 13.7 in those who received IMV only, P<.01).
JoinPoint analysis. No statistically significant changes or inflection points were identified in the trends in any of the analyses performed.
The hospital attendance showed a downward trend over the period 1997–2010, with a statistically significant mean annual percentage change of −3.4% (APC=−3.4; 95% CI: −4.8 to −2.0, P<.05) (Fig. 1). In the episodes without any intervention, a statistically significant downward trend was observed with a mean APC of −4.2% (95% CI: −5.6 to −2.8, P<.05); a statistically significant trend, but upward, was also observed in the use of NIV (APC=16.4; 95% CI: 12.0–20.9, P<.05). In the case of the use of IMV, although there was a downward trend, the mean APC (APC=−4.5; 95% CI: −10.3 to 1.7) did not reach statistical significance (Fig. 1).

The overall mortality showed an upward trend that was not statistically significant (APC of 0.5; 95% CI: −1.3 to 2.4) (Fig. 2). Likewise, statistical significance was not observed either in the mortality trend in the group that did not receive any intervention (APC=0.1, 95% CI: −1.6 to 1.9). In the group that received NIV, a downward trend with a statistically significant mean annual percentage change of −7.1% was observed (95% CI: −11.7 to −2.2, P<.05), while in the group with IMV, a small downward trend without statistical significance was noted (APC=−0.8; 95% CI: −6.1 to 4.8).

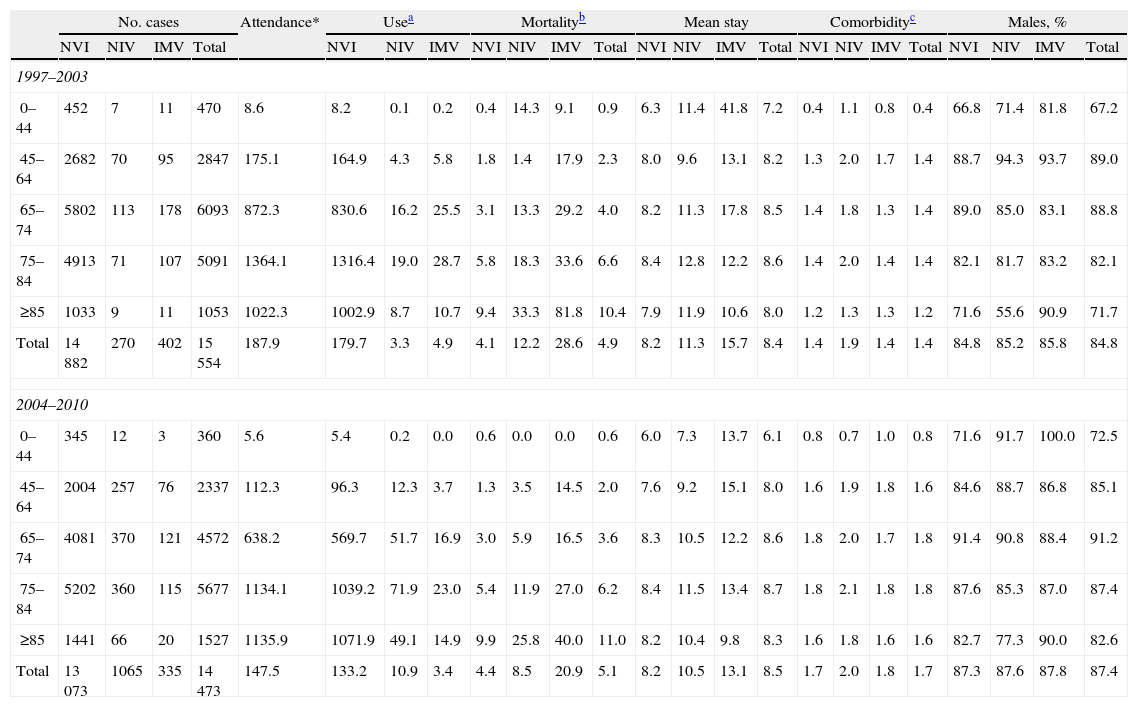
Analysis by year groupings. The overall hospital attendance due to the respiratory diseases studied fell from 187.9 episodes per 100000 population in the first seven-year period to 147.5 in the second, with a predominance of men in all age groups (Table 3).
Demographic and Clinical Characteristics and Hospital Indicators According to Ventilatory Intervention Groups, by Age Groups and Seven-Year Period. Murcia Region. 1997–2010.
| No. cases | Attendance* | Usea | Mortalityb | Mean stay | Comorbidityc | Males, % | ||||||||||||||||||
| NVI | NIV | IMV | Total | NVI | NIV | IMV | NVI | NIV | IMV | Total | NVI | NIV | IMV | Total | NVI | NIV | IMV | Total | NVI | NIV | IMV | Total | ||
| 1997–2003 | ||||||||||||||||||||||||
| 0–44 | 452 | 7 | 11 | 470 | 8.6 | 8.2 | 0.1 | 0.2 | 0.4 | 14.3 | 9.1 | 0.9 | 6.3 | 11.4 | 41.8 | 7.2 | 0.4 | 1.1 | 0.8 | 0.4 | 66.8 | 71.4 | 81.8 | 67.2 |
| 45–64 | 2682 | 70 | 95 | 2847 | 175.1 | 164.9 | 4.3 | 5.8 | 1.8 | 1.4 | 17.9 | 2.3 | 8.0 | 9.6 | 13.1 | 8.2 | 1.3 | 2.0 | 1.7 | 1.4 | 88.7 | 94.3 | 93.7 | 89.0 |
| 65–74 | 5802 | 113 | 178 | 6093 | 872.3 | 830.6 | 16.2 | 25.5 | 3.1 | 13.3 | 29.2 | 4.0 | 8.2 | 11.3 | 17.8 | 8.5 | 1.4 | 1.8 | 1.3 | 1.4 | 89.0 | 85.0 | 83.1 | 88.8 |
| 75–84 | 4913 | 71 | 107 | 5091 | 1364.1 | 1316.4 | 19.0 | 28.7 | 5.8 | 18.3 | 33.6 | 6.6 | 8.4 | 12.8 | 12.2 | 8.6 | 1.4 | 2.0 | 1.4 | 1.4 | 82.1 | 81.7 | 83.2 | 82.1 |
| ≥85 | 1033 | 9 | 11 | 1053 | 1022.3 | 1002.9 | 8.7 | 10.7 | 9.4 | 33.3 | 81.8 | 10.4 | 7.9 | 11.9 | 10.6 | 8.0 | 1.2 | 1.3 | 1.3 | 1.2 | 71.6 | 55.6 | 90.9 | 71.7 |
| Total | 14882 | 270 | 402 | 15554 | 187.9 | 179.7 | 3.3 | 4.9 | 4.1 | 12.2 | 28.6 | 4.9 | 8.2 | 11.3 | 15.7 | 8.4 | 1.4 | 1.9 | 1.4 | 1.4 | 84.8 | 85.2 | 85.8 | 84.8 |
| 2004–2010 | ||||||||||||||||||||||||
| 0–44 | 345 | 12 | 3 | 360 | 5.6 | 5.4 | 0.2 | 0.0 | 0.6 | 0.0 | 0.0 | 0.6 | 6.0 | 7.3 | 13.7 | 6.1 | 0.8 | 0.7 | 1.0 | 0.8 | 71.6 | 91.7 | 100.0 | 72.5 |
| 45–64 | 2004 | 257 | 76 | 2337 | 112.3 | 96.3 | 12.3 | 3.7 | 1.3 | 3.5 | 14.5 | 2.0 | 7.6 | 9.2 | 15.1 | 8.0 | 1.6 | 1.9 | 1.8 | 1.6 | 84.6 | 88.7 | 86.8 | 85.1 |
| 65–74 | 4081 | 370 | 121 | 4572 | 638.2 | 569.7 | 51.7 | 16.9 | 3.0 | 5.9 | 16.5 | 3.6 | 8.3 | 10.5 | 12.2 | 8.6 | 1.8 | 2.0 | 1.7 | 1.8 | 91.4 | 90.8 | 88.4 | 91.2 |
| 75–84 | 5202 | 360 | 115 | 5677 | 1134.1 | 1039.2 | 71.9 | 23.0 | 5.4 | 11.9 | 27.0 | 6.2 | 8.4 | 11.5 | 13.4 | 8.7 | 1.8 | 2.1 | 1.8 | 1.8 | 87.6 | 85.3 | 87.0 | 87.4 |
| ≥85 | 1441 | 66 | 20 | 1527 | 1135.9 | 1071.9 | 49.1 | 14.9 | 9.9 | 25.8 | 40.0 | 11.0 | 8.2 | 10.4 | 9.8 | 8.3 | 1.6 | 1.8 | 1.6 | 1.6 | 82.7 | 77.3 | 90.0 | 82.6 |
| Total | 13073 | 1065 | 335 | 14473 | 147.5 | 133.2 | 10.9 | 3.4 | 4.4 | 8.5 | 20.9 | 5.1 | 8.2 | 10.5 | 13.1 | 8.5 | 1.7 | 2.0 | 1.8 | 1.7 | 87.3 | 87.6 | 87.8 | 87.4 |
NVI, no ventilatory intervention; NIV, non-invasive mechanical ventilation; IMV, invasive mechanical ventilation.
Hospital attendance rate discharges per 100000 inhabitants.
The use of IMV, measured by population rate, fell in the second seven-year period (3.4 versus 4.9 per 100000), except in those over the age of 85 (Table 3). The use of NIV underwent a clear increase in the second seven-year period (10.9 cases per 100000 versus 3.3), and was more significant in those over 65 years old. The population rate for episodes in which no techniques were applied fell in the second seven-year period (133.2 versus 179.7). No sex differences were observed in the use of these techniques.
The overall mortality increased very slightly in the second seven-year period, at the expense of the over 85s. In the group with NIV, it decreased in the second seven-year period (8.5 per 100 versus 12.2) (Table 3), except in individuals aged 45–64 years, where it increased. In the group with IMV, the mortality fell in the second seven-year period, with a more significant decrease in patients over 85 years, while it increased slightly in patients without any type of ventilatory intervention. In the first seven-year period, the mortality in the NIV group was almost triple the mortality in the group without intervention, while in the second, it was double (8.4 versus 4.4 per 100 discharges) (Table 3).
The mean stay (MS) decreased in the second seven-year period in the NIV and IMV groups, remaining stable in the group with no ventilatory intervention. The MS in the NIV group had intermediate values between the other two groups (Table 3).
The comorbidity (Charlson Index) in the IMV group (1.6) was similar to that of patients who did not receive any intervention (1.5) and lower than the NIV group (2.0), increasing in the second seven-year period (Table 3).
DiscussionThis study is the first to analyse (using clinical-administrative databases) the introduction of NIV into routine clinical practice, of all patients treated for COPD exacerbation (more than 30000 discharges) in all public hospitals (9) of a geographical region (with 1500000 inhabitants) over a long period of time (14 years). Almost all the studies published in relation to this subject are based on surveys among professionals,25–28 and in fact we only found one similar study conducted in the United States12 on patients with COPD in a sample of hospitals during a 10-year period (1998–2008).
Although the hospital attendance of patients with COPD exacerbation decreased in the period studied, the use of NIV (12.1% of patients in the last year) showed an upward trend, which occurred at the expense of both the decrease in the patient group in which no ventilatory techniques were applied and in the IMV group, although in the latter case the change was not statistically significant: these same trends were observed when the annual percentage change in each group was studied (Fig. 3). The overall mortality (9.5% in the last year) and mortality in the patient group with no intervention showed an upward trend, although the change was not statistically significant in either case. It decreased in the intervention groups but only reached statistical significance in the NIV group. In summary, the introduction of NIV has been primarily directed towards those patients not previously ventilated, and its use has not affected the overall mortality.
. Murcia region 1997–2010. NVI, no ventilatory intervention; NIV, non-invasive mechanical ventilation; IMV, invasive mechanical ventilation.")
The evolution of the use of NIV has followed a pattern similar to that expected: a gradual increase at the beginning that increased more strongly as the years passed and the technique became more consolidated, although no trend change was identified in any specific year. This situation, as in the American study,12 was accompanied by a decrease in the use of IMV, although this trend was not statistically significant in the present study. The proportion of patients with some type of ventilatory support was slightly lower than that observed in the aforementioned study (6.9% versus 8.1%). Of the ventilated patients, more than 60% were ventilated with NIV; this rate is higher than those described in the survey-based studies25,26,34 and in the first study mentioned,12 where only around 34% of ventilated patients were initially treated with NIV.
In comparison to the American study,12 it can be seen that the mortality rates in the patients treated with either non-invasive or invasive ventilation are similar. The mortality rates found for the group treated with NIV in both studies, as well as those described in another prospective, observational study on some 9000 patients with COPD conducted in the United Kingdom in 201135 are higher than those of clinical trials. This higher mortality in routine practice, which was observed particularly in the initial period in our case, could be explained by certain biases in the selection of the first patients treated with NIV, its use as ceiling treatment in very seriously ill patients or the learning curve of the technique, among other factors that the information source used did not record, and may be the reason for the decrease in mortality observed in the second seven-year period. In the American study,12 the mortality decreased significantly in the three patient groups, while in our case the behaviour was different, as the mortality decreased in the two intervention groups (without statistical significance in the IMV group), but not in the group of patients in whom no ventilatory technique was applied.
With the information available, the differences in the mortality trends cannot be explained by changes in the comorbidity of the patients. The mortality trend observed in the no-intervention group, together with the decrease in the population rates in this group over the years, seems to support the possible use of NIV in our region in less seriously ill patients who, prior to its introduction, were not treated with any type of ventilatory support.
The introduction of NIV does not appear to have notably influenced the mean patient stay.
The use of clinical-administrative databases, despite its advantages (availability of information, low costs, among others), also has limitations. Although the information available and the patients seem reasonably homogeneous, especially in the last 10 years of the study, it is obvious that the abovementioned source does not include relevant and accurate clinical information on the severity of the respiratory disease at the time of admission (blood gases), the patients’ previous clinical status, response to NIV treatment, or their location within the hospital (ICU admissions). Furthermore, by using the ICD-9-CM codes to identify patients with COPD, and to define the intervention groups, there may be some misclassification bias due to coding errors and/or changes in the coding standards which have occurred over the period.
The improvement in the information source used over the period studied does not appear to have influenced the results. An increase was observed in the completeness of the MBDS-HD, but information was available from the beginning on at least 90% of all patients treated for all causes. The improvement in the process for preparing discharge reports, based on the information contained in the MBDS-HD, and its coding results in an increase in the mean number of diagnoses and, consequently, the Charlson Index. The high correlation between these two indicators together with the small differences in the value of the Charlson Index between the intervention groups suggests that, rather than an increase in the complexity of the patients, there has been an improvement in the coding process. Moreover, it is clear that the Index does not have predictive value for the severity of the patient in terms of needing to use assisted ventilation or not.
In conclusion, this study appears to indicate that the introduction of NIV in the Murcia Region has primarily affected patients who would not previously have been placed on assisted ventilation. No improvement was noted in results, in terms of mortality or overall mean stay, linked to its introduction. Conducting studies with more accurate information sources (studies based on medical records, economic studies) would allow us to more accurately determine the benefits that NIV has brought to the treatment of these patients, and to redirect, if necessary, the indications for this technology in Murcian hospitals.
Conflict of InterestsThe authors work for the public healthcare system and have not received any financial assistance or grants from companies associated with these technologies. No external funding has been received for conducting this study.
Please cite this article as: Carpe-Carpe B, et al. Evolución del uso de la ventilación mecánica no invasiva en enfermedad pulmonar obstructiva crónica en una región española, 1997-2010. Arch Bronconeumol. 2013;49:330–6.


