Introduction
Obstructive sleep apnea-hypopnea syndrome (OSAHS) is a disorder that affects between 1% and 4% of the general population.1,2 At present polysomnography is considered the test of choice for establishing a diagnosis of OSAHS and evaluating its severity. Traditionally, sleep stages are scored by hand according to previously established criteria.3 However there is interobserver variability in the analysis of polysomnographic data and furthermore the process consumes a great deal of time and resources. Modern polygraphs incorporate systems that automatically analyze neurological parameters and record respiratory episodes, oxygen desaturation, and respiratory movements. Such automatic systems are not sufficiently validated and lack precision in discriminating sleep stages or detecting respiratory episodes in clinical practice. Given the differences between various kinds of sleep analysis, it was decided to undertake a study comparing hand and automatic scoring of the variables obtained by the 16-channel polygraphic system Somnostar α 4100 (SensorMedics Corporation, Yorba Linda, California, USA).
Materials and Methods
The study took place at the Hospital Mútua de Terrassa, a referral hospital in the town of Terrassa, near Barcelona, that serves a population of 200 000 inhabitants. Attached to its Department of Respiratory Medicine, the hospital has a sleep clinic that is equipped to carry out standard polysomnography and respiratory polygraphy.
Twenty-eight patients with a diagnosis of suspected OSAHS were referred from the outpatients' clinic of the Department of Respiratory Medicine and studied over a period of 3 months. All patients underwent chest x-ray, forced spirometry, and blood testing, and all completed an Epworth questionnaire. All patients then underwent attended conventional polysomnography (Somnostar α4100) in the hospital's sleep unit. Parameters from the following tests were monitored: 4 electroencephalogram (EEG) channels (EEG; C4-A1, C3-A2, O1-A2, O2-A1), electrooculogram, chin and tibial electromyograms, and electrocardiogram. Oronasal airflow was recorded using a thermistor sensor, thoracic and abdominal movements using piezoelectric sensors, and oxygen saturation in arterial blood using pulse oximetry. The nasal pressure wave was not monitored because the equipment was not available, and this represents a limitation of the study. Apnea was defined as a cessation of oronasal airflow lasting for at least 10 seconds, and hypopnea as a significant reduction of oronasal airflow and/or thoracic-abdominal movements accompanied by arousals and/or oxygen desaturation of 3% or more. Arousal was defined as an increase in the frequency of the EEG lasting for more than 3 seconds subject to certain conditions, following the guidelines of the American Sleep Disorders Association.4 OSAHS was diagnosed when the apnea-hypopnea index (AHI) obtained by standard polysomnography was greater than 10 per hour. None of the patients had previously initiated continuous positive airway pressure treatment. One member of the research team (BB) carried out manual and automatic readings of the polysomnographic variables in random order. The Somnostar α 4100 traces out its results automatically but these marks were removed before hand scoring and therefore did not influence the manual readings. Hand scoring of the different sleep stages was carried out according to the parameters previously established by Rechtscaffen and Kales.3 Automatic interpretation of the EEG was carried out by the software of the Somnostar α 4100, which uses spectral analysis. In spectral analysis a mathematical algorithm identifies the amplitude and frequency of the EEG waves and classifies them as delta, theta, alpha, or beta. The same algorithm is applied to the signal given by the electrooculogram. Respiratory episodes were analyzed and recorded automatically by the Somnostar α 4100, whose system establishes a baseline by taking the mean number of breaths in the 2 minutes preceding the event. It defines apnea as a reduction in oronasal airflow of greater than 80% from baseline, and hypopnea as a decrease in oronasal airflow of at least 50% from baseline associated with 4% oxygen desaturation. The results are expressed as means with SD between parentheses. The intraclass correlation coefficient was used to establish agreement between the 2 types of analysis. To obtain a graphic representation of the difference between the 2 types of analysis, we used the Bland and Altman5 method for assessing agreement between 2 methods of clinical measurement expected to yield the same results. The sensitivity, specificity, and positive and negative predictive values of the respiratory parameters were calculated on the basis of the manual analysis using as reference an AHI of 10 obtained by standard polysomnography. A value of P<.05 was considered to be statistically significant.
Results
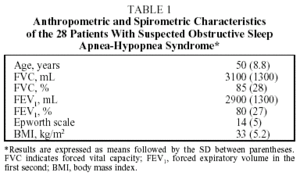
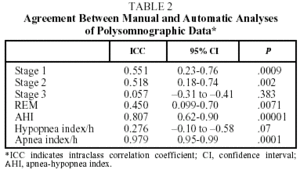
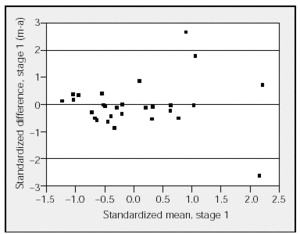
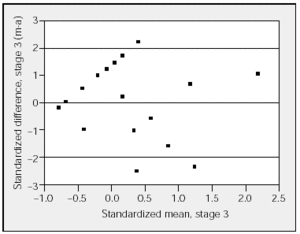
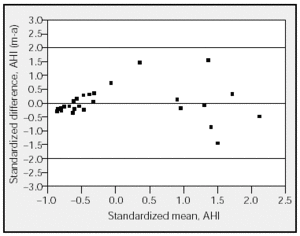
Twenty eight patients (21 men, 7 women) with a mean age of 50 took part in the study. The anthropometric and lung function characteristics in Table 1 show that they were moderately obese patients with excessive daytime sleepiness. The final diagnosis established by manual analysis was OSAHS in 20 cases. Eight patients did not have OSAHS. There was moderate agreement between automatic and manual analysis on sleep parameters and on most respiratory parameters (Table 2). Automatic analysis tended to underestimate the duration of the stages of REM sleep (P<.007) and deep sleep (P<.3) but there was moderate agreement for light sleep (stages 1 and 2). Agreement between the 2 kinds of analysis on respiratory parameters was high, both for the final AHI (P<.0001) and for the apneas (P<.0001). However, agreement was low for hypopneas, which were underestimated by automatic analysis. The graphic representation showed substantial differences between the 2 methods in recording sleep stages, due fundamentally to lack of precision in the automatic analysis (Figures 1 and 2). Comparison of respiratory episodes showed few differences with regard to the AHI (Figure 3). However there was a definite reduction in agreement as the number of episodes (mostly hypopneas) increased.
Figure 1. Comparison of the standardized difference between manual (m) and automatic (a) analyses for stage 1 with the standardized mean for stage 1. The horizontal lines represent the upper and lower limits of agreement (95% confidence interval).
Figure 2. Comparison of the standardized difference between manual (m) and automatic (a) analyses for stage 3 with the standardized mean for stage 3. The horizontal lines represent the upper and lower limits of agreement (95% confidence interval).
Figure 3. Comparison of the standardized difference between the apnea-hypopnea index (AHI) in manual (m) and automatic (a) analyses with the standardized mean. The horizontal lines represent the upper and lower limits of agreement (95% confidence interval).
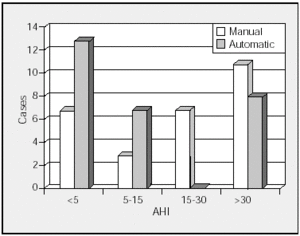
When the data was stratified by AHI for analysis, manual analysis provided few new diagnoses among patients with an AHI over 30. However, for patients with an AHI between 15 and 30, manual analysis gave 7 more positive diagnoses, 25% of the 28 cases studied (Figure 4).
Figure 4. Stratification of respiratory episodes by automatic and manual analyses. AHI indicates apnea-hypopnea index.
If we take manual analysis as the gold standard, automatic analysis at an AHI cut point greater than 10 had a sensitivity of 55%, a specificity of 100%, a positive predictive value of 100%, a negative predictive value of 47%, and an overall diagnostic yield of 67.8%.
Discussion
This study confirms that the automatic analysis of respiratory and neurological variables carried out by the Somnostar α 4100 is less sensitive than manual analysis. Agreement between the 2 types of analysis is good for the AHI but poor for sleep stages, especially deep sleep and REM.
Automatic methods of analysis of respiratory variables can be useful as they provide information about additional variables such as the duration of respiratory episodes, mean and minimum saturation, and the percentage of recording time with oxygen saturation less than 90%. They also measure snoring and body position. Compared with manual analysis, automatic methods tend to underestimate AHI, mostly because they fail to recognize hypopneas.6 The sensitivity and specificity of automatic analysis varies according to what is being measured. In this study automatic analysis underestimated AHI, especially if the number of respiratory episodes was low (less than 30) and hypopneas predominated. In addition, when the AHI was greater than 10, sensitivity and negative predictive values were 55% and 47%, respectively. This is probably tied to the failure to detect hypopneas, the reason why a manual analysis of respiratory variables is necessary. Similar results were published in a study by Zucconi et al,7 in which automatic and/or semi-automatic analysis of respiratory variables had high sensitivity and specificity for high AHI cut points but not for low ones. However, some authors have found good correlation for AHI calculated by the 2 kinds of analysis.8 Correlation has largely depended on the type of automatic system used. Authors who have evaluated systems of analysis that are less complex than conventional polysomnography have found that assisted manual analysis in such simplified systems does not have a higher diagnostic yield than automatic analysis.9 Other authors have seen that manual analysis is better than automatic scoring.10,11
Automatic systems of sleep analysis have improved over the past few years. However they underestimate total and stage 2 sleep time, mostly due to difficulty identifying the K-waves and spindles. They also overestimate stage 1, but stage 3 and REM readings are little affected.12 In this study agreement between the 2 types of analysis was moderate for the stages of light sleep and low for the deep sleep and REM stages.
There are various ways of analyzing EEGs using a spectral frequency index.13 The main advantage of spectral analysis over visual analysis is that the stages of deep sleep are assessed continuously and more objectively.
Certain computerized methods detect sleep spindles automatically by quantifying the frequency and amplitude of EEG waves.14 With this type of analysis there is also a reduction in the number of artifacts. It is therefore a very flexible method.
Philip-Joet et al15 achieved 81% total agreement, 11% partial agreement, and 8% disagreement between spectral analysis of EEGs and manual analysis. With spectral analysis the reliability of the EEG reading can be estimated rapidly. However in this study we found low agreement between the 2 types of analysis for sleep stages, especially deep sleep and REM. Probably the program for automatic analysis did not correctly identify spindles and K-waves. Nor did the program correctly identify the REM stage, which is sometimes confused with stage 1 because eye movements are interpreted incorrectly.
Several factors can modify the characteristics and interpretation of the EEG. First, the so-called "first night effect" causes an increase in the amount of time spent awake, a decrease in total sleep time, a reduction in sleep efficiency, and a reduction in REM stage sleep.16 Second, interobserver variability, with a level of agreement between different technicians of between 82% and 88%, also affects interpretation.17,18 Interobserver variability was not taken into account in the present study because the same researcher recorded all the readings. Third, intraobserver variability may slightly affect the manual readings of polysomnographic results and the fact that we did not assess it represents a limitation of our study.
At present, systems of automatic analysis used by polygraphic screening devices have limited sensitivity and specificity as they provide inadequate readings of some respiratory episodes (hypopneas) and of sleep stages.6 However, as automatic analysis can simplify sleep assessment, automatic polygraphy during sleep followed by manual analysis is now recommended.19
In conclusion, conventional manual polysomnography is the most sensitive and specific method for correctly stratifying sleep stages and recording respiratory episodes. It is important to assess new automatic systems for use in day-to-day clinical practice and in this way increase available resources.
Acknowledgments
The authors would like to thank Dr. F. Barbé, from the Hospital Universitari Son Dureta for his help in writing this article.
Correspondence: Dr. B. Barreiro López.
Servicio de Neumología. Hospital Mútua de Terrassa.
Pza. Dr. Robert, 5. 08221 Terrassa. Barcelona, España.
E-mail: pneumologia@mutuaterrassa.es
Manuscript received March 5, 2003. Accepted for publication July 1, 2003.


