


Although COPD may frequently co-exist with bronchiectasis [COPD-bronchiectasis associated (CBA)], little is known regarding the clinical heterogeneity. We aimed to identify the phenotypes and compare the clinical characteristics and prognosis of CBA.
MethodsWe conducted a retrospective cohort study involving 2928 bronchiectasis patients, 5158 COPD patients, and 1219 patients with CBA hospitalized between July 2017 and December 2020. We phenotyped CBA with a two-step clustering approach and validated in an independent retrospective cohort with decision-tree algorithms.
ResultsCompared with patients with COPD or bronchiectasis alone, patients with CBA had significantly longer disease duration, greater lung function impairment, and increased use of intravenous antibiotics during hospitalization. We identified five clusters of CBA. Cluster 1 (N=120, CBA-MS) had predominantly moderate–severe bronchiectasis, Cluster 2 (N=108, CBA-FH) was characterized by frequent hospitalization within the previous year, Cluster 3 (N=163, CBA-BI) had bacterial infection, Cluster 4 (N=143, CBA-NB) had infrequent hospitalization but no bacterial infection, and Cluster 5 (N=113, CBA-NHB) had no hospitalization or bacterial infection in the past year. The decision-tree model predicted the cluster assignment in the validation cohort with 91.8% accuracy. CBA-MS, CBA-BI, and CBA-FH exhibited higher risks of hospital re-admission and intensive care unit admission compared with CBA-NHB during follow-up (all P<0.05). Of the five clusters, CBA-FH conferred the worst clinical prognosis.
ConclusionBronchiectasis severity, recent hospitalizations and sputum culture findings are three defining variables accounting for most heterogeneity of CBA, the characterization of which will help refine personalized clinical management.

Both bronchiectasis and chronic obstructive pulmonary disease (COPD) are common chronic airway inflammatory diseases with many shared manifestations such as chronic cough, sputum production and/or dyspnea.1,2 Bronchiectasis is defined as the persistent and irreversible dilation of bronchi, while COPD denotes the incompletely reversible airflow limitation associated with pollutant exposures.1 Despite the notable heterogeneity of manifestations and pathophysiology, some patients reportedly had co-existing COPD and bronchiectasis – the COPD-bronchiectasis association (CBA).3 The prevalence of bronchiectasis ranged from 4.0% to 75.0% among COPD patients, and COPD from 8.8% to 32.0% among patients with bronchiectasis.3 This has been attributable to the inconsistency in diagnostic criteria and disease severity measures.
Addressing the knowledge gap in the clinical characteristics of CBA compared with bronchiectasis and COPD alone represents an important first step to improve the clinical management of CBA. Clinically, CBA could have originated from the progression of either bronchiectasis or COPD, thus representing the “hub” linking the aetiologically distinct disease entities.4,5 Apart from the differences in the underlying etiology, CBA may encompass distinct subgroups with diverse risk factor exposures, radiologic manifestations, lung function impairment and airway infections.6–8 However, there remains a paucity of medical evidence depicting the landscape of the diverse clinical characteristics of CBA among in-hospital adult patients.
We conducted a cross-sectional study of CBA, COPD, and bronchiectasis alone, comparing the clinical characteristics among the three groups from a large cohort in the hospital information system. Specifically, we explored the heterogeneity of CBA with unsupervised clustering approach9,10 via retrospective electronic medical record review spanning from 2.5 to 6.0 years, and documented the hospitalization outcomes. We also included an independent validation set of CBA for testing the robustness of the classifications. Unveiling the heterogeneity regarding the clinical characteristics and outcomes may prompt better personalized treatment and prognostic assessment of CBA.
MethodsStudy participantsWe included anonymized electronic medical records (EMRs) from inpatients aged 18–80 years hospitalized in The First Affiliated Hospital of Guangzhou Medical University (a tertiary hospital specialized in respiratory and critical care medicine) between July 2017 and December 2020 (training set), and between January 2021 and December 2022 (validation set) because of exacerbation onset. All hospitalized patients had a primary discharge physician-diagnosis of COPD (ICD-10-CM code: J44.), bronchiectasis (ICD-10-CM code: J47.) or both. Apart from extracting ICD-10 codes for diagnosis, we integrated chest high-resolution computed tomography (HRCT) and symptoms for confirming the diagnosis of bronchiectasis.1 Furthermore, we integrated spirometric findings and clinical symptoms to jointly diagnose COPD.2 We excluded patients with CBA without HRCT and spirometric results within 1 year (before and after hospitalization). The study was approved by ethics committee (ES-2023-K008-03) and additional informed consent was waived for the retrospective cohort.
Study design and data extractionWe retrospectively extracted EMRs from hospital information system, including demographics [age, gender, body-mass index (BMI), residency], medical history (disease duration, smoking history, number of exacerbations in the past year, etc.), major comorbidities (asthma, cor pulmonale, hypertension, diabetes, etc.), symptoms and signs (cough, phlegm, shortness of breath, chest pain, hemoptysis), HRCT findings (modified Reiff score, emphysema, etc.), spirometry [forced vital capacity percentage predicted (FVC% pred), forced expiratory volume in one second percentage predicted (FEV1% pred) and FEV1/FVC%], laboratory findings (blood routine test, sputum culture, C-reactive protein, total IgE, etc.), medications, clinical outcomes [length of stay, non-invasive ventilation, invasive ventilation, intensive care unit (ICU) admissions, re-admission, etc.]. We adopted the Charlson Comorbidities Index (CCI) for assessment of comorbidities, and the modified Reiff scores to evaluate the radiologic severity of bronchiectasis (mild: 1–6; moderate: 7–12; severe: 13–18 points). The Bronchiectasis Severity Index (BSI) was computed for patients with CBA. Because the modified Medical Research Council dyspnea scale was not recorded from EMR,11 we estimated this scale based on patient's description of dyspnea in the present history as a proxy.
For the cross-sectional data analysis, we only included the findings of the first examination soon after admission among patients who underwent multiple examinations during the same hospitalization. For patients with missing data of HRCT and spirometry during hospitalization, we replaced these with the data from our study site within 1 year before and after hospitalization for subsequent analysis. We included only the single most complete hospital examination record for patients with multiple admissions within 1 year. We also conducted a longitudinal follow-up of CBA patients by capturing any of their subsequent electronic health records, extending until June 2023.
Variable selectionWe collected 95 variables from the retrospective study (Fig. 1, Table S1, online supplement). We excluded variables with missing data among >15% of patients (N=29), no direct relevance to CBA classification (N=36) and medications and outcomes (N=13). For the remaining 17 variables, we performed multiple imputation for missing data with multi-level generalized linear regression model.12 Next, we performed an exploratory factor analysis13 for continuous variables (Table S2) or system hierarchical clustering analysis14 for categorical variables (Fig. S1) with the remaining 17 variables, thereby leaving six variables in the clustering analysis. These included the modified Reiff score category (mild vs. moderate-to-severe), hospitalizations in the past year (0 vs. 1–2 vs. ≥3 times), sputum culture (positive vs. negative), blood neutrophil count, blood eosinophil count, and the CCI (Fig. 2).

 Importance ranking of the clustering variables. Comparison of the grading of hospitalization in the past year (B), bronchiectasis severity (modified Reiff score category) (C), sputum culture findings (D), blood neutrophil (E), Charlson comorbidity index (F), blood eosinophil (G).")
Ranking of the contribution of variables for clustering analysis and the core variables. (A) Importance ranking of the clustering variables. Comparison of the grading of hospitalization in the past year (B), bronchiectasis severity (modified Reiff score category) (C), sputum culture findings (D), blood neutrophil (E), Charlson comorbidity index (F), blood eosinophil (G).
We employed a two-step clustering approach for patient categorization, beginning with the data compression into small subclusters to manage complex data sets effectively. This method utilized the log-likelihood distance for categorical data and the Euclidean distance for continuous variables to create dense subclusters. Following this step, an agglomerative hierarchical clustering method merged these subclusters based on the Ward's method. This has not only facilitated the efficient analysis of mixed data types but also automatically identified the most statistically significant cluster configuration, optimizing the handling of complex datasets.15 We then applied a decision-tree algorithm to all variables in clustering analysis to predict the specific cluster for individual patients, which allowed for calculation of the rates of misclassification.16
Validation setWe further included an independent CBA validation cohort (hospitalized between January, 2021 and December, 2022 and 348 patients who had overlapped with the training set have been excluded). By comparing the clinical characteristics of CBA in the discovery cohort with those in validation cohort, we sought to confirm the robustness of clustering findings.
Statistical analysisWe summarized categorical variables as frequencies and proportions. We tested continuous variables for the Gaussian distribution (Kolmogorov–Smirnov test) and expressed as mean±standard deviation (SD) or median (interquartile range, IQR) as appropriate. We evaluated the differences between clusters for each variable using analysis-of-variance or Kruskal–Wallis test for continuous variables and Chi-square test or Fisher's exact test for categorical variables. Unless otherwise specified, we applied Bonferroni correction to two-group comparisons. We adopted multivariate Logistic regression models to analyze the risks of clinically significant events (e.g., ICU admission) during longitudinal follow-up, with the hazards ratio (HR) and 95% confidence interval (95%CI) being demonstrated. We defined statistical significance as two-sided P<0.05. We conducted statistical analyses using SPSS (Version 25.0; IBM Corp., Armonk, NY).
ResultsPatient recruitment in training setWe initially identified 6635 patients with bronchiectasis alone, 15,356 with COPD alone, and 2109 with CBA. After exclusion of repeated inpatient records, 4511 and 9320 patients had a diagnosis of bronchiectasis and COPD, respectively. The corresponding proportion of CBA was 29.9% in bronchiectasis and 14.5% in COPD, respectively. Finally, after excluding patients with malignant tumor, we included 2928 patients with bronchiectasis, 5158 with COPD, and 1219 with CBA (Fig. 1).
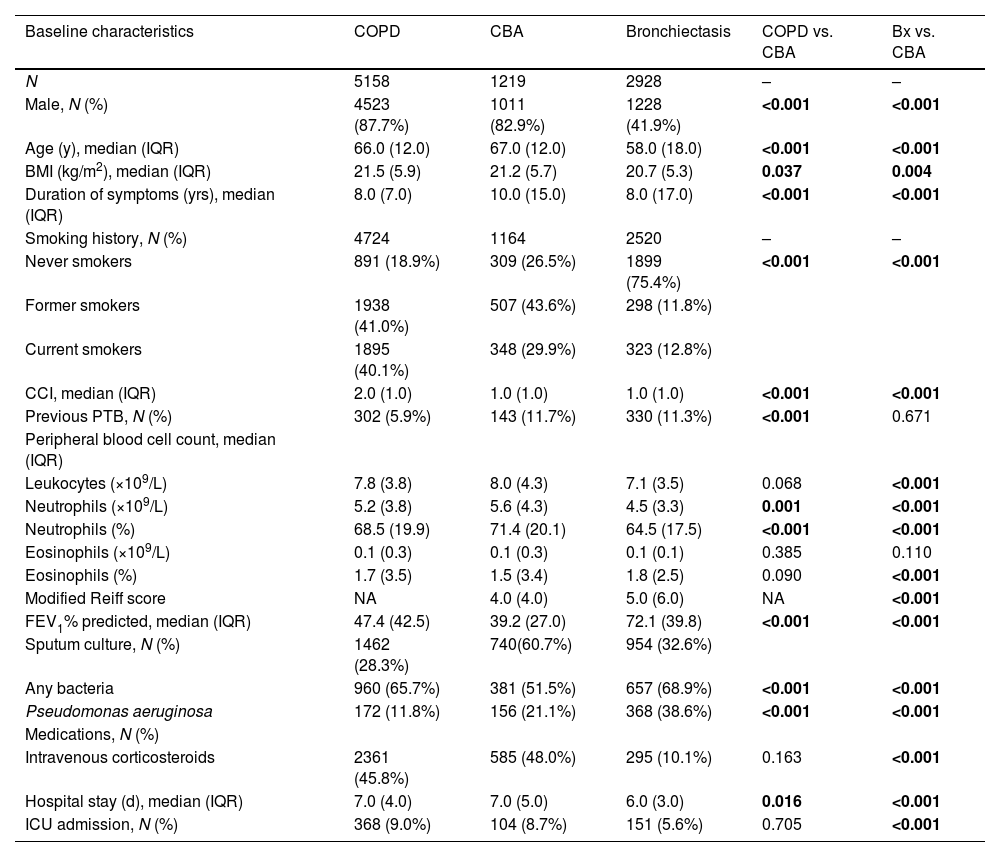
Clinical characteristics of CBA in training setCompared with COPD or bronchiectasis alone, CBA was consistently associated with a markedly greater age, longer disease duration, a higher proportion of patients with emphysema, higher blood neutrophil percentage, higher detection rate of Pseudomonas aeruginosa and more pronounced lung function impairment, evidenced by lower FEV1/FVC, FEV1%pred and FVC% pred (all P<0.001).
The proportion of intravenous antibiotic use was significantly higher in CBA (P<0.001). CBA yielded non-significantly higher proportion of patients with comorbidities (e.g. pulmonary aspergillosis, cor pulmonale), a longer length of hospital stay, and more frequent receipt of invasive ventilation and ICU admission compared with COPD or bronchiectasis alone (Table 1, Tables S3 and S4).
Demographic characteristics, medication, laboratory tests, hospitalization outcomes of patients with CBA, COPD, and bronchiectasis in the training set.
| Baseline characteristics | COPD | CBA | Bronchiectasis | COPD vs. CBA | Bx vs. CBA |
|---|---|---|---|---|---|
| N | 5158 | 1219 | 2928 | – | – |
| Male, N (%) | 4523 (87.7%) | 1011 (82.9%) | 1228 (41.9%) | <0.001 | <0.001 |
| Age (y), median (IQR) | 66.0 (12.0) | 67.0 (12.0) | 58.0 (18.0) | <0.001 | <0.001 |
| BMI (kg/m2), median (IQR) | 21.5 (5.9) | 21.2 (5.7) | 20.7 (5.3) | 0.037 | 0.004 |
| Duration of symptoms (yrs), median (IQR) | 8.0 (7.0) | 10.0 (15.0) | 8.0 (17.0) | <0.001 | <0.001 |
| Smoking history, N (%) | 4724 | 1164 | 2520 | – | – |
| Never smokers | 891 (18.9%) | 309 (26.5%) | 1899 (75.4%) | <0.001 | <0.001 |
| Former smokers | 1938 (41.0%) | 507 (43.6%) | 298 (11.8%) | ||
| Current smokers | 1895 (40.1%) | 348 (29.9%) | 323 (12.8%) | ||
| CCI, median (IQR) | 2.0 (1.0) | 1.0 (1.0) | 1.0 (1.0) | <0.001 | <0.001 |
| Previous PTB, N (%) | 302 (5.9%) | 143 (11.7%) | 330 (11.3%) | <0.001 | 0.671 |
| Peripheral blood cell count, median (IQR) | |||||
| Leukocytes (×109/L) | 7.8 (3.8) | 8.0 (4.3) | 7.1 (3.5) | 0.068 | <0.001 |
| Neutrophils (×109/L) | 5.2 (3.8) | 5.6 (4.3) | 4.5 (3.3) | 0.001 | <0.001 |
| Neutrophils (%) | 68.5 (19.9) | 71.4 (20.1) | 64.5 (17.5) | <0.001 | <0.001 |
| Eosinophils (×109/L) | 0.1 (0.3) | 0.1 (0.3) | 0.1 (0.1) | 0.385 | 0.110 |
| Eosinophils (%) | 1.7 (3.5) | 1.5 (3.4) | 1.8 (2.5) | 0.090 | <0.001 |
| Modified Reiff score | NA | 4.0 (4.0) | 5.0 (6.0) | NA | <0.001 |
| FEV1% predicted, median (IQR) | 47.4 (42.5) | 39.2 (27.0) | 72.1 (39.8) | <0.001 | <0.001 |
| Sputum culture, N (%) | 1462 (28.3%) | 740(60.7%) | 954 (32.6%) | ||
| Any bacteria | 960 (65.7%) | 381 (51.5%) | 657 (68.9%) | <0.001 | <0.001 |
| Pseudomonas aeruginosa | 172 (11.8%) | 156 (21.1%) | 368 (38.6%) | <0.001 | <0.001 |
| Medications, N (%) | |||||
| Intravenous corticosteroids | 2361 (45.8%) | 585 (48.0%) | 295 (10.1%) | 0.163 | <0.001 |
| Hospital stay (d), median (IQR) | 7.0 (4.0) | 7.0 (5.0) | 6.0 (3.0) | 0.016 | <0.001 |
| ICU admission, N (%) | 368 (9.0%) | 104 (8.7%) | 151 (5.6%) | 0.705 | <0.001 |
COPD, Chronic Obstructive Pulmonary Disease; CBA, COPD-bronchiectasis association; Bx, bronchiectasis; IQR, interquartile range; SD, standard deviation; BMI, body-mass index; CCI, Charlson Comorbidity Index; PTB, pulmonary tuberculosis; FEV1: forced expiratory volume in one second; FVC: forced vital capacity; ICU, intensive care unit; NA, not applicable.
Of the 1219 hospitalized patients with CBA, 572 were excluded due to missing spirometry or HRCT records. The clinical characteristics of 647 patients who were included in and those excluded from clustering analysis were comparable in terms of gender distribution (males: 82.5% vs. 83.4%), age (median: 68 vs. 67 years), BMI (median: 21.3 vs. 21.0kg/m2), CCI (median: 1.0 vs. 1.0), and the proportion of patients admitted to ICU (8.2% vs. 9.3%) (all P>0.05, Table S5).
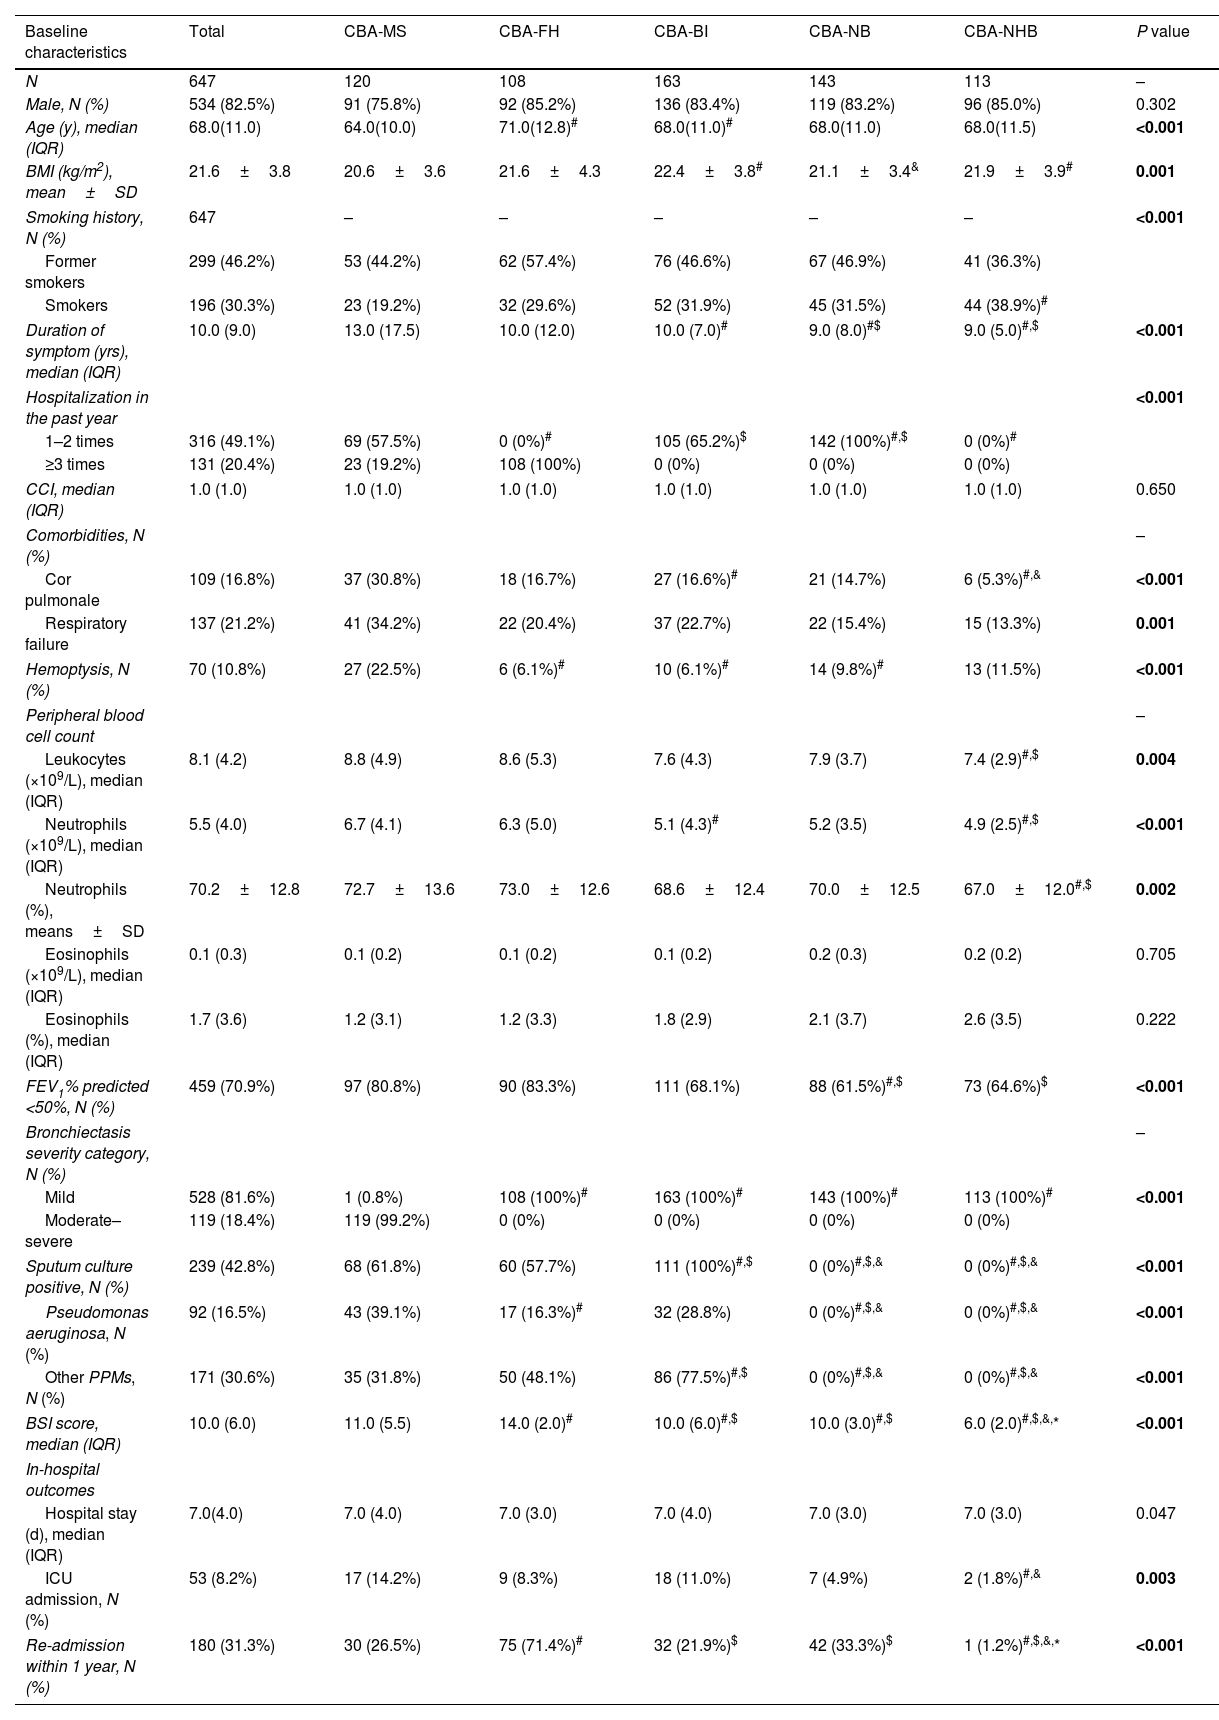
We identified five clusters of CBA (Table 2, Tables S6 and S7). Based on the stepwise discriminant analysis, the most influential variables were ordered as hospitalization in the past year (1.000), bronchiectasis severity (0.745), sputum culture (0.494), neutrophil count (0.023), eosinophils count (0.001) and CCI (0.001) (Fig. 2).
Demographic and clinical characteristics of five clusters of inpatients with CBA in the training set.
| Baseline characteristics | Total | CBA-MS | CBA-FH | CBA-BI | CBA-NB | CBA-NHB | P value |
|---|---|---|---|---|---|---|---|
| N | 647 | 120 | 108 | 163 | 143 | 113 | – |
| Male, N (%) | 534 (82.5%) | 91 (75.8%) | 92 (85.2%) | 136 (83.4%) | 119 (83.2%) | 96 (85.0%) | 0.302 |
| Age (y), median (IQR) | 68.0(11.0) | 64.0(10.0) | 71.0(12.8)# | 68.0(11.0)# | 68.0(11.0) | 68.0(11.5) | <0.001 |
| BMI (kg/m2), mean±SD | 21.6±3.8 | 20.6±3.6 | 21.6±4.3 | 22.4±3.8# | 21.1±3.4& | 21.9±3.9# | 0.001 |
| Smoking history, N (%) | 647 | – | – | – | – | – | <0.001 |
| Former smokers | 299 (46.2%) | 53 (44.2%) | 62 (57.4%) | 76 (46.6%) | 67 (46.9%) | 41 (36.3%) | |
| Smokers | 196 (30.3%) | 23 (19.2%) | 32 (29.6%) | 52 (31.9%) | 45 (31.5%) | 44 (38.9%)# | |
| Duration of symptom (yrs), median (IQR) | 10.0 (9.0) | 13.0 (17.5) | 10.0 (12.0) | 10.0 (7.0)# | 9.0 (8.0)#$ | 9.0 (5.0)#,$ | <0.001 |
| Hospitalization in the past year | <0.001 | ||||||
| 1–2 times | 316 (49.1%) | 69 (57.5%) | 0 (0%)# | 105 (65.2%)$ | 142 (100%)#,$ | 0 (0%)# | |
| ≥3 times | 131 (20.4%) | 23 (19.2%) | 108 (100%) | 0 (0%) | 0 (0%) | 0 (0%) | |
| CCI, median (IQR) | 1.0 (1.0) | 1.0 (1.0) | 1.0 (1.0) | 1.0 (1.0) | 1.0 (1.0) | 1.0 (1.0) | 0.650 |
| Comorbidities, N (%) | – | ||||||
| Cor pulmonale | 109 (16.8%) | 37 (30.8%) | 18 (16.7%) | 27 (16.6%)# | 21 (14.7%) | 6 (5.3%)#,& | <0.001 |
| Respiratory failure | 137 (21.2%) | 41 (34.2%) | 22 (20.4%) | 37 (22.7%) | 22 (15.4%) | 15 (13.3%) | 0.001 |
| Hemoptysis, N (%) | 70 (10.8%) | 27 (22.5%) | 6 (6.1%)# | 10 (6.1%)# | 14 (9.8%)# | 13 (11.5%) | <0.001 |
| Peripheral blood cell count | – | ||||||
| Leukocytes (×109/L), median (IQR) | 8.1 (4.2) | 8.8 (4.9) | 8.6 (5.3) | 7.6 (4.3) | 7.9 (3.7) | 7.4 (2.9)#,$ | 0.004 |
| Neutrophils (×109/L), median (IQR) | 5.5 (4.0) | 6.7 (4.1) | 6.3 (5.0) | 5.1 (4.3)# | 5.2 (3.5) | 4.9 (2.5)#,$ | <0.001 |
| Neutrophils (%), means±SD | 70.2±12.8 | 72.7±13.6 | 73.0±12.6 | 68.6±12.4 | 70.0±12.5 | 67.0±12.0#,$ | 0.002 |
| Eosinophils (×109/L), median (IQR) | 0.1 (0.3) | 0.1 (0.2) | 0.1 (0.2) | 0.1 (0.2) | 0.2 (0.3) | 0.2 (0.2) | 0.705 |
| Eosinophils (%), median (IQR) | 1.7 (3.6) | 1.2 (3.1) | 1.2 (3.3) | 1.8 (2.9) | 2.1 (3.7) | 2.6 (3.5) | 0.222 |
| FEV1% predicted <50%, N (%) | 459 (70.9%) | 97 (80.8%) | 90 (83.3%) | 111 (68.1%) | 88 (61.5%)#,$ | 73 (64.6%)$ | <0.001 |
| Bronchiectasis severity category, N (%) | – | ||||||
| Mild | 528 (81.6%) | 1 (0.8%) | 108 (100%)# | 163 (100%)# | 143 (100%)# | 113 (100%)# | <0.001 |
| Moderate–severe | 119 (18.4%) | 119 (99.2%) | 0 (0%) | 0 (0%) | 0 (0%) | 0 (0%) | |
| Sputum culture positive, N (%) | 239 (42.8%) | 68 (61.8%) | 60 (57.7%) | 111 (100%)#,$ | 0 (0%)#,$,& | 0 (0%)#,$,& | <0.001 |
| Pseudomonas aeruginosa, N (%) | 92 (16.5%) | 43 (39.1%) | 17 (16.3%)# | 32 (28.8%) | 0 (0%)#,$,& | 0 (0%)#,$,& | <0.001 |
| Other PPMs, N (%) | 171 (30.6%) | 35 (31.8%) | 50 (48.1%) | 86 (77.5%)#,$ | 0 (0%)#,$,& | 0 (0%)#,$,& | <0.001 |
| BSI score, median (IQR) | 10.0 (6.0) | 11.0 (5.5) | 14.0 (2.0)# | 10.0 (6.0)#,$ | 10.0 (3.0)#,$ | 6.0 (2.0)#,$,&,* | <0.001 |
| In-hospital outcomes | |||||||
| Hospital stay (d), median (IQR) | 7.0(4.0) | 7.0 (4.0) | 7.0 (3.0) | 7.0 (4.0) | 7.0 (3.0) | 7.0 (3.0) | 0.047 |
| ICU admission, N (%) | 53 (8.2%) | 17 (14.2%) | 9 (8.3%) | 18 (11.0%) | 7 (4.9%) | 2 (1.8%)#,& | 0.003 |
| Re-admission within 1 year, N (%) | 180 (31.3%) | 30 (26.5%) | 75 (71.4%)# | 32 (21.9%)$ | 42 (33.3%)$ | 1 (1.2%)#,$,&,* | <0.001 |
IQR, interquartile range; SD, standard deviation; BMI, body mass index; CCI, Charlson Comorbidity Index; PTB, pulmonary tuberculosis. FEV1: forced expiratory volume in one second; FVC, forced vital capacity; HRCT, high-resolution computed tomography; CRP, C-reactive protein; OCS, oral corticosteroids; LABA, long-acting beta 2 agonist; LAMA: long-acting muscarinic antagonist; BSI, bronchiectasis severity index; ICU, intensive care unit.
Cluster 1 (CBA-MS, N=120) consisted of patients with predominantly moderate-to-severe bronchiectasis. Overall, CBA-MS exhibited more pronounced clinical symptoms and severe radiologic features of bronchiectasis. Apart from the highest Reiff score (median: 10.0), CBA-MS was characterized by the highest rate of cor pulmonale (30.8%), history of hemoptysis (22.5%) and detection of P. aeruginosa (39.1%). Regarding clinical outcomes, patients in CBA-MS yielded the highest rate of ICU admissions during hospitalization (14.2%).
Patients in cluster 2 (CBA-FH, N=108) had frequent hospitalization (more than 2 times) due to exacerbations of bronchiectasis in the past year. All patients had mild bronchiectasis and poorer lung function (83.8% had FEV1% predicted<50%: adjusted P<0.001). Patients with CBA-AE had a highest proportion of corticosteroids use (oral corticosteroids accounting for 40.7%, adjusted P=0.042), and the re-admission rate was highest (67.6%, adjusted P<0.001) among the five clusters.
Patients in cluster 3 (CBA-BI, N=163) consistently had bacterial infection as determined with sputum bacterial culture. By contrast, patients in cluster 4 (CBA-NB, N=143) had on average 1–2 hospitalizations per year but no bacterial infection The clinical characteristics of CBA-BI were overall similar with those of CBA-NB, except that CBA-BI had a higher proportion of patients with C-reactive protein >0.6mg/dl (86.5% vs. 64.2%) and antibiotics use (35.0% vs. 28.0%) (both adjusted P<0.05).
Cluster 5 (CBA-NHB, N=113) comprised patients with no bacterial infection or hospitalization in the past year. CBA-NHB yielded the lowest proportion of a history of cor pulmonale (5.3%) and procalcitonin>0.05ng/mL (29.9%) and consistently had mild bronchiectasis (100%). Although the rate of ICU admission (1.8%) and readmission within the past year (1.2%) was lowest in CBA-NB, the use of non-invasive (25.7%) and invasive ventilation (4.4%) was nominally lower than CBA-MS only.
Decision-tree analysis of training and validation setWe employed a decision-tree model to predict the cluster assignment (Fig. 3). Based on the three cardinal variables, bronchiectasis severity in HRCT, hospitalization in the past year and sputum culture, 91.8% (95% CI, 89.70–93.92%) of patients could be assigned to the correct cluster. Our model demonstrated a strong predictive accuracy, effectively identifying the true positives, as indicated by the high sensitivity (97.5% [95% CI, 96.26–98.68%]) and positive predictive values (96.0% [95% CI, 94.50–97.52%]). However, the specificity (55.6% [95% CI, 51.73–59.39%]) and negative predictive values (66.7% [95% CI, 63.04–70.30%]) revealed some further room for improvement in classifying the true negatives accurately. The moderate Matthews correlation coefficient (0.58 [95% CI, 0.45–0.69]) has highlighted the model's overall balanced performance in classification tasks (Table S8).
. The lower panel demonstrates the gradings for the five major variables or dimensions – lung function impairment, blood neutrophil count, detection of P. aeruginosa from sputum, ICU admission, readmission within 1 year of follow-up. The downward arrows indicate the decreased trend as compared with the normal levels, the plus signs denote the magnitude of increase or the likelihood of positivity as compared with the absence, the normal levels, and the minus signs signal the absence of the findings. ICU; intensive care unit.")
Scheme of predicting clinical cluster assignment and the major clinical characteristics of the clusters. Patients were assigned to the five clusters by using three core variables: bronchiectasis severity, hospitalization in the past year, and sputum culture (upper panel). The lower panel demonstrates the gradings for the five major variables or dimensions – lung function impairment, blood neutrophil count, detection of P. aeruginosa from sputum, ICU admission, readmission within 1 year of follow-up. The downward arrows indicate the decreased trend as compared with the normal levels, the plus signs denote the magnitude of increase or the likelihood of positivity as compared with the absence, the normal levels, and the minus signs signal the absence of the findings. ICU; intensive care unit.
Next, we included 218 inpatients with CBA (validation set) for validation of the clustering findings of the decision-tree model. Compared with the training set, there were no significant differences in the baseline distribution in gender, age, BMI, CCI and duration of symptoms (all P>0.05) (Fig. 1, Table S9). Five clusters were classified by applying the discriminant analysis findings of the decision-tree model. Comparison of clusters of the training set and validation set revealed no significant differences in the CCI, proportion of emphysema, FEV1% pred<50%, neutrophil ratio, length of hospital stay and the use of invasive ventilation (all P>0.05, Table S10).
Prognosis of CBA in training setWe analyzed the risks of oxygen therapy, non-invasive ventilation, mechanical ventilation and ICU admission with logistic regression after adjusting for the age, gender, BMI and CCI. Compared with CBA-NHB, CBA-MS (OR: 8.87, 95%CI: 1.98, 39.62, adjusted P=0.004), CBA-BI (OR: 6.87, 95%CI: 1.56, 30.38, adjusted P=0.011) and CBA-FH (OR: 4.81, 95%CI: 1.01, 22.91, adjusted P=0.048) consistently had a markedly higher risk of ICU admission (Fig. S2). We next employed Cox proportional regression analysis to investigate the risk of readmissions during longitudinal follow-up, which differed considerably among the clusters. Compared with CBA-NHB, CBA-FH (HR: 49.86, 95%CI: 18.24, 136.26, adjusted P<0.001), CBA-NB (HR: 19.18, 95%CI: 7.02, 52.42, adjusted P<0.001), CBA-MS (HR: 15.04, 95%CI: 5.43, 41.69, adjusted P<0.001) and CBA-BI (HR: 10.18, 95%CI: 3.70, 28.06, adjusted P<0.001) consistently exhibited a significantly higher risk of readmission of follow-up (Fig. 4A, Table S11). We also conducted receiver operation characteristics analysis to assess the risk of readmission within one years and two years of follow-up, the clustering grading (1=NHB, 2=BI, 3=MS, 4=NB, 5=FH) demonstrated a significant predictive capability (area under curve [95%CI]: 0.757 [0.716, 0.799] at 1 year; 0.764 [0.726, 0.802] at 2 years, both P<0.001, Fig. S3).
. Panel B: Sankey plot illustrating the changes in the cluster membership over time during longitudinal follow-up (Training and validation set). The left side of the diagram represents the former cluster of patients with clusters labeled as CBA-BI (bacterial infection), CBA-FH (frequent hospitalizations), CBA-MS (moderate to severe bronchiectasis), CBA-NB (non-bacterial), and CBA-NHB (no hospitalizations or bacterial infection). The right side represents the re-evaluated clustering as per the rules of the decision-tree analysis, with the addition of ‘new’ to the original cluster labels—CBA-BI-new, CBA-FH-new, CBA-MS-new, CBA-NB-new, and CBA-NHB-new—the reassessment and potential shift in each patient")
Longitudinal risk assessment and cluster membership dynamics of CBA. Panel A: Cox proportional hazards regression analysis demonstrating the risk for readmission over a longitudinal follow-up of 2.5–6 years, using CBA-NHB as the reference cluster, with adjustments for the gender, age, BMI and CCI (Training set). Panel B: Sankey plot illustrating the changes in the cluster membership over time during longitudinal follow-up (Training and validation set). The left side of the diagram represents the former cluster of patients with clusters labeled as CBA-BI (bacterial infection), CBA-FH (frequent hospitalizations), CBA-MS (moderate to severe bronchiectasis), CBA-NB (non-bacterial), and CBA-NHB (no hospitalizations or bacterial infection). The right side represents the re-evaluated clustering as per the rules of the decision-tree analysis, with the addition of ‘new’ to the original cluster labels—CBA-BI-new, CBA-FH-new, CBA-MS-new, CBA-NB-new, and CBA-NHB-new—the reassessment and potential shift in each patient's cluster membership. BMI, body mass index; CCI, Charlson Comorbidity Index; CI, confidence interval; HR adj, hazard ratio after adjusting for gender, age, BMI and CCI.
We identified 170 patients with CBA who had repeated hospitalization records within our study site (mean interval: 623.0 days). Overall, the clinical characteristics remained stable – no significant differences in blood routine test items, lung function metrics, bacterial culture findings, blood inflammatory markers, use of corticosteroids, and hospitalization outcomes (including invasive ventilation, length of stay, re-admission within 1 year, etc.). (all P>0.05, Table S12).
The decision-tree model for patients with re-admissions revealed that 31.8% of patients changed their cluster membership. Using the former hospitalization as the control event, Logistic regression analysis did not identify any significant differences in the risk of re-admissions between the former and the subsequent hospitalization. However, the Sankey diagram showed certain cluster membership changes which centered on CBA-FH, CBA-BI and CBA-NB (Fig. 4B). Regression analysis on these clusters revealed that CBA-FH exhibited a significant increase in the risk of hospitalization among patients whose cluster membership remained unchanged (HR: 10.57, 95%CI: 2.94, 38.09, P<0.001) (Table S13).
DiscussionBased on the hospital EMRs (span: 2.5–6.0 years), we have compared the clinical characteristics of a reasonably large cohort of hospitalized patients with CBA, and bronchiectasis and COPD alone. Apart from the greater symptom burden and poorer clinical outcomes of CBA, we have identified five phenotypes of CBA (mostly based on bronchiectasis severity, hospitalization in the past year and sputum culture findings) which differed in clinical manifestations and outcomes.
Our findings pertaining to the proportion of patients with CBA – 14.5% of COPD patients and 29.9% of bronchiectasis patients – mirrored the published reports.3 Compared with bronchiectasis alone, our study indicated a significantly greater disease severity (greater symptom burden, prior exacerbation frequency, lung function impairment and detection of P. aeruginosa) and poorer outcomes (more frequent use of ventilators and higher rate of ICU admission) of CBA, which echoed previous studies.6,17–21 This might be partly interpreted by the greater magnitude of systemic (heightened neutrophilic inflammation) and airway inflammation (increased levels of C-reactive protein) in CBA. Hence, the clinical management of CBA may benefit more intensive treatment to reduce the disease burden and improve clinical outcomes.
Having unraveled the unique features of CBA compared with bronchiectasis or COPD alone, we next sought to decipher the heterogeneity of CBA. We phenotyped CBA with unsupervised clustering analysis of core metrics that best defined the clinical characteristics. The importance ranking of indicators was based on their predictive capacity for disease severity and therapeutic response.22–25 Congruent with previous findings, the radiologic severity of bronchiectasis was a crucial indicator for predicting the disease severity and therapeutic intensity.23,26,27 The history of hospitalizations was a proxy for the frequency of bronchiectasis or COPD exacerbations, an important factor for assessing future exacerbation risks.18,28–30 Sputum culture might indicate current airway infections and partially correlate with recent antibiotic treatment.28,31,32 Here, we also evaluated the diagnostic efficacy of CBA phenotypes in predicting hospital readmission risks at longitudinal follow-up.11 The CBA-FH cluster demonstrated a readmission risk that was nearly four-fold higher (390% increase) relative to the CBA-BI cluster. The CBA-MS and CBA-NB clusters also exhibited elevated risks (48% and 88% increase, respectively). These pronounced discrepancies provided crucial evidence for dissecting the heterogeneity of CBA and the identification of its distinct phenotypes. The algorithms for phenotyping CBA have underscored the importance of rapidly identifying different CBA phenotypes. For instance, both CBA-MS and CBA-FH might benefit from more intensified management strategies (including medication therapy, pulmonary rehabilitation training, intensified follow-up assessment, etc.). In light of the greatest disease burden, CBA-MS would warrant intensified airway clearance and bronchodilator therapy and other therapeutic measures to reduce the risk of future exacerbations. Conversely, patients with CBA-BI might require targeted antibiotic therapy for specific bacteria and management of the co-existing conditions. In clinical practice, our proposed clustering scheme aids in formulating more effective treatment plans for CBA. To illustrate these findings more intuitively, we have comprehensively presented the key characteristics of each phenotype in Fig. 3. This figure visualization provides the rationale for clarifying the heterogeneity of CBA so that clinicians could identify any treatable trait to improve the decision making and treatment planning within the previously neglected subgroups of patients.
Some limitations should also be considered. First, we only included hospitalized patients from a single tertiary medical center, nor did we validate findings with an independent out-patient cohort because it differed considerably in clinical characteristics (significantly more severe bronchiectasis in inpatient cohort vs. COPD as the primary diagnosis in outpatient cohort). This may limit the generalizability of our findings across the broader clinical settings, underscoring the need for cautious interpretation when applying our results to different patient populations. Second, we did not dissect asthma from our study population because the primary diagnoses of COPD and bronchiectasis were made based on both discharge physician diagnosis and verification of other compelling records, contingent on the clinical conditions fully satisfying the guideline-defined diagnostic criteria. Third, because some key indicators were missing in <15% of patients, we conducted multiple imputation for estimating the missing values. However, there were no significant differences in demographic characteristics and other important metrics associated with disease severity between patients excluded from and included in the final analysis. Fourth, we did not integrate the grading of mucus plugging because of the lack of a standardized quantitative imaging system, which will be explored in future studies. Finally, because of the nature of retrospective in-hospital EMR review, the use of medications (esp. corticosteroids, antibiotics) could both reflect physician's adherence to guidelines and the practical needs of individual patients.
ConclusionsWe have demonstrated that bronchiectasis severity, hospitalizations and sputum culture are core indicators of clustering membership of CBA. These revealed some clusters with significantly greater symptom burden and poorer clinical outcomes, hence justifying personalized management of CBA among the targeted patient subpopulations.
Author's contributionsC.X.P., J.Q.Y. and W.J.G. drafted the manuscript; C.X.P., Z.F.H., Z.M.C. and W.J.G. contributed to conception and design; C.X.P., Z.F.H., S.Z.L., J.Q.Y. and Z.M.C. were responsible for patient recruitment and data collection; C.X.P. and S.Z.L. performed data analysis; W.J.G. critically revised the manuscript. All authors have approved the final submission.
Ethical approvalThe study was approved by the Institutional Review Board of The First Affiliated Hospital of Guangzhou Medical University (ES-2023-K008-03), and additional informed consent was waived for the retrospective cohort.
Data availability statementData will be available from corresponding authors through reasonable requirement.
FundingThis study was funded by the National Natural Science Foundation – Outstanding Youth Foundation (No. 82222001), R&D Program of Guangzhou National Laboratory (GZNL2024A02003), Guangdong Natural Science Foundation (No. 2019A1515011634), and the Zhongnanshan Medical Foundation of Guangdong Province (No. ZNSA-2020013), Guangzhou Science and Technology Plans (No. 2023B03J0407 and 202102010372), Plan on Enhancing Scientific Research in Guangzhou Medical University (grant number not applicable) (to Prof. Guan).
Conflict of interestNone declared.
We thank Mei Jiang (The First Affiliated Hospital of Guangzhou Medical University) for her guidance on statistical methods used in this article. We also thank Wen-hua Jian and Yi-jun Chen (department of big data center, National Clinical Research Center for Respiratory Disease, The First Affiliated Hospital of Guangzhou Medical University) for their help with electronic medical record data extraction. Fig. 3 was created with BioRender.com (Agreement number: PP2673TD0X).


