


Pulmonary involvement in COVID-19 is frequently associated with alterations in oxygenation. The arterial partial pressure of oxygen (PaO2) is the most clinically used variable to assess such oxygenation, since it decisively influences the oxygen transported by hemoglobin (expressed by its percentage of saturation, SaO2). However, two recent studies conducted respectively in silico and using omic techniques in red blood cells of COVID-19 patients have suggested that SARS-CoV-2 could decrease the affinity of oxygen for the hemoglobin (which would imply that PaO2 would overestimate SaO2), and also reduce the amount of this carrier molecule.
ObjectiveTo evaluate this hypothesis in blood samples from COVID-19 patients.
MethodsBlood gases of all COVID-19 patients performed in our laboratory in two months were included, as well as those from two control groups: synchronous patients with negative PCR for SARS-CoV-2 (SCG) and a historical group (HCG). Both SaO2 and venous saturations (SvO2) measured by cooximetry (COX) were compared separately with those calculated using the Kelman (K), Severinghaus (SV) and Siggaard-Andersen (SA) equations in each group.
ResultsMeasured and calculated SaO2 and SvO2 were practically equivalent in all groups. Intraclass correlation coefficients (ICC) for SaO2 in COVID-19 were 0.993 for COX-K and 0.992 for both COX-SV and COX-SA; being 0.995 for SvO2 for either COX-K, COX-SV or COX-SA. Hemoglobin and ferritin were slightly higher in COVID-19 compared to SCG and HCG (hemoglobin, p < 0.001 for both; ferritin, p < 0.05 for SCG and p < 0.001 for HCG).
ConclusionUnder clinical conditions SARS-CoV-2 does not have an appreciable influence on the affinity of oxygen for the hemoglobin, nor on the levels of this carrier molecule. Therefore, PaO2 is a good marker of blood oxygenation also in COVID-19.
La afectación pulmonar por COVID-19 se asocia frecuentemente con alteraciones en la oxigenación. La presión parcial arterial de oxígeno (PaO2) es la variable más utilizada clínicamente para valorar dicha oxigenación, ya que influye decisivamente en el oxígeno transportado por la hemoglobina (expresado por porcentaje de saturación, SaO2). Sin embargo, dos estudios recientes realizados respectivamente in silico y mediante técnicas ómicas en hematíes de pacientes han sugerido que SARS-CoV-2 podría disminuir la afinidad del oxígeno por la hemoglobina (lo que implicaría que la PaO2 sobrevaloraría la SaO2 real), e incluso reduciría la cantidad de esta molécula transportadora.
ObjetivoEvaluar dicha hipótesis en muestras gasométricas de pacientes con COVID-19.
MétodosSe incluyeron las gasometrías de todos los pacientes con COVID-19 realizadas en nuestro laboratorio, así como las de dos grupos control: pacientes sincrónicos con PCR negativa (GCS) y grupo histórico (GCH). Se compararon por separado las SaO2 y saturaciones venosas (SvO2), medidas por cooximetría (COX) con las calculadas mediante las ecuaciones de Kelman (K), Severinghaus (SV) y Siggaard-Andersen (SA) en cada grupo.
ResultadosLas cifras de SaO2 y SvO2 medidas y calculadas fueron prácticamente superponibles en todos los grupos. Así, los coeficientes de correlación intraclase (CCI) en COVID-19 para SaO2 fueron 0,993 en COX-K y 0,992 en COX-SV y COX-SA; siendo 0,995 para SvO2 tanto en COX-K como en COX-SV y COX-SA. La hemoglobina y la ferritina resultaron algo superiores en el grupo COVID-19 respecto de GCS y GCH (hemoglobina, p < 0,001 en ambos; ferritina, p < 0,05 para GCS y p < 0,001 para GCH).
ConclusionesEn condiciones clínicas, el SARS-CoV-2 no influye de forma apreciable en la afinidad del oxígeno por la hemoglobina, ni tampoco en los niveles de esta última. Por tanto, la PaO2 es un buen marcador de oxigenación sanguínea también en COVID-19.
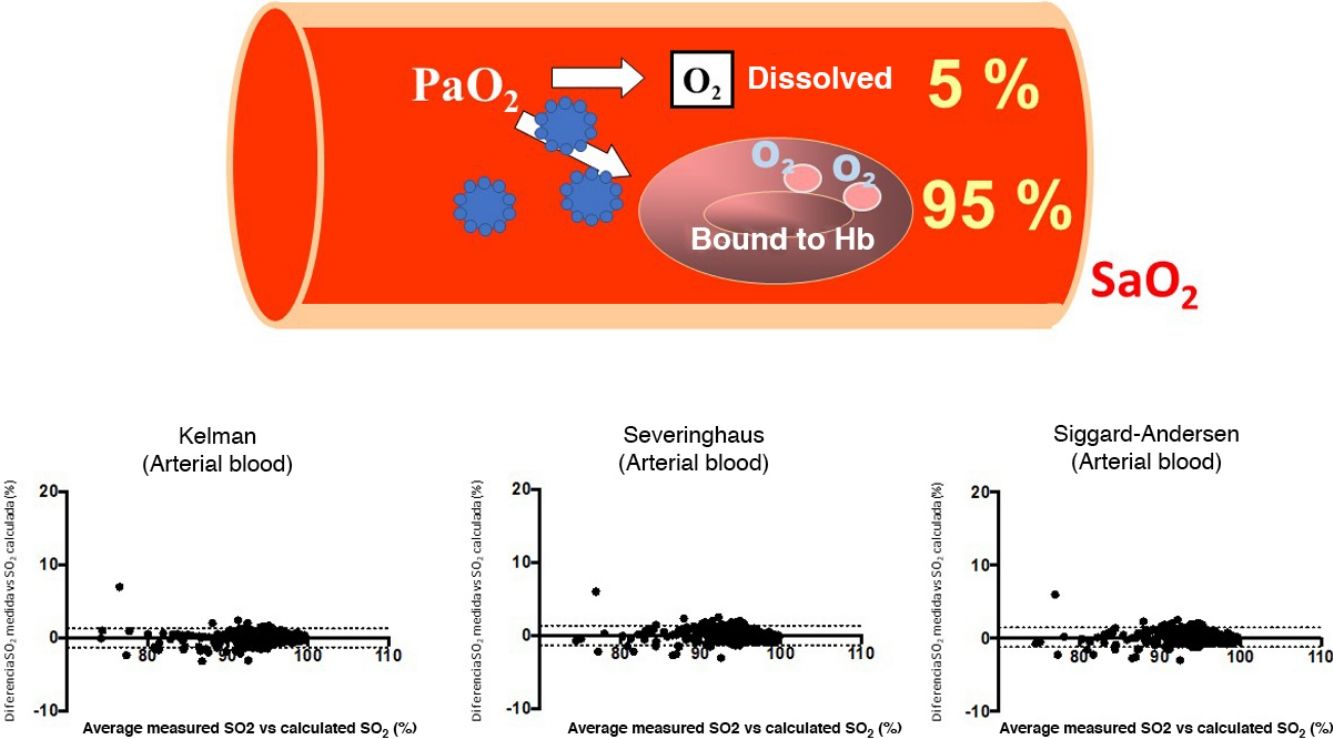
SARS-CoV-2, a virus that manifests clinically as a disease called Covid-19, is causing a serious worldwide pandemic1,2. Although this disease can affect various organs, the main target is the lung, where it can cause both pneumonia with reactive tissue inflammation and also vascular and blood disorders2,3. As a result, many cases present respiratory failure that can become very serious if it develops into acute respiratory distress syndrome (ARDS). The clinical management of these processes requires pulmonary gas exchange monitoring, determined preferably by arterial blood gas tests, although oximetry is often performed to reduce the invasiveness of the procedure. The variable most widely used to assess the severity of hypoxemia and the clinical course is partial oxygen pressure (PaO2) and its ratio to the concentration of gas delivered (fraction of inspired oxygen [FiO2]), a variable known as PaFi (PaO2/FiO2)4. PaO2 is important for determining the total oxygen content delivered to the tissues from arterial blood (CaO2), as it is an indicator of both the amount of gas bound to hemoglobin and the amount dissolved in plasma5. The first is far more important (95% of CaO2), and is expressed by percentage oxygen saturation (SaO2). However, a recent in silico study reported that some SARS-CoV-2 proteins (e.g., ORF8)6,7 might inhibit the binding of hemoglobin with oxygen and even destroy hemoglobin molecules6,7. An even more recent study, conducted on red blood cells from Covid-19 patients using proteomic and lipidomic determinations, also suggested that the affinity between oxygen and hemoglobin in these patients may be reduced8. The clinical consequences of these 2 studies could be significant, as they would limit the usefulness of PaO2 and PaFi in assessing the real oxygenation status of Covid-19 patients7. Since numerous validated equations can be used to calculate the oxygen saturation that corresponds to a particular partial oxygen pressure while taking into account the other main factors involved, the difference between the estimated oxygen saturation and the patient’s real saturation status will help determine whether the affinity of oxygen for the hemoglobin molecule is affected by the virus. The objective of this study was to analyze the concordance between measured SaO2 and SaO2 calculated from PaO2, in order to assess whether the infection actually does impact the affinity of oxygen for hemoglobin.
MethodThis study was performed by analyzing all arterial and venous blood gas samples obtained from Covid-19 patients (confirmation by polymerase chain reaction [PCR] in nasal or pharyngeal smears) received by our center’s central laboratory between March and April 2020. A total of 549 arterial blood samples were collected from 139 patients, and 544 venous blood samples were collected from 215 patients. Other blood gas determinations that were collected and processed in other healthcare facilities with slightly different instrument calibration and maintenance criteria were excluded. We also studied blood gas determinations from 2 control groups: the first comprising patients tested synchronously during the same period as the experimental group who presented febrile symptoms but radiology not suggestive of SARS-CoV-2 and PCR negative for this virus (251 arterial samples from 73 patients and 1069 venous samples from 379 patients), and the second comprising subjects admitted for non-parenchymal lung disease in the 2 months prior to the detection of the first cases of SARS-CoV-2 infection (2614 arterial samples from 1089 patients and 3098 venous samples from 1461 patients). We included arterial and venous samples because we were interested in analyzing oxygen affinity for hemoglobin over a wide range of arterial oxygen pressures. In line with the requirements of the institution’s clinical research ethics committee, patients initially gave verbal consent for the inclusion of their clinical and analytical data, an approach that was subsequently approved within the framework of a study on patients with severe Covid-19 (ref. 2020/9458).
TechniquesArterial and venous blood gas analysesArterial blood samples were obtained by puncture of the radial artery, following the recommended procedure of the Spanish Society of Pulmonology and Thoracic Surgery (SEPAR) for the collection and preservation of the sample9, while the venous blood samples were obtained by venipuncture, usually from the cubital vein, but also from the cephalic or the basilic veins.
The above-mentioned gases were analyzed using Rapidpoint 405 gas measurement systems (Siemens, Munich, Germany), equipped with cooximetry for the measurement of oxygen saturation, either in arterial (SaO2) or systemic venous blood (SvO2). Standard blood gas parameters were also obtained. Quality controls were calibrated as recommended by the suppliers, with 3 liquid calibration runs daily. Results of these variables in each of the groups were compared with results obtained using the equations of Kelman, Severinghaus, and Siggaard-Andersen10–12, which estimate values mainly from the measurement of PaO2, while taking into account deviations from the saturation curve. Blood hemoglobin was also available at the time of puncture, as it is provided by the same gas analyzer (normal values in our laboratory, 12.0–17.0 g/dL). General blood tests in Covid-19 patients also include ferritin in blood (normal values in our laboratory, 30–400 ng/mL) evaluated by sandwich electrochemiluminescent immunoassay (ECLIA)(Cobas 8000 e801 analyzer, Roche, Basel, Switzerland).
Statistical analysisAfter confirming the normality of distribution, the values of the variables were displayed as mean and standard deviation from the mean. The measured and calculated values of SaO2 and SvO2 for the same group were compared with 2-way random ANOVA, with intra-class correlation (ICC) to express consistency. The same approach was used for comparisons between the three groups. The relationship between variables was analyzed with Pearson's coefficient and linear regression. A concordance analysis was also performed using the Bland-Altman plot, based on the mean of the differences13. Since a plateau effect can occur in SaO2 at PaO2 levels over 100 mmHg, an additional post-hoc analysis was performed censoring these values. A p-value of <0.05 was considered significant in all tests.
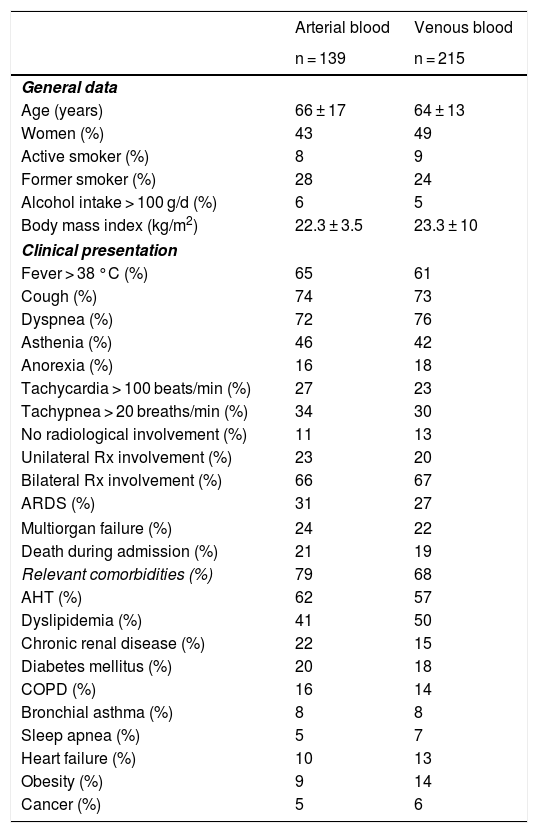
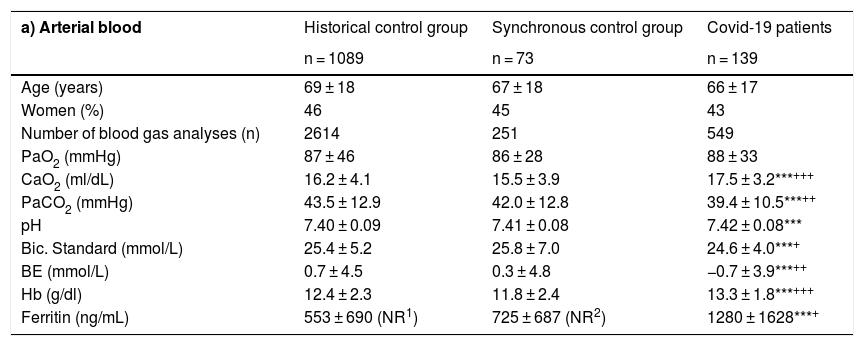
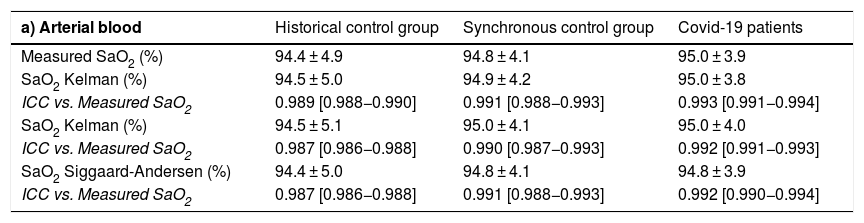
ResultsTable 1 shows the most relevant general and clinical characteristics of patients, while Table 2 shows mean arterial and venous blood gases for each of the 3 groups. In the Covid-19 group, SaO2 measured by cooximetry was almost identical to the results calculated using the different equations (Table 3). The results were similar in venous blood. The correlation between measured and calculated SaO2 and between measured and calculated SvO2 was also very high, with the regression line very close to the identity line (Fig. 1 of the manuscript and figure A(a) of the online supplement Fig. 1); these results were also corroborated by the consistency analysis, in which ICC values were always higher than 0.98 (Table 3). This is also shown in the Bland-Altman plot (Fig. 2). The patients showed mean partial pressure of carbon dioxide (PCO2) and pH within normal ranges in both arterial and venous blood. There were no relationships of interest between clinical variables and the differences between measured and calculated saturations.
General and clinical data of Covid-19 patients included in the study.
| Arterial blood | Venous blood | |
|---|---|---|
| n = 139 | n = 215 | |
| General data | ||
| Age (years) | 66 ± 17 | 64 ± 13 |
| Women (%) | 43 | 49 |
| Active smoker (%) | 8 | 9 |
| Former smoker (%) | 28 | 24 |
| Alcohol intake > 100 g/d (%) | 6 | 5 |
| Body mass index (kg/m2) | 22.3 ± 3.5 | 23.3 ± 10 |
| Clinical presentation | ||
| Fever > 38 °C (%) | 65 | 61 |
| Cough (%) | 74 | 73 |
| Dyspnea (%) | 72 | 76 |
| Asthenia (%) | 46 | 42 |
| Anorexia (%) | 16 | 18 |
| Tachycardia > 100 beats/min (%) | 27 | 23 |
| Tachypnea > 20 breaths/min (%) | 34 | 30 |
| No radiological involvement (%) | 11 | 13 |
| Unilateral Rx involvement (%) | 23 | 20 |
| Bilateral Rx involvement (%) | 66 | 67 |
| ARDS (%) | 31 | 27 |
| Multiorgan failure (%) | 24 | 22 |
| Death during admission (%) | 21 | 19 |
| Relevant comorbidities (%) | 79 | 68 |
| AHT (%) | 62 | 57 |
| Dyslipidemia (%) | 41 | 50 |
| Chronic renal disease (%) | 22 | 15 |
| Diabetes mellitus (%) | 20 | 18 |
| COPD (%) | 16 | 14 |
| Bronchial asthma (%) | 8 | 8 |
| Sleep apnea (%) | 5 | 7 |
| Heart failure (%) | 10 | 13 |
| Obesity (%) | 9 | 14 |
| Cancer (%) | 5 | 6 |
Rx: Plain radiology; ARDS: acute respiratory distress syndrome; AHT: arterial hypertension; COPD: chronic obstructive pulmonary disease.
Arterial and venous blood gases in the different patient groups.
| a) Arterial blood | Historical control group | Synchronous control group | Covid-19 patients |
|---|---|---|---|
| n = 1089 | n = 73 | n = 139 | |
| Age (years) | 69 ± 18 | 67 ± 18 | 66 ± 17 |
| Women (%) | 46 | 45 | 43 |
| Number of blood gas analyses (n) | 2614 | 251 | 549 |
| PaO2 (mmHg) | 87 ± 46 | 86 ± 28 | 88 ± 33 |
| CaO2 (ml/dL) | 16.2 ± 4.1 | 15.5 ± 3.9 | 17.5 ± 3.2***+++ |
| PaCO2 (mmHg) | 43.5 ± 12.9 | 42.0 ± 12.8 | 39.4 ± 10.5***++ |
| pH | 7.40 ± 0.09 | 7.41 ± 0.08 | 7.42 ± 0.08*** |
| Bic. Standard (mmol/L) | 25.4 ± 5.2 | 25.8 ± 7.0 | 24.6 ± 4.0***+ |
| BE (mmol/L) | 0.7 ± 4.5 | 0.3 ± 4.8 | −0.7 ± 3.9***++ |
| Hb (g/dl) | 12.4 ± 2.3 | 11.8 ± 2.4 | 13.3 ± 1.8***+++ |
| Ferritin (ng/mL) | 553 ± 690 (NR1) | 725 ± 687 (NR2) | 1280 ± 1628***+ |
| b) Venous blood | Historical control group | Synchronous control group | Covid-19 patients |
|---|---|---|---|
| n = 1461 | n = 379 | n = 215 | |
| Age (years) | 65 ± 23 | 64 ± 22 | 67 ± 18 |
| Sex (women, %) | 46 | 46 | 49 |
| Number of blood gas analyses (n) | 3098 | 1069 | 544 |
| PvO2 (mmHg) | 34 ± 9 | 34 ± 9 | 34 ± 9 |
| PvCO2 (mmHg) | 45.7 ± 10.0 | 45.8 ± 10.7 | 44.8 ± 9.2*+ |
| CvO2 (ml/dL) | 10.3 ± 5.4 | 9.8 ± 5.1 | 11.2 ± 5.2*++ |
| pH | 7.37 ± 0.07 | 7.36 ± 0.08 | 7.38 ± 0.06***+++ |
| Bic. Standard (mmol/L) | 24.0 ± 4.3 | 23.8 ± 5.2 | 24.4 ± 4.0*++ |
| BE (mmol/L) | 0.3 ± 4.0 | −0.2 ± 4.2 | 1.0 ± 4.1***+++ |
BE: base excess; Bic.: bicarbonate; CaO2: oxygen in arterial blood; COVID-19: coronavirus disease of 2019; CvO2: oxygen in venous blood; PaO2: partial pressure of oxygen in arterial blood; PaCO2: partial pressure of carbon dioxide in arterial blood; pH: potential of hydrogen; PvCO2: partial pressure of carbon dioxide in venous blood; PvO2: partial pressure of oxygen in venous blood.
Significance levels between historical control and Covid-19 patients:
* p ≤ 0.05; ** p ≤ 0.01; *** p ≤ 0.001.
Significance levels between synchronous controls and Covid-19 patients: + p ≤ 0.05; ++ p ≤ 0.01; +++ p ≤ 0.001.
Comparison between hemoglobin saturation measured by oximetry and calculated with the different prediction equations.
| a) Arterial blood | Historical control group | Synchronous control group | Covid-19 patients |
|---|---|---|---|
| Measured SaO2 (%) | 94.4 ± 4.9 | 94.8 ± 4.1 | 95.0 ± 3.9 |
| SaO2 Kelman (%) | 94.5 ± 5.0 | 94.9 ± 4.2 | 95.0 ± 3.8 |
| ICC vs. Measured SaO2 | 0.989 [0.988−0.990] | 0.991 [0.988−0.993] | 0.993 [0.991−0.994] |
| SaO2 Kelman (%) | 94.5 ± 5.1 | 95.0 ± 4.1 | 95.0 ± 4.0 |
| ICC vs. Measured SaO2 | 0.987 [0.986−0.988] | 0.990 [0.987−0.993] | 0.992 [0.991−0.993] |
| SaO2 Siggaard-Andersen (%) | 94.4 ± 5.0 | 94.8 ± 4.1 | 94.8 ± 3.9 |
| ICC vs. Measured SaO2 | 0.987 [0.986−0.988] | 0.991 [0.988−0.993] | 0.992 [0.990−0.994] |
| b) Venous blood | Historical control group | Synchronous control group | Covid-19 patients |
|---|---|---|---|
| Measured SaO2 (%) | 60.3 ± 17.9 | 60.1 ± 18.0 | 61.6 ± 18.8 |
| SaO2 Kelman (%) | 60.0 ± 17.4 | 59.5 ± 17.3 | 61.1 ± 18.2 |
| ICC vs. measured SaO2 | 0.991 [0.990−0.991] | 0.990 [0.988−0.991] | 0.995 [0.994−0.996] |
| SaO2 Severinghaus (%) | 60.1 ± 18.2 | 59.6 ± 18.1 | 61.4 ± 19.0 |
| ICC vs. measured SvO2 SvO2 | 0.990 [0.989−0.990] | 0.989 [0.987−0.990] | 0.995 [0.994−0.996] |
| Siggaard-Andersen (%) | 60.2 ± 18.2 | 59.6 ± 18.1 | 61.4 ± 19.0 |
| ICC vs. measured SaO2 | 0.990 [0.989−0.990] | 0.989 [0.987−0.990] | 0.995 [0.994−0.996] |
ICC: intraclass correlation coefficient; SaO2: oxygen saturation in arterial blood; SvO2: oxygen saturation in venous blood.
 Kelman, (b) Severinghaus, and (c) Siggaard-Andersen for arterial blood, and for venous blood (d), (e), and (f), respectively.")
, (b), and (c), and systemic venous blood (d), (e) and (f). The solid line represents the mean between the measured and calculated values. Dashed lines represent the mean ± 1.96 x standard deviation (95% confidence interval).")
Bland-Altman plots for the differences between measured saturation and saturation calculated by the three equations used in the study, for both arterial blood (a), (b), and (c), and systemic venous blood (d), (e) and (f). The solid line represents the mean between the measured and calculated values. Dashed lines represent the mean ± 1.96 x standard deviation (95% confidence interval).
The results did not differ substantially in either control group, nor did the synchronous group of patients with negative PCR for SARS-CoV-2 show differences between measured saturation and saturation calculated with the different equations in either arterial or venous blood. The same was true of the group of patients without infectious disease who had gas analysis performed in the months before the pandemic. In these 2 cases, correlations and ICC were also highly significant. Hemoglobin and ferritin were somewhat higher in the Covid-19 group compared with both control groups.
In the post-hoc analysis, which excluded measurements with PaO2 values greater than 100 mmHg, no differences were observed between measured SaO2 and SaO2 values calculated using any of the 3 equations and for any of the 3 study groups (Appendix B Tables A and B, and Figure A of the online supplement).
DiscussionThe main finding of this study is that active SARS-CoV-2 infection does not substantially change the PaO2:SaO2 relationship. This is of particular importance in the clinical management of patients with pulmonary involvement due to Covid-19. Furthermore, there was no impairment of oxygen affinity for hemoglobin in venous blood, nor was this molecule reduced by infection.
A recent in silico study suggested that various viral surface proteins (such as ORF8 and perhaps some other glycoprotein) might inhibit binding between the iron of the hemoglobin molecule and oxygen6,14, thus impeding the transport of oxygen to tissue, despite adequate PaO2 being maintained. This would also mean that PaO2 is only of relative use in the management of patients, since it does not reflect their real oxygenation status7,14. More recently, another group using omic techniques described protein and lipid alterations that affect the membrane of the red blood cell, a situation that could also reduce the affinity of oxygen for hemoglobin at a certain partial pressure of oxygen8. Under normal circumstances, this pressure helps predict hemoglobin saturation with acceptable accuracy, since both variables maintain a known relationship, similar to an italic S. At high or very low oxygen pressures, saturation changes secondary to PaO2 modifications are relatively small; however, when the oxygen pressure falls below 60 mmHg, saturation declines dramatically5,15. Of course, certain factors can modify the relationship between both variables, shifting the curve to the left or right. The most important of these are temperature, PaCO2, pH and concentration of 2–3-diphosphoglycerate5, as well as the presence of abnormal hemoglobins, as would be the case in SARS-CoV-2 infection. In clinical circumstances, these shifts are not usually taken into account, but they are used to calculate saturation when it cannot be determined directly. This is no longer common because most current gas analyzers include cooximetry. However, as this technique was not widely available until relatively recently, various equations for predicting saturation were developed; of these, Kelman, Severinghaus, and Siggaard-Andersen offer the best concordance with the measured saturation10–12,16. In our study, these equations predicted the saturation that would correspond to a certain oxygen pressure, taking into account the other factors mentioned, in both arterial and venous blood, in a large sample of patients and blood samples. Our results indicate that saturation calculated using any of the foregoing equations shows no clinically significant difference with saturation measured by cooximetry, strongly undermining in real-world practice the hypothesis that SARS-CoV-2 infection significantly alters the affinity of oxygen for hemoglobin. Very recently, a British group also suggested that this hypothesis could be misleading after a small pilot study of 14 arterial blood gas samples from patients with Covid-1917. Although they used a different methodology based on the calculation of P50, their results are consistent with ours. However, the real situation regarding oxygen affinity for hemoglobin in these patients is still under discussion18,19. Our results also remind us of the enormous gap between in silico or in vitro estimates and real-world practice.
The above-mentioned in silico study suggested that other viral proteins, such as orf1ab, ORF3a and ORF10, might denature the structure of the hemoglobin molecule, releasing iron and transforming the preexisting hemo groups to simple porphyrins that lack the capacity to carry oxygen6. This would affect CaO2 levels, which depend predominantly on hemoglobin-bound oxygen, decreasing supply to the tissues5. Our results do not support this hypothesis, since we found that blood hemoglobin values in patients with Covid-19 were even slightly higher than those of the control groups. However, some studies have reported lower hemoglobin levels in these patients20–22. In general, these studies have not included control groups of patients with severe disease, in whom blood collection and reduced hemoglobin are very common. However, like us, other authors have reported increases in serum ferritin in patients with Covid-1923, possibly related to this molecule’s role in buffering iron released by hemoglobin22. Iron is essential for viral replication, and this might explain why several viruses can interfere in iron homeostasis24. However, it is not yet known whether this could also be the case with SARS-CoV-2. Macrophages also play an important role in the regulation of iron homeostasis, as they prevent the release of hemoglobin molecules by red blood cells25. However, an excess of hemo groups can also help activate the innate immune system, triggering proinflammatory macrophage orientation26,27, which appears to be a key trigger of the Covid-19 cytokine storm28.
Study limitationsWe should point out that some patients in our SARS-CoV-2 PCR-negative control group may have had Covid-19, since the sensitivity of this test is not 100%, and some may have been in a low viral replication phase. For this reason, we added a second control group of patients who were hospitalized before Covid-19 cases were detected in our setting.
Furthermore, some samples reported as arterial blood may in reality have been venous samples, although this possibility was minimized as far as possible. However, in these cases the similarity between measured and calculated saturation would also support the study premise, despite the minimum distortion of the overall values of samples classified as arterial or venous. There is also some degree of uncertainty regarding the actual shift in the hemoglobin saturation curve, since some minor factors influencing this shift were unavailable. Nevertheless, all the most relevant components were included in the equations.
It is important to note that hemoglobin levels in patients in our Covid-19 group were slightly higher than in the other 2 groups, unlike some results reported in the literature (mainly in patients with severe disease or comorbidities)1,21–23, and suggested in one of the two above mentioned articles that analyzed the mechanisms behind hemoglobin denaturation6. This also meant that a somewhat higher blood oxygen content was found in the Covid-19 group. We believe that hemoglobin levels were maintained in patients with Covid-19 because during the pandemic blood extractions were strictly limited, even for purely medical sampling. For studies, a single sample was obtained, which was stored in the Spanish National Biobank Network. In addition, our series includes patients with moderate levels of severity.
Finally, it would have been useful to have P50 determination (PaO2 corresponding to a SaO2 of 50%) as a complement to the equations for predicting SaO2, but the particularly dramatic circumstances of the Covid-19 pandemic did not allow such an approach. The equations used provide a sufficiently accurate estimate of the relationship between PaO2 and SaO2165.
In conclusion, our study is a reliable representation of real-world clinical practice, and shows that the SARS-CoV-2 virus does not appear to significantly affect the affinity of oxygen for the hemoglobin molecule or denature the hemo group. Therefore, the use of PaO2 to assess oxygenation status remains valid in Covid-19 patients
FundingFunded by an unrestricted grant from Boehringer-Ingelheim and the Catalan Foundation for Respiratory Medicine (FUCAP).
We thank all nurses and doctors who treated Covid-19 patients at the height of the pandemic, and who collaborated in this and many other studies.
The following is Supplementary data to this article:
Please cite this article as: Pascual-Guàrdia S, Ferrer A, Díaz Ó, Caguana AO, Tejedor E, Bellido-Calduch S, et al. Ausencia de efectos clínicos destacables del SARS-CoV-2 sobre la afinidad de la hemoglobina por el O2 en pacientes con COVID-19. Arch Bronconeumol. 2021;57:757–763.


