
Respiratory center (RC) dysfunction has been implicated in the pathogenesis of obesity-hypoventilation syndrome (OHS), and often requires treatment with home non-invasive ventilation (NIV). Our objective was to measure the effect of NIV on RC function in patients with OHS, and the factors that determine such an effect.
MethodsWe performed a prospective, repeated measures study to evaluate hypercapnia response (HR) by determining the p01/pEtCO2 ratio slope at baseline and after 6months of treatment with NIV in a group of OHS patients. A threshold of 0.22cmH2O/mmHg had previously been established in a control group, in order to differentiate optimal RC response from suboptimal RC response.
ResultsA total of 36 cases were included, 19 men (52%) aged 65 (SD 9) years, 63% of whom had p01/pEtCO2 below the reference value. Baseline p01/pEtCO2 was 0.17 (SD: 0.14)cmH2O/mmHg and, after 6 months of NIV, 0.30 (SD: 0.22)cm H2O/mmHg (P=0.011). After 6months of treatment with NIV, depressed RC function persisted in 12 cases (33%).
ConclusionIn total, 63% of OHS patients had RC dysfunction. The application of NIV improves RC function but not in all cases.
En la patogenia del síndrome de obesidad-hipoventilación (SOH) se ha postulado una disfunción del centro respiratorio, que muchas veces precisa la utilización de ventilación no invasiva (VNI) en domicilio para el tratamiento. Nuestro objetivo fue medir el efecto de la VNI en la función del CR en pacientes con SOH y los factores que lo determinan.
MétodosCon un diseño prospectivo de mediciones repetidas se estudió la respuesta a la hipercapnia (RHC) midiendo la pendiente de la relación p01/pEtCO2 en situación basal y tras 6meses de tratamiento con VNI en un grupo de pacientes con SOH. Previamente en un grupo control se estableció un umbral en 0,22cmH2O/mmHg para diferenciar la respuesta óptima (RO) de la respuesta subóptima (RSO) del CR.
ResultadosSe incluyeron 36 casos, 19 varones (52%), de 65 (DE: 9) años de edad; un 63% de ellos tenían un p01/pEtCO2 por debajo del valor de referencia. El valor basal de p01/pEtCO2 fue de 0,17 (DE: 0,14) cmH2O/mmHg y tras 6meses de VNI fue de 0,30 (DE: 0,22) cmH2O/mmHg (p=0,011). Tras 6meses de tratamiento con VNI, 12 casos (33%) mantienen una función deprimida de su CR.
ConclusiónUn 63% de los pacientes con SOH mostraron disfunción de su CR. La aplicación de VNI mejora la función del CR, aunque no en todos los casos.
Obesity-hypoventilation syndrome (OHS) is defined as the combination of obesity, daytime hypercapnia, and night-time ventilatory disorder not explained by other causes.1,2 It is a disease that is increasing in frequency in our setting, and home treatment with non-invasive ventilation (NIV) is often required. Indeed, OHS is currently one of the entities that most frequently requires the use of this type of treatment.3,4
The pathogenesis of OHS is multifactorial, and many mechanical and humoral factors are involved, along with changes in the control of breathing and the inability of the respiratory center (RC) to respond appropriately to increases in PaCO2.1,2,5,6 However, the role of each of these factors in the development of this entity has not been clarified.
The impulse generated by the RC is determined by measuring mouth pressure during the first 100ms of inspiration (p01). In normal subjects, p01 increases with the increase of paCO2, while in subjects with OHS, the p01 response is reduced.6
Data on the clinical usefulness of this test and the course of RC response in patients treated with NIV are still scant. Our hypothesis is that the study of the RC in patients with OHS will help detect dysfunction and measure the impact of NIV on RC function. Our objectives were to determine RC dysfunction in patients with OHS, to measure the effect of NIV on RC function, and to analyze possible determinant factors.
Materials and MethodsUsing a prospective, repeated measurements design, patients diagnosed with OHS between March 2014 and March 2016 were included consecutively. OSH was defined as an association of obesity with a body mass index of at least 30kg/m2 and daytime pCO2 greater than 45mmHg, excluding cases with other causes of alveolar hypoventilation. The following variables were obtained from each patient: age, sex, body mass index (BMI), FEV1 (percentage predicted), apnea/hypopnea index (AHI), percentage of the night with SpO2 <90% (T90), daytime PaO2, PaCO2 y HCO3, ventilatory pattern: tidal volume (VC), inspiratory time (Ti), total time of each cycle (Ttot) and Ti/Ttot ratio. All patients were treated with NIV in ST mode using S9 VPAP ST equipment (ResMed), adapted to achieve comfort and normalization of PCO2 and T90. NIV parameters (IPAP, EPAP, and respiratory rate) were collected, with the rate set at 2 breaths below the spontaneous respiratory rate measured during the adaptation period.
Patients receiving NIV were followed up at 6 months with determinations of arterial blood gases, night-time pulse oximetry (NPO) at home using NIV, and an analysis of the ventilator built-in software (BIS) focusing on treatment compliance (mean hours/day), residual AHI (events/hour), respiratory rate on NIV, percentage of spontaneous breaths, and air leaks (95th percentile in l/min). Patients who were non-compliant (less than 4h/day average use), required supplemental oxygen, had exacerbations in the previous month, and those who, after 6 months of NIV therapy, had a daytime PaCO2 greater than 46mmHg and/or a T90 greater than 30% were excluded.
The ventilatory pattern was determined by measuring p01, inspiratory time (Ti), total time (Ttot), Ti/Ttot ratio, and tidal volume (TV) using the Hyp’Air compact+Muscle Study device (Medisoft). RC was studied with Read's modification of the hypercapnic rebreathing response method,7 using Hyp’Air compact+Muscle Study, measuring the occlusion pressure in the first 100ms of the inspiration (p01), while the patient was breathing a high oxygen mixture of 7% CO2, with occlusions being performed up to a final pEtCO2 of 70mmHg. The results are shown as the slope of the least squares regression line resulting from p01/pEtCO2 in cmH2O/mmHg,
Ventilatory pattern and hypercapnic response were also studied in a group of 27 age-adjusted controls. The reference value for p01/pEtCO2 was taken as the 25th percentile of the value obtained, which was 0.22cm H2O/mmHg. Using this value as the cut-off point, patients were divided into 2 groups: an RC response was considered optimal (oR) when the result was at least 0.22cmH2O/mmHg, otherwise it was suboptimal (sR).
Quantitative variables are expressed as mean (SD) and qualitative as percentages. Comparisons between quantitative variables were established between the oR and sR groups and between the initial and final values by comparison of means for independent and paired data (Student's t); Chi-squared was used for qualitative variables. The study was approved by the Research Ethics Committee of our center, and informed consent was obtained in writing from all patients included in the study.
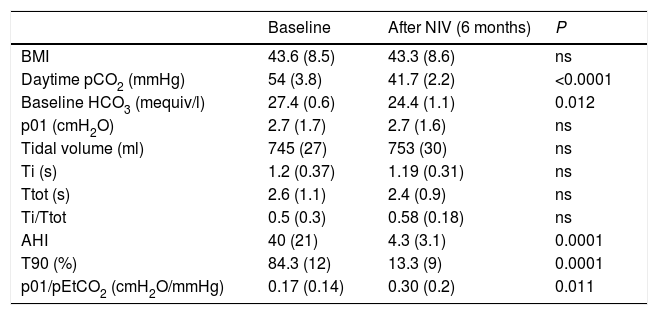
ResultsA total of 51 cases were evaluated, and 36 (70%) met the inclusion criteria, 19 men (52%), aged 65 (SD 9). Mean baseline p01/pEtCO2 was 0.17 (SD 0.14)cmH2O/mmHg and, after 6 months of NIV, 0.30 (SD 0.22)cmH2O/mmHg (P=0.011). At baseline, 23 patients (63%) had p01/pEtCO2 lower than the reference value: 0.11 (0.05)cmH2O/mmHg, and 13 above: 0.33 (0.12)cmH2O/mmHg (P=0.005). After treatment, 12 patients (33%) continued having suboptimal RC response. Table 1 shows the clinical and functional characteristics and therapeutic response of the complete series. Fig. 1 shows the course of the p01/pEtCO2 values in each case.
Baseline Values and After 6 Months of Treatment With NIV.
| Baseline | After NIV (6 months) | P | |
|---|---|---|---|
| BMI | 43.6 (8.5) | 43.3 (8.6) | ns |
| Daytime pCO2 (mmHg) | 54 (3.8) | 41.7 (2.2) | <0.0001 |
| Baseline HCO3 (mequiv/l) | 27.4 (0.6) | 24.4 (1.1) | 0.012 |
| p01 (cmH2O) | 2.7 (1.7) | 2.7 (1.6) | ns |
| Tidal volume (ml) | 745 (27) | 753 (30) | ns |
| Ti (s) | 1.2 (0.37) | 1.19 (0.31) | ns |
| Ttot (s) | 2.6 (1.1) | 2.4 (0.9) | ns |
| Ti/Ttot | 0.5 (0.3) | 0.58 (0.18) | ns |
| AHI | 40 (21) | 4.3 (3.1) | 0.0001 |
| T90 (%) | 84.3 (12) | 13.3 (9) | 0.0001 |
| p01/pEtCO2 (cmH2O/mmHg) | 0.17 (0.14) | 0.30 (0.2) | 0.011 |
AHI: apnea-hypopnea index; BMI, body mass index; T90: Night-time with SpO2 <90%; Ti: inspiratory time; Ttot: total time of cycle.
 Optimal response group with baseline p01/pEtCO2 >0.22cmH2O/mmHg. (B) Optimal response group with baseline p01/pEtCO2 <0.22cmH2O/mmHg. (C) Suboptimal response group.")
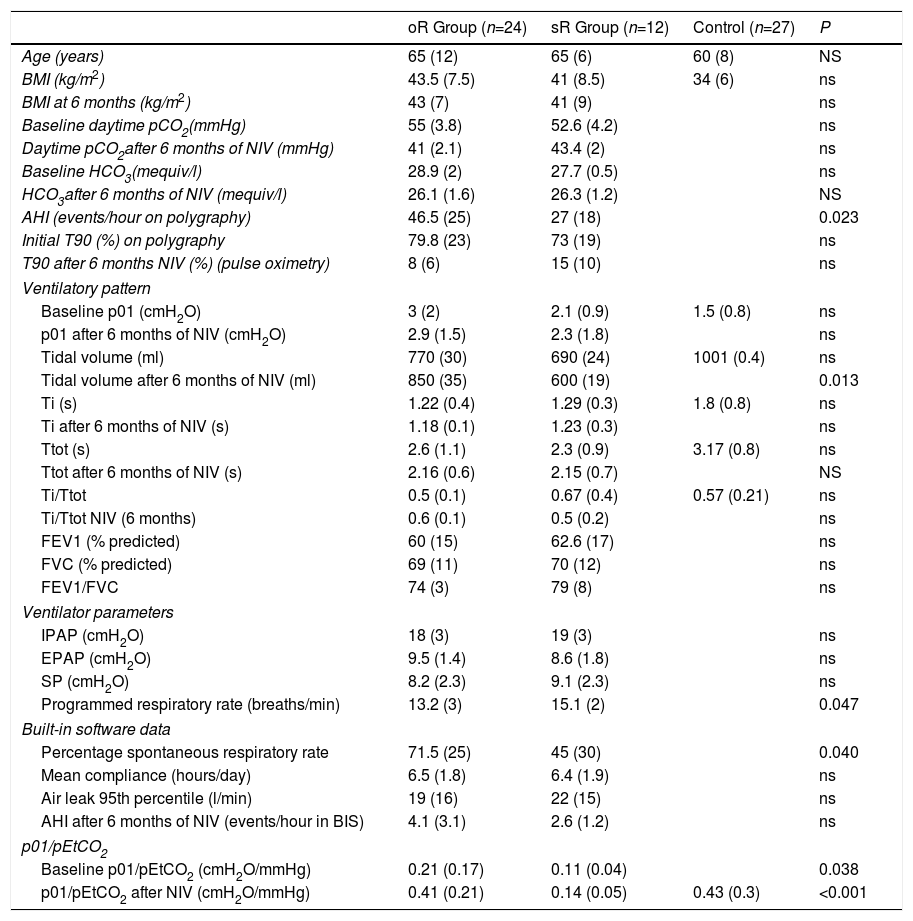
If we compare the oR group with the sR group, we observe differences in only p01/pEtCO2 and AHI, which are lower than in the sR group. After treatment, the oR group had a higher TV, lower programmed respiratory rate, and a significantly higher percentage of patient-initiated cycles. There were no significant differences in the ventilator parameters, hours of compliance, or air leak level (Table 2). None of the patients initially included in the oR group changed to the sR group in the second determination.
Comparisons of Ventilatory Pattern and p01/pEtCO2 Between oR, sR and Control Groups. Comparisons of ventilator parameters and BIS monitoring between oR and sR groups.
| oR Group (n=24) | sR Group (n=12) | Control (n=27) | P | |
|---|---|---|---|---|
| Age (years) | 65 (12) | 65 (6) | 60 (8) | NS |
| BMI (kg/m2) | 43.5 (7.5) | 41 (8.5) | 34 (6) | ns |
| BMI at 6 months (kg/m2) | 43 (7) | 41 (9) | ns | |
| Baseline daytime pCO2(mmHg) | 55 (3.8) | 52.6 (4.2) | ns | |
| Daytime pCO2after 6 months of NIV (mmHg) | 41 (2.1) | 43.4 (2) | ns | |
| Baseline HCO3(mequiv/l) | 28.9 (2) | 27.7 (0.5) | ns | |
| HCO3after 6 months of NIV (mequiv/l) | 26.1 (1.6) | 26.3 (1.2) | NS | |
| AHI (events/hour on polygraphy) | 46.5 (25) | 27 (18) | 0.023 | |
| Initial T90 (%) on polygraphy | 79.8 (23) | 73 (19) | ns | |
| T90 after 6 months NIV (%) (pulse oximetry) | 8 (6) | 15 (10) | ns | |
| Ventilatory pattern | ||||
| Baseline p01 (cmH2O) | 3 (2) | 2.1 (0.9) | 1.5 (0.8) | ns |
| p01 after 6 months of NIV (cmH2O) | 2.9 (1.5) | 2.3 (1.8) | ns | |
| Tidal volume (ml) | 770 (30) | 690 (24) | 1001 (0.4) | ns |
| Tidal volume after 6 months of NIV (ml) | 850 (35) | 600 (19) | 0.013 | |
| Ti (s) | 1.22 (0.4) | 1.29 (0.3) | 1.8 (0.8) | ns |
| Ti after 6 months of NIV (s) | 1.18 (0.1) | 1.23 (0.3) | ns | |
| Ttot (s) | 2.6 (1.1) | 2.3 (0.9) | 3.17 (0.8) | ns |
| Ttot after 6 months of NIV (s) | 2.16 (0.6) | 2.15 (0.7) | NS | |
| Ti/Ttot | 0.5 (0.1) | 0.67 (0.4) | 0.57 (0.21) | ns |
| Ti/Ttot NIV (6 months) | 0.6 (0.1) | 0.5 (0.2) | ns | |
| FEV1 (% predicted) | 60 (15) | 62.6 (17) | ns | |
| FVC (% predicted) | 69 (11) | 70 (12) | ns | |
| FEV1/FVC | 74 (3) | 79 (8) | ns | |
| Ventilator parameters | ||||
| IPAP (cmH2O) | 18 (3) | 19 (3) | ns | |
| EPAP (cmH2O) | 9.5 (1.4) | 8.6 (1.8) | ns | |
| SP (cmH2O) | 8.2 (2.3) | 9.1 (2.3) | ns | |
| Programmed respiratory rate (breaths/min) | 13.2 (3) | 15.1 (2) | 0.047 | |
| Built-in software data | ||||
| Percentage spontaneous respiratory rate | 71.5 (25) | 45 (30) | 0.040 | |
| Mean compliance (hours/day) | 6.5 (1.8) | 6.4 (1.9) | ns | |
| Air leak 95th percentile (l/min) | 19 (16) | 22 (15) | ns | |
| AHI after 6 months of NIV (events/hour in BIS) | 4.1 (3.1) | 2.6 (1.2) | ns | |
| p01/pEtCO2 | ||||
| Baseline p01/pEtCO2 (cmH2O/mmHg) | 0.21 (0.17) | 0.11 (0.04) | 0.038 | |
| p01/pEtCO2 after NIV (cmH2O/mmHg) | 0.41 (0.21) | 0.14 (0.05) | 0.43 (0.3) | <0.001 |
AHI: apnea-hypopnea index; BMI, body mass index; EPAP: expiratory positive airway pressure; IPAP: inspiratory positive airway pressure: oR: optimal response; SP: support pressure: sR: suboptional response; T90: Night-time with SpO2 <90%; Ti: inspiratory time; Ttot: total time of cycle.
In our series of OHS patients, we detected RC dysfunction compared to healthy individuals in 63% of cases. Treatment with NIV improved daytime pCO2 and night-time oxygenation, and RC hypercapnic response. The most significant finding of our study is the identification of 3 different types of OHS patients, depending on their RC function. One group had RC function close to the reference value; another had significantly diminished function, and 2 subgroups were identified in this second group, one that maintained some dysfunction despite effective NIV, and another whose RC function returned to normal. These findings have not been described previously.
Previous studies have described functional RC changes. Lin,8 using a methodology similar to ours, showed functional recovery from a p01/pEtCO2 of 0.005–0.30cmH2O/KPa in 6 patients with SAHS and hypercapnia on treatment with CPAP. Han et al.6 studied 10 similar cases and found an improvement from 0.23 to 0.51cmH2O/mmHg after 6 weeks of CPAP. Both studies concluded that the treatment achieved complete recovery of RC activity. Elliot et al.9 studied 8 patients with COPD and respiratory failure-hypercapnia treated with NIV, and found an association between improved hypercapnia and improved RC function in some of them.
In our study, we included a larger series of patients with more severe disease and higher mean pCO2 and AHI values, and observed that even after 6-month follow-up periods, not all patients recovered RC, and that a subgroup of patients showed persistently low values of p01/pEtCO2 that could convert to a more permanent RC alteration.
From the therapeutic point of view, the ventilator parameters used in the oR group and the sR group differed only respect to respiratory rate: 2 breaths/min lower in the oR group. Data obtained from the BIS revealed no significant differences in compliance, in air leak figures, or in residual AHI: however, patients in the sR group tended to present ventilator-initiated cycles more often than the oR group. This might be due to their lower RC activity, that would make it easier for them to be “caught” by the rescue rate of the ventilator.
There were no significant differences in baseline characteristics between both groups in terms of their baseline ventilatory pattern, FEV1, PCO2, HCO3 or T90. Only AHI was much higher in the oR group, and this finding may indicate that patients with more severe SAHS have less hypoventilation and less RC dysfunction. This concept was suggested by Pierce and Brown,1 who divided OHS patients into 2 severity categories, depending on the presence of significant obstructive sleep apnea or not. NIV may have modified the ventilatory pattern to a certain extent, since even if no differences were seen in Ti, Tot or p01 after 6 months of treatment, the oR group showed a slightly lower PCO2 and a higher TV than the sR group
There is very little evidence in the literature on which to base a normal value for p01/pEtCO2. In a study performed in patients undergoing anesthesia, values of 0.17–0.62cmH2O/mmHg were established as normal limits.10 In our study, we measured the ventilatory pattern and hypercapnic response in a group of 27 controls, taking the 25th percentile of values obtained, i.e., 0.22cmH2O/mmHg, as the p01/pEtCO2 reference value. Although no data are available in the literature associating hypercapnic response with the sex or BMI of individuals, and our control group was not adjusted for these 2 variables, we would point out that in previous studies with a similar methodology, patients with RC dysfunction had p01/pEtCO2 figures of between 0.027 and 0.24cmH2O/mmHg, while in controls these figures were 0.15–0.42cmH2O/mmHg.6,10,11 Our results are similar to these, and the proposed threshold is very close to these figures, although our series has a substantially larger number of cases. As experience in this area is still limited, we believe that any threshold value should be regarded as a starting point that needs to be refined in future studies. Moreover, our analysis was focused on distinguishing patients with oR compared to sR. However, as can be seen in Fig. 1C, some patients in the sR group had some response to NIV, while others in the oR group showed no changes in p01/pEtCO2 (Fig. 1A), but this behavior was not analyzed in this study.
RC response was measured by using other parameters, such as respiratory rate and tidal volume, similarly to studies conducted by Read and other authors.7,11 However, these parameters may be influenced by respiratory tract resistance or changes in the respiratory muscles, suggesting that p01 provides more reliable information on RC activity.12,13 We would emphasize that 37% of our patients showed no significant RC dysfunction, which can be explained by considering the various pathogenic possibilities of this disease2; in this subgroup of cases, OHS is probably associated with factors other than RC function that we did not explore in this study. We would also point out that our results might provide data that would guide decision-making in the treatment of OHS patients (non-invasive ventilation vs nasal CPAP), providing for more individualized treatment.
Our study has some limitations: we did not calculate the required sample size, although this series is larger than any studied to date, and we did not include nocturnal capnography studies, which may have detected cases of suboptimal ventilatory treatment. This would explain the worse hypercapnic response in some patients, so the sR group may be slightly overestimated.
Finally, some important factors should be mentioned: we used a figure of 4h/day to distinguish compliant patients from non-compliers; this may be an arbitrary value, but it has been used by other authors as the reference value.14 We also detected the use of different psychoactive drugs in 30% of our series, and while this might affect RC function, we found no differences between baseline and final p01/pEtCO2 values between users and non-users.
In conclusion, a subgroup of OHS patients was identified that shows suppressed RC activity despite effective NIV. These are patients characterized as having moderate-mild SAHS, a pattern with low respiratory rate and tidal volume, and greater tendency to be “caught” by the ventilator rescue rate. The determination of RC function adds a new parameter to the evaluation of OHS patients. It might be useful for discriminating between various groups, and it may be another impetus for individualized treatment, and assist in decision-making during the follow-up of OHS patients receiving NIV, guiding treatment modifications or discontinuation.
Conflict of InterestsThe authors state that they have no conflict of interests.
Please cite this article as: Álvarez RF, Cuadrado GR, Alvarez IR, Valverde TH, Urrutia MI, Lopez MJV, et al. Respuesta a la hipercapnia en pacientes con síndrome obesidad-hipoventilación en tratamiento con ventilación no invasiva en domicilio. Arch Bronconeumol. 2018;54:455–459.


