

CURRENT SITUATION AND LONG-TERM CONSEQUENCES OF COVID-19 INFECTION
More infoRespiratory function impairment and radiological sequelae in surviving intensive care unit (ICU) patients with acute respiratory distress syndrome (ARDS) secondary to COVID-19 are well described in short-term follow-up.1 Typical respiratory function abnormalities are impairment of the total lung capacity (TLC) and carbon monoxide diffusing capacity (DLCO).2 The most frequent radiological findings are multiple ground glass opacities (GGOs) in early stages, progressing to fibrotic changes such as interlobular septal thickening and traction bronchiectasis.3 However, the literature on the evolution of pulmonary sequelae in these patients is scarce. Therefore, our objective was to describe and analyze the evolution of functional and radiological sequelae between the 3- and 6-month follow-ups after hospital discharge in critical COVID-19 survivors.
A prospective observational study was performed in all patients over 18 years of age who were admitted to the ICU of the Hospital Universitari Arnau de Vilanova and Hospital Universitari Santa Maria in Lleida (Spain) due to COVID-19 between March and June 2020. Clinical and laboratory characteristics were recorded at ICU admission, as was the length of stay and respiratory support. From 209 initial patients, 39 died and 32 were unreachable or denied to follow-up. Finally, follow-up at 3 and 6 months after hospital discharge was performed in 78 survivors, comprising clinical evaluation, chest computed tomography (CT), pulmonary function test and the 6-minute walking test (6MWT). All CT images were reviewed by a pulmonologist blinded to the clinical data and total severity score (TSS)4 was assessed to quantify the severity and extent of lung damage.
Descriptive statistics – median (interquartile range) for quantitative variables and absolute and relative frequencies for qualitative variables – were calculated. Changes between visits in lung function, 6MWT and CT scan parameters were evaluated using the paired t-test, McNemar's test or McNemar–Bowker test, as appropriate. Furthermore, we evaluated the effect of comorbidities and ICU procedures on DLCO, 6MWT distance and TSS at both follow-up. The change between visits was assessed by using linear models and was adjusted by baseline values. R statistical software version 4.0.1 (R Foundation for Statistical Computing) was used for all the analyses.
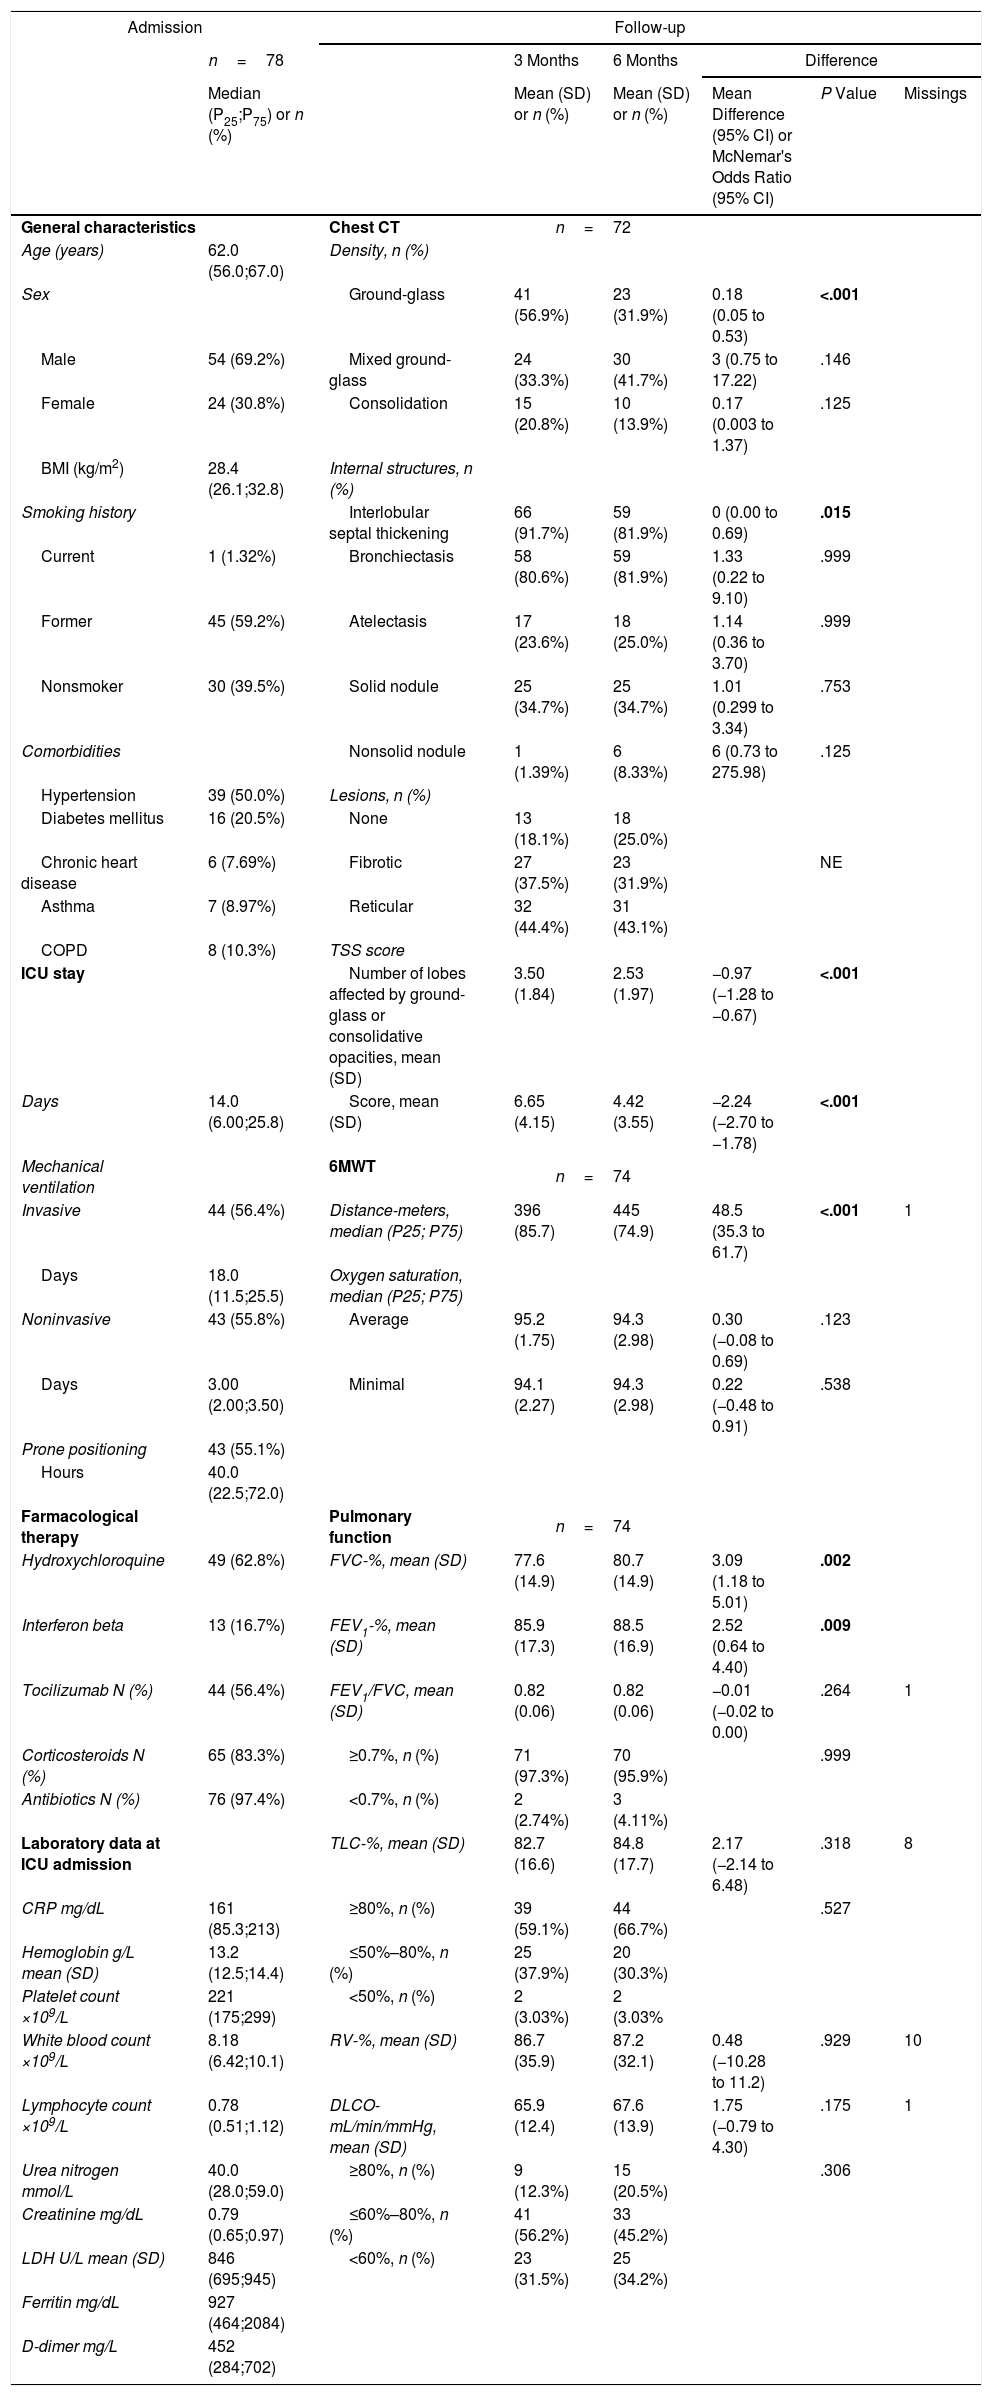
The general characteristics at ICU admission, in addition to functional and radiological findings during the follow-up, are shown in Table 1. The most frequent functional abnormalities observed were impairments in TLC (41% and 33%) and DLCO (88% and 80%). Significant improvements were seen only in FEV1, FVC and distance covered during the 6MWT. For chest CT, the most frequent findings were septal interlobular thickening, bronchiectasis and peripheral GGO. These chest CT lesions showed a significant decrease from the first to the second follow-up, as did the presence of ground-glass and interlobular septal thickening, the number of affected lobes and the severity of lung damage measured by TSS. However, 43.1% and 31.9% of patients still had reticular and fibrotic lesions, respectively, at the 6-month follow-up.
Baseline characteristics at ICU admission; functional and radiological findings at 3 and 6 months of follow-up after discharge and evolution from 3rd to 6th month.
| Admission | Follow-up | ||||||
|---|---|---|---|---|---|---|---|
| n=78 | 3 Months | 6 Months | Difference | ||||
| Median (P25;P75) or n (%) | Mean (SD) or n (%) | Mean (SD) or n (%) | Mean Difference (95% CI) or McNemar's Odds Ratio (95% CI) | P Value | Missings | ||
| General characteristics | Chest CT | n=72 | |||||
| Age (years) | 62.0 (56.0;67.0) | Density, n (%) | |||||
| Sex | Ground-glass | 41 (56.9%) | 23 (31.9%) | 0.18 (0.05 to 0.53) | <.001 | ||
| Male | 54 (69.2%) | Mixed ground-glass | 24 (33.3%) | 30 (41.7%) | 3 (0.75 to 17.22) | .146 | |
| Female | 24 (30.8%) | Consolidation | 15 (20.8%) | 10 (13.9%) | 0.17 (0.003 to 1.37) | .125 | |
| BMI (kg/m2) | 28.4 (26.1;32.8) | Internal structures, n (%) | |||||
| Smoking history | Interlobular septal thickening | 66 (91.7%) | 59 (81.9%) | 0 (0.00 to 0.69) | .015 | ||
| Current | 1 (1.32%) | Bronchiectasis | 58 (80.6%) | 59 (81.9%) | 1.33 (0.22 to 9.10) | .999 | |
| Former | 45 (59.2%) | Atelectasis | 17 (23.6%) | 18 (25.0%) | 1.14 (0.36 to 3.70) | .999 | |
| Nonsmoker | 30 (39.5%) | Solid nodule | 25 (34.7%) | 25 (34.7%) | 1.01 (0.299 to 3.34) | .753 | |
| Comorbidities | Nonsolid nodule | 1 (1.39%) | 6 (8.33%) | 6 (0.73 to 275.98) | .125 | ||
| Hypertension | 39 (50.0%) | Lesions, n (%) | |||||
| Diabetes mellitus | 16 (20.5%) | None | 13 (18.1%) | 18 (25.0%) | |||
| Chronic heart disease | 6 (7.69%) | Fibrotic | 27 (37.5%) | 23 (31.9%) | NE | ||
| Asthma | 7 (8.97%) | Reticular | 32 (44.4%) | 31 (43.1%) | |||
| COPD | 8 (10.3%) | TSS score | |||||
| ICU stay | Number of lobes affected by ground-glass or consolidative opacities, mean (SD) | 3.50 (1.84) | 2.53 (1.97) | −0.97 (−1.28 to −0.67) | <.001 | ||
| Days | 14.0 (6.00;25.8) | Score, mean (SD) | 6.65 (4.15) | 4.42 (3.55) | −2.24 (−2.70 to −1.78) | <.001 | |
| Mechanical ventilation | 6MWT | n=74 | |||||
| Invasive | 44 (56.4%) | Distance-meters, median (P25; P75) | 396 (85.7) | 445 (74.9) | 48.5 (35.3 to 61.7) | <.001 | 1 |
| Days | 18.0 (11.5;25.5) | Oxygen saturation, median (P25; P75) | |||||
| Noninvasive | 43 (55.8%) | Average | 95.2 (1.75) | 94.3 (2.98) | 0.30 (−0.08 to 0.69) | .123 | |
| Days | 3.00 (2.00;3.50) | Minimal | 94.1 (2.27) | 94.3 (2.98) | 0.22 (−0.48 to 0.91) | .538 | |
| Prone positioning | 43 (55.1%) | ||||||
| Hours | 40.0 (22.5;72.0) | ||||||
| Farmacological therapy | Pulmonary function | n=74 | |||||
| Hydroxychloroquine | 49 (62.8%) | FVC-%, mean (SD) | 77.6 (14.9) | 80.7 (14.9) | 3.09 (1.18 to 5.01) | .002 | |
| Interferon beta | 13 (16.7%) | FEV1-%, mean (SD) | 85.9 (17.3) | 88.5 (16.9) | 2.52 (0.64 to 4.40) | .009 | |
| Tocilizumab N (%) | 44 (56.4%) | FEV1/FVC, mean (SD) | 0.82 (0.06) | 0.82 (0.06) | −0.01 (−0.02 to 0.00) | .264 | 1 |
| Corticosteroids N (%) | 65 (83.3%) | ≥0.7%, n (%) | 71 (97.3%) | 70 (95.9%) | .999 | ||
| Antibiotics N (%) | 76 (97.4%) | <0.7%, n (%) | 2 (2.74%) | 3 (4.11%) | |||
| Laboratory data at ICU admission | TLC-%, mean (SD) | 82.7 (16.6) | 84.8 (17.7) | 2.17 (−2.14 to 6.48) | .318 | 8 | |
| CRP mg/dL | 161 (85.3;213) | ≥80%, n (%) | 39 (59.1%) | 44 (66.7%) | .527 | ||
| Hemoglobin g/L mean (SD) | 13.2 (12.5;14.4) | ≤50%–80%, n (%) | 25 (37.9%) | 20 (30.3%) | |||
| Platelet count ×109/L | 221 (175;299) | <50%, n (%) | 2 (3.03%) | 2 (3.03% | |||
| White blood count ×109/L | 8.18 (6.42;10.1) | RV-%, mean (SD) | 86.7 (35.9) | 87.2 (32.1) | 0.48 (−10.28 to 11.2) | .929 | 10 |
| Lymphocyte count ×109/L | 0.78 (0.51;1.12) | DLCO-mL/min/mmHg, mean (SD) | 65.9 (12.4) | 67.6 (13.9) | 1.75 (−0.79 to 4.30) | .175 | 1 |
| Urea nitrogen mmol/L | 40.0 (28.0;59.0) | ≥80%, n (%) | 9 (12.3%) | 15 (20.5%) | .306 | ||
| Creatinine mg/dL | 0.79 (0.65;0.97) | ≤60%–80%, n (%) | 41 (56.2%) | 33 (45.2%) | |||
| LDH U/L mean (SD) | 846 (695;945) | <60%, n (%) | 23 (31.5%) | 25 (34.2%) | |||
| Ferritin mg/dL | 927 (464;2084) | ||||||
| D-dimer mg/L | 452 (284;702) | ||||||
SD, standard deviation; CI, confidence interval; BMI, body mass index; COPD, chronic obstructive pulmonary disease; ICU, intensive care unit; CRP, C-reactive protein; LDH, lactate dehydrogenase; CT, computed tomography; TSS, total severity score; 6MWT, 6minutes walking test; FVC, forced vital capacity; FEV1, forced expiratory volume during the first second of the forced breath; TLC, total lung capacity; RV, residual volume.
Statistically significant values are highlighted in bold.
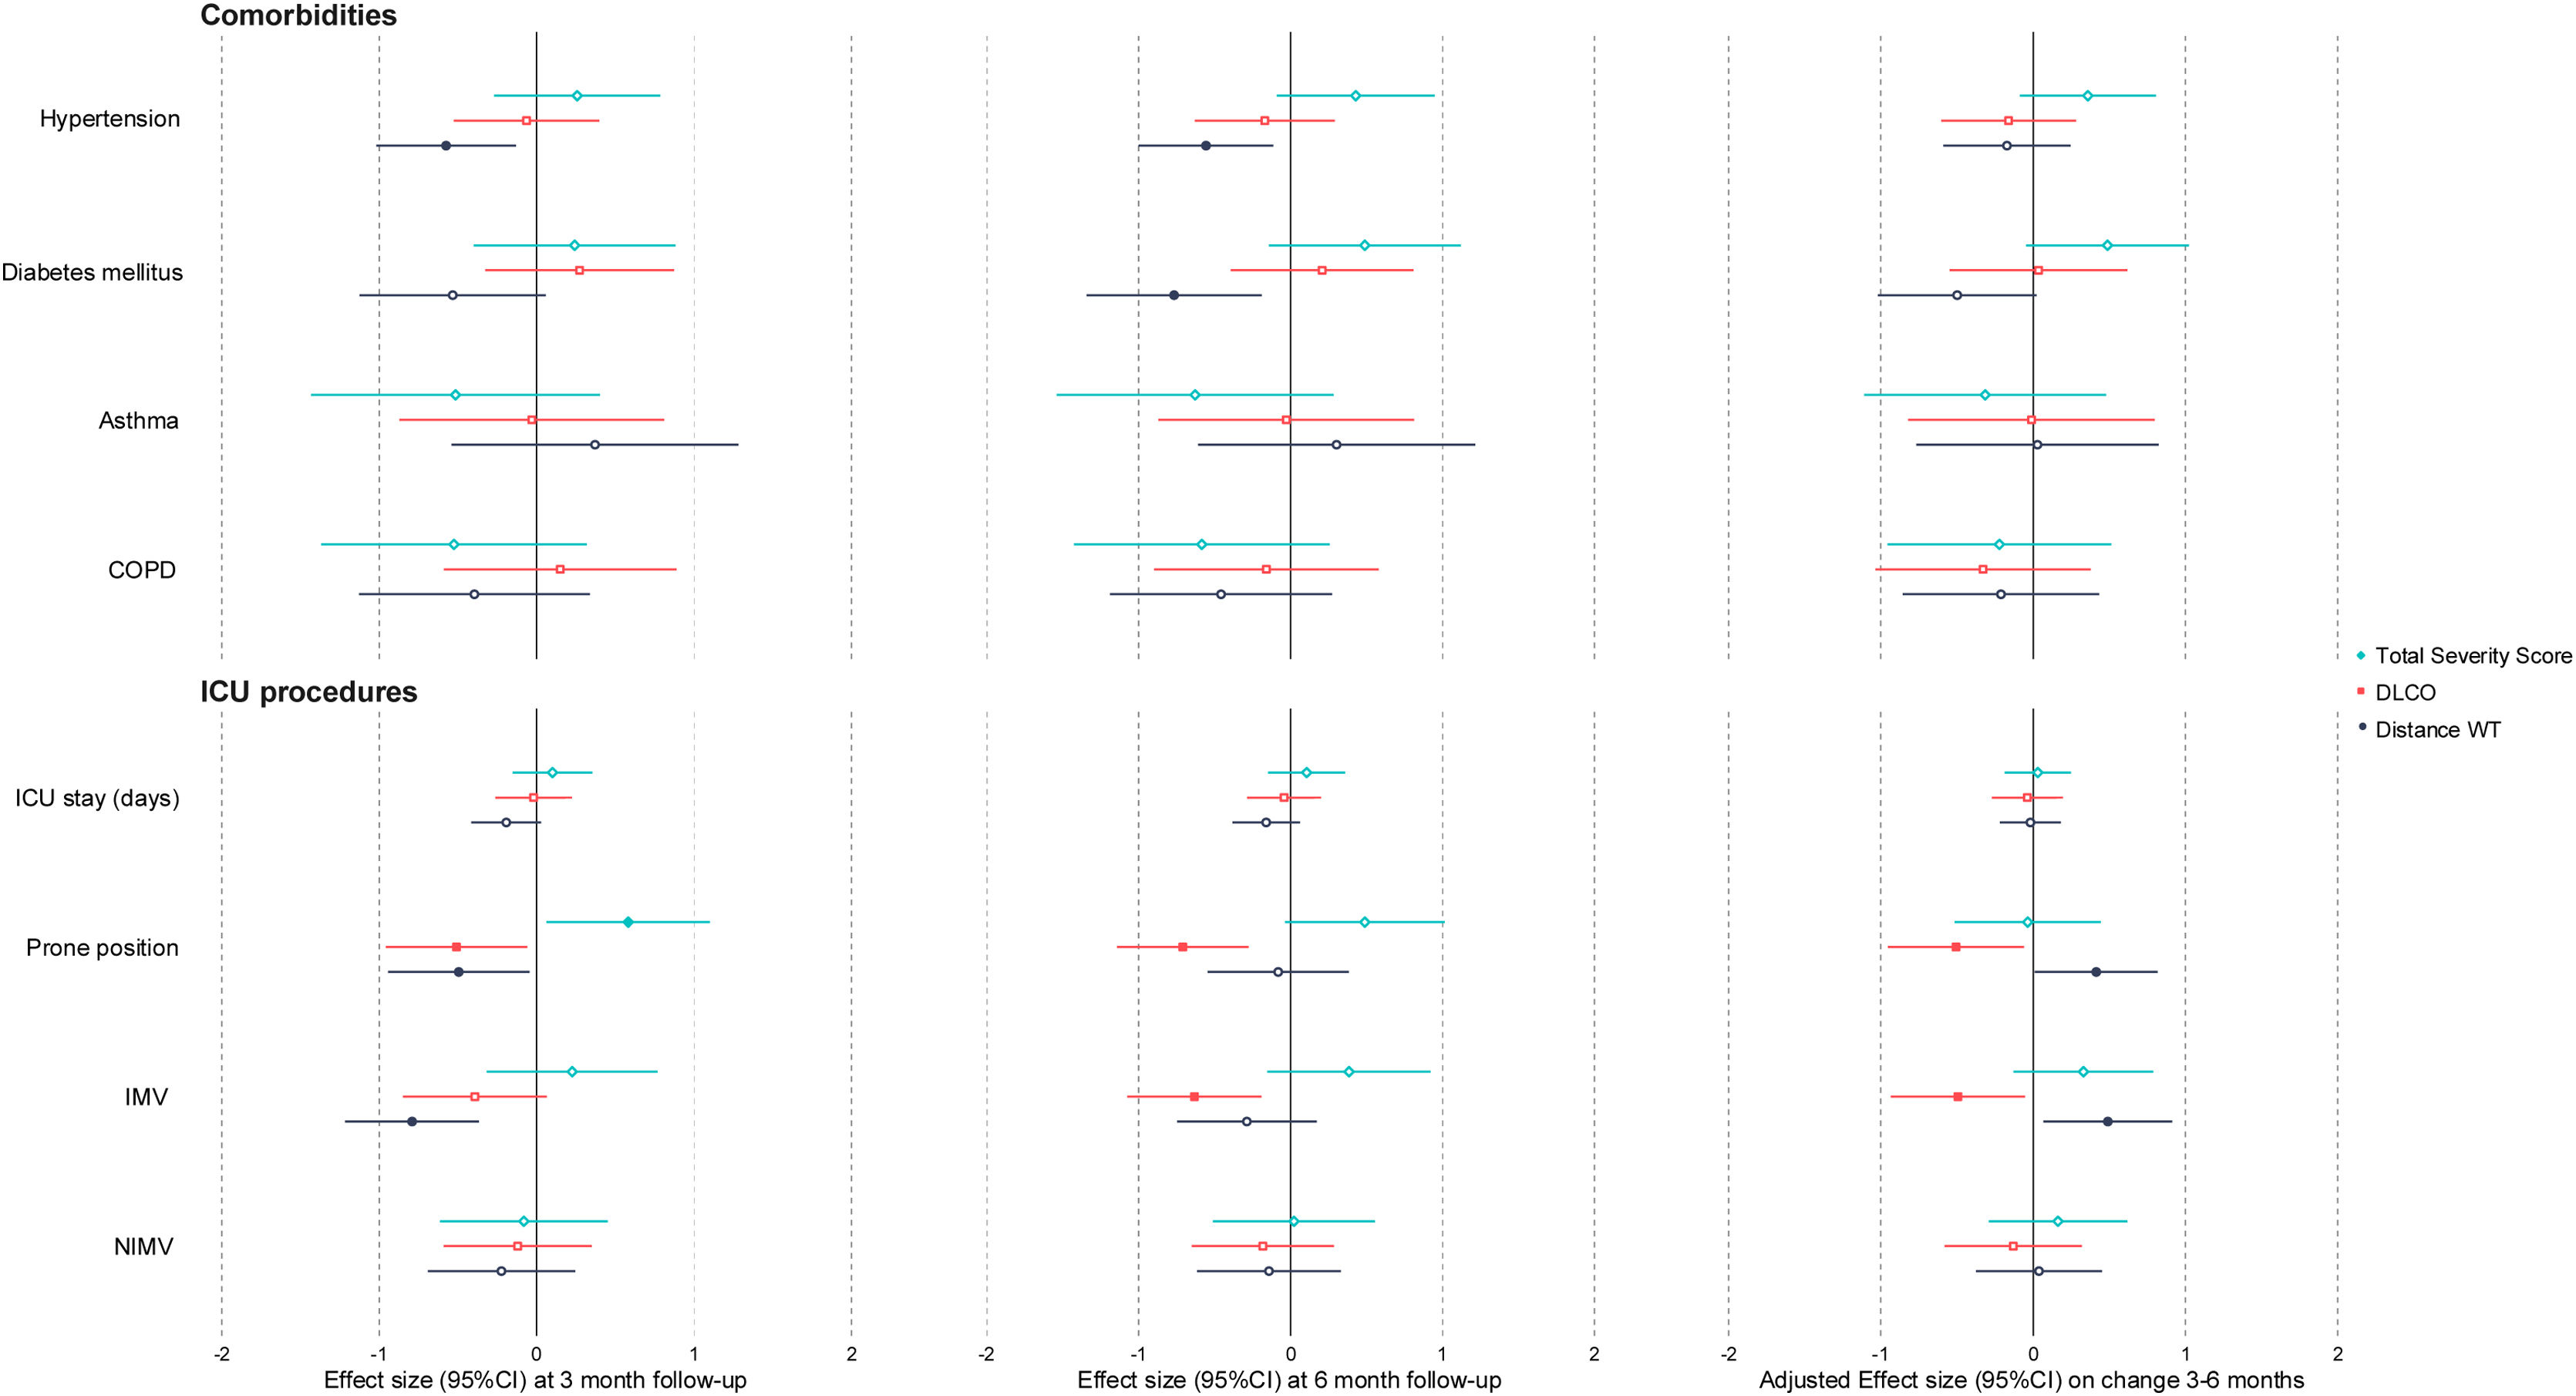
The baseline characteristics associated with pulmonary and radiological features at 3 months and 6 months and the changes between visits are shown Fig. 1. Patients with a previous history of hypertension or diabetes walked less in the 6MWT at both follow-ups. Patients who underwent invasive mechanical ventilation (IMV) and prone positioning in the ICU presented worse distances in the 6MWT test at 3 months, although they showed better improvement between 3 and 6 months. Furthermore, these patients had worse TSS and DLCO at three months and showed a worse evolution of DLCO between 3 and 6 months. The rest of the comorbidities, ICU procedures and demographic traits (sex, age and BMI) and treatment received (data not shown) did not show significant correlations with DLCO, TSS or distance in the 6MWT test at 3 and 6 months or in the changes between visits. Seven patients received systemic glucocorticoids, 6 inhaled glucocorticoids and 34 a specific pulmonary rehabilitation program between 3 and 6 months. None of these actions showed a different evolution in lung function or CT findings (data not shown).

Our prospective study showed that although there was an improvement in radiological findings, lung diffusing capacity remained impaired at 6 months of follow-up in a high proportion of critical survivors of COVID-19. Moreover, 75% of patients still presented residual lesions on chest CT. Clinical conditions such as hypertension and diabetes were linked to the distance covered in the 6MWT at 6 months’ follow-up. Moreover, the factors associated with a worse DLCO and its non-improvement during the 3rd and 6th months of follow-up were IMV and prone positioning during the ICU stay.
To our knowledge, there are only two studies describing long-term pulmonary sequelae in hospitalized COVID-19 patients.5,6 They observed a higher proportion of patients with impaired DLCO (56%) at the 6-month follow-up in the group of patients who required high-flow oxygen therapy (HFOT), non-invasive ventilation (NIV) or IMV in the acute phase. Moreover, they found that disease severity in the acute phase was associated with pulmonary diffusion abnormalities and lung damage on chest CT at the 6-month follow-up. The proportion of lung damage was even higher in our study (79%) due to the severity of the patients enrolled. In fact, acute phase severity markers such as comorbidities (hypertension and diabetes), orotracheal intubation and prone positioning are prognostic factors of poor functionality and lack of improvement between the 3 and 6-month of follow-ups.
Low DLCO could be consequence of interstitial abnormalities or pulmonary vascular abnormalities caused by critical COVID-19. Notably, radiological findings improved while gas-blood exchange abnormalities persisted, suggesting that distinct mechanisms might underlie these alterations. Additionally, there are other pulmonary lesions in our population such as bronchiectasis that could contribute to this fact. Even the prevalence of them in our cohort is very high, other studies reported signs of reticulation, fibrous bands and bronchiectasis in a 67% of critical ill COVID-19 survivors.7 These facts merit further investigation, especially over long-term follow-up.
The main limitation of our study is that it had a small cohort from a single city. A larger sample from different hospitals would be ideal for this type of study. However, generalization of our results is facilitated by our cohort being well-characterized and prospective. Additionally, it is uncertain whether lung lesions and functional lung impairment were present before the study, nevertheless, it is a relatively young cohort without a significant prevalence of previous respiratory disease diagnosis.
In conclusion, pulmonary sequelae persist at 6 months despite partial radiological resolution in critically ill COVID-19 patients, with no improvement in pulmonary function that could imply the initial establishment of an irreversible, chronic disorder. By identifying characteristics, such as previous comorbidities and the need for IMV or prone positioning, that are associated with a less satisfactory evolution, it would be possible to improve after-discharge management and follow-up of these critically ill patients.
FundingSupported in part by ISCIII (CIBERESUCICOVID, COV20/00110), co-funded by ERDF, “Una manera de hacer Europa”.
Conflict of InterestNo conflicts exist for any of the authors.
David de Gonzalo Calvo acknowledges receiving financial support from Instituto de Salud Carlos III (ISCIII; MiguelServet2020: CP20/00041), co-funded by the European Social Fund (ESF), “Investing in your future”. Jordi de Batlle acknowledges receiving financial support from the Instituto de Salud Carlos III (ISCIII; Miguel Servet 2019: CP19/00108), co-funded by the European Social Fund (ESF), “Investing in your future”.


