
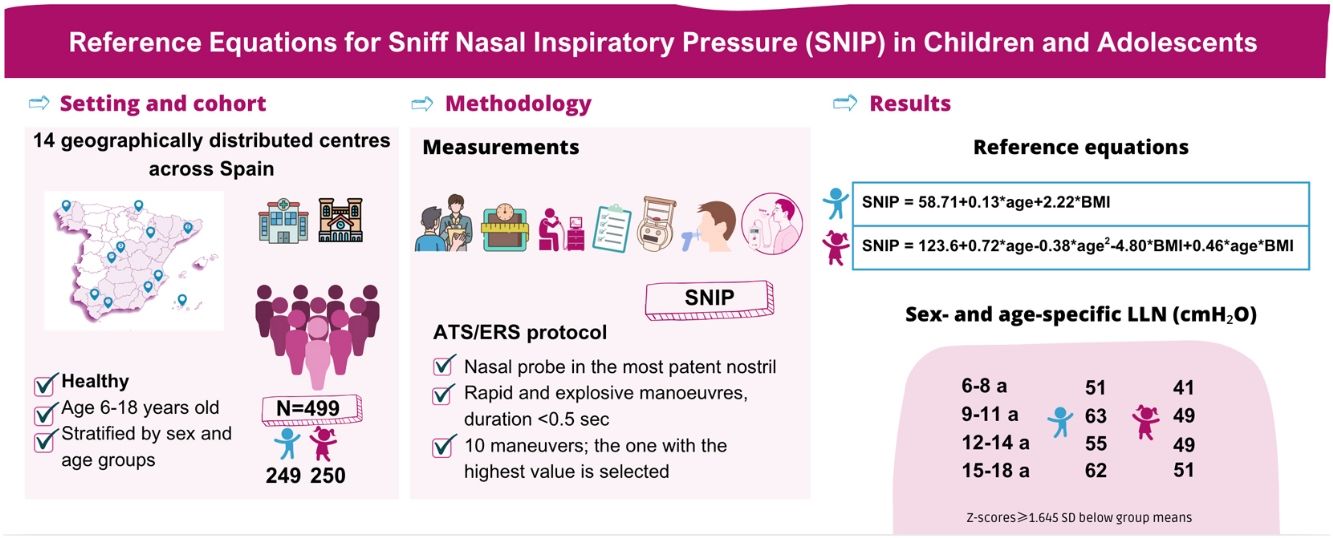

Inspiratory muscle weakness presents significant diagnostic challenges, particularly in children. Maximal sniff nasal inspiratory pressure (SNIP) is complementary to maximal inspiratory pressure (PImax) for assessing inspiratory muscle strength. This study aims to establish reference equations and lower limits of normal (LLN) for SNIP in paediatric population and to compare SNIP and PImax values.
MethodsA multicentre cross-sectional study was conducted across 14 Spanish centres. Healthy children aged 6–18 years, stratified by sex and age, were recruited. Anthropometric and spirometric data were collected, and PImax and SNIP were measured following standardized procedures. Reference equations for SNIP were derived using multiple linear regression analysis. Sex- and age-specific LLN were calculated using Z-scores≥1.645 standard deviation (SD) below group means. Statistical comparisons between SNIP and PImax were performed using t-tests.
ResultsThe final sample included 499 subjects (250 girls; 11.5 [SD 3.5] years). SNIP reference equations are: girls=123.6+0.72*age−0.38*age2−4.80*body mass index (BMI)+0.46*age*BMI; boys=58.71+0.13*age+2.22*BMI. LLN ranged from 51 to 62 and 49 to 51cmH2O for boys and girls, respectively. SNIP values were significantly lower than PImax in both sexes (p<.001).
ConclusionsThis study presents the largest paediatric SNIP dataset worldwide, enabling the derivation of reference equations and sex- and age-specific LLN for SNIP. These findings have important clinical implications, particularly for assessing inspiratory muscle strength in patients unable to perform PImax. Furthermore, the comparison between SNIP and PImax suggests that these tests are not interchangeable in the paediatric population, but rather provide complementary information.

Respiratory muscle weakness may arise as a consequence of existing conditions or as a new manifestation, often leading to breathlessness or respiratory failure [1,2]. In paediatric populations, it is commonly associated with chronic respiratory diseases [3], obesity [4], thoracic cage deformities [5], and neuromuscular disorders [6]. Therefore, objective diagnostic tools are essential for accurate assessment and guiding appropriate interventions [7].
The most commonly used methods to evaluate respiratory muscle strength involve non-invasive voluntary manoeuvres, including maximal inspiratory and expiratory pressures (PImax and PEmax), measured at the mouth [8]. However, these tests may be unreliable in patients with severe facial paralysis, due to difficulty maintaining a proper seal on the mouthpiece [9]. Maximal sniff nasal inspiratory pressure (SNIP) is another non-invasive test for assessing inspiratory muscle strength. Unlike PImax, SNIP does not require lip sealing and has a shorter duration [9]. Additionally, it is a more natural manoeuvre, making it easier for children to perform with minimal training [10], as they instinctively execute this type of effort from the age of two [8]. SNIP provides a reliable estimate of inspiratory muscle strength in both healthy children and those with inspiratory muscle weakness [8].
Evidence indicates that SNIP should be employed as a complementary assessment alongside PImax in children with suspected respiratory muscle weakness, as the combined use of both tests can enhance diagnostic accuracy and help minimize false-positive results related to suboptimal effort or technical limitations during PImax manoeuvres [10]. Furthermore, SNIP has been shown to be applicable and safe in various paediatric populations, including those with neuromuscular conditions [11,12].
As with all pulmonary function tests, reference equations for SNIP derived from healthy populations are crucial for the objective identification of respiratory muscle dysfunction. To date, very few studies have provided reference values for SNIP in children, collectively involving approximately 500 subjects [13]. To the best of our knowledge, only Rafferty et al. [14] have developed reference equations for both sexes, whereas Stefanutti and Fitting [15] reported predictive equations exclusively for boys. However, neither study included a Spanish population, and both were published more than two decades ago.
Moreover, sex- and age-specific lower limits of normal (LLN), typically determined using Z-scores≤1.645 standard deviations (SD) [16], are also limited for SNIP. The only available LLN were derived from a Brazilian cohort [17]. Nevertheless, this population may not represent the characteristics of Spanish children.
On this basis, the present study aimed to establish SNIP reference equations and sex- and age-specific LLN for the Spanish paediatric population aged 6–18 years. Additionally, we aimed to assess the agreement between SNIP and PImax in healthy children.
MethodsThis article reports a subset of baseline data from a cross-sectional study conducted between 2022 and 2024 across 14 centres in Spain, aimed at deriving PImax/PEmax reference equations in the Spanish paediatric population. It was approved by the Clinical Research Ethics Committee (CEIC) of Coruña-Ferrol (2022/173). The sample comprised healthy paediatric volunteers aged 6–18 years residing in Spain for at least the preceding 12 months and who were non-smokers or former smokers with at least one year of smoking abstinence. No restrictions were applied based on ethnicity or ancestry, in order to ensure that the derived reference equations are representative of the current paediatric population living in Spain. Participants were stratified by geographical region, sex and age groups (6–8, 9–11, 12–14, 15–18 years). Exclusion criteria were: premature birth (<37 weeks), low birth weight (<2.5kg), body mass index (BMI) percentiles below the 3rd or above the 97th percentile based on World Health Organization (WHO) guidelines [18]; history of respiratory, cardiac, neurovascular, or neuromuscular disorders; structural chest abnormalities; septal deviations; thoracoabdominal surgery within the last three months; recent upper respiratory infections (e.g., cold, flu or SARS-CoV-2) in the last 30 days; a diagnosis of long COVID-19; chronic rhinitis or sinusitis; regular use of medications for respiratory allergies, oral steroids, central nervous system depressant or muscle relaxants; eye or middle ear conditions; pregnancy; or an inability to follow measurement instructions. Additionally, children exhibiting abnormal ventilatory patterns during spirometry were excluded.
Sociodemographic and health-related data were collected through a personal interview. Weight and height were recorded and BMI percentiles were calculate using WHO AnthroPlus software (WHO, Switzerland) [18]. Physical activity levels were evaluated using two age-appropriate questionnaires. School-aged children completed the Youth Activity Profile Questionnaire, Spanish version (YAP-S) [19], whereas individuals over 16 years in higher education filled out the International Physical Activity Questionnaire, short Spanish version (IPAQ-short) [20]. Grip strength was measured following the National Health and Nutrition Examination Survey protocol [21]. Both physical activity and grip strength were included as potential confounders in the analysis of SNIP.
Pulmonary function testing was conducted according to international guidelines [22], comparing the results with the predicted values for Spanish children established by Casan et al. [23]. PImax/PEmax were measured as one-second plateau pressure, following American Thoracic Society (ATS)/ERS recommendations [8,24] and the Spanish Society of Pulmonology and Thoracic Surgery (SEPAR) protocol [25]. A more detailed description of the PImax/PEmax procedures has been previously published [26].
Ten minutes after the measurement of PImax, the SNIP was performed in accordance with ATS/ERS and SEPAR standards [8,25]. A MicroRPM® digital manometer (Vyaire Medical GmbH, Hoechberg, Germany) linked to PUMA® software, was used. It was connected with a nasal plug, which was inserted into the more permeable nostril while the contralateral nostril remained open. Participants were seated, trunk upright, and mouth closed during the manoeuvres. From functional residual capacity, they performed a maximal inspiratory effort, with visual feedback and verbal commands provided. A total of ten repetitions were completed, with 30-s rest between attempts [8,25]. The criteria for acceptance required the manoeuvres to be quick and explosive (<0.5s), and resulting in a sharp, narrow pressure curve [27]. The highest value achieved was recorded. Additional details can be found in the online Supplementary Material.
All assessments were conducted in a single session by trained physiotherapists at each centre, who underwent a comprehensive training programme to ensure consistency in measurement procedures. Strict quality control procedures were implemented to ensure adherence to the established protocol (online Supplementary Material).
Statistical analysisThe sample size calculation was based on the requirements for PImax/PEmax reference equations [26] (online Supplementary Material). Prior to any analysis, we assessed whether the available sample (n=250 girls; n=249 boys) was sufficient to derive SNIP reference equations. Assuming sex-specific SD values for SNIP of ±23cmH2O for girls and 26cmH2O for boys aged 6–17 years, as reported by Stefanutti and Fitting [15], we obtained a desired precision of ±2.85cmH2O for girls and ±3.25cmH2O for boys for a 95% confidence interval (95%IC). Accounting for an estimated 10% withdrawal rate, 278 girls and 273 boys were required. Therefore, the sample was considered adequate to establish SNIP reference equations.
Firstly, we evaluated the factors associated with inspiratory muscle strength. For the effect of categorical variables, dependency was analyzed using t-tests or U-tests, and ANOVA or Kruskal–Wallis tests, depending on whether comparisons involved two or more groups, and based on normality assumptions. Dependency between continuous variables were examined using Pearson correlation coefficients. Next, multiple linear regression analysis was conducted to derive the most accurate reference equations for SNIP based on age and BMI, separately for each sex. The modelling strategy included the evaluation of linear, non-linear, and interaction effects. The normality of variables within each sex group was confirmed for all age subgroups. An ANOVA test between nested models was applied to select the most appropriate equation. The final model was further validated through cross-validation techniques [28].
Additionally, the LLN for SNIP was calculated for boys and girls in each age group, using the following formula: LLN=age-range specific mean−1.645SD [14,29,30].
The agreement between SNIP and PImax was evaluated both overall and by sex, using a paired t-test and the method of differences from the means as outlined by Bland and Altman [31], with proportional biases also calculated using linear regression analysis [32]. Statistical significance was considered at p<.05 and a 95%IC was used. All statistical analyses were performed using R 4.1.3 (R Core Team, 2023) [33].
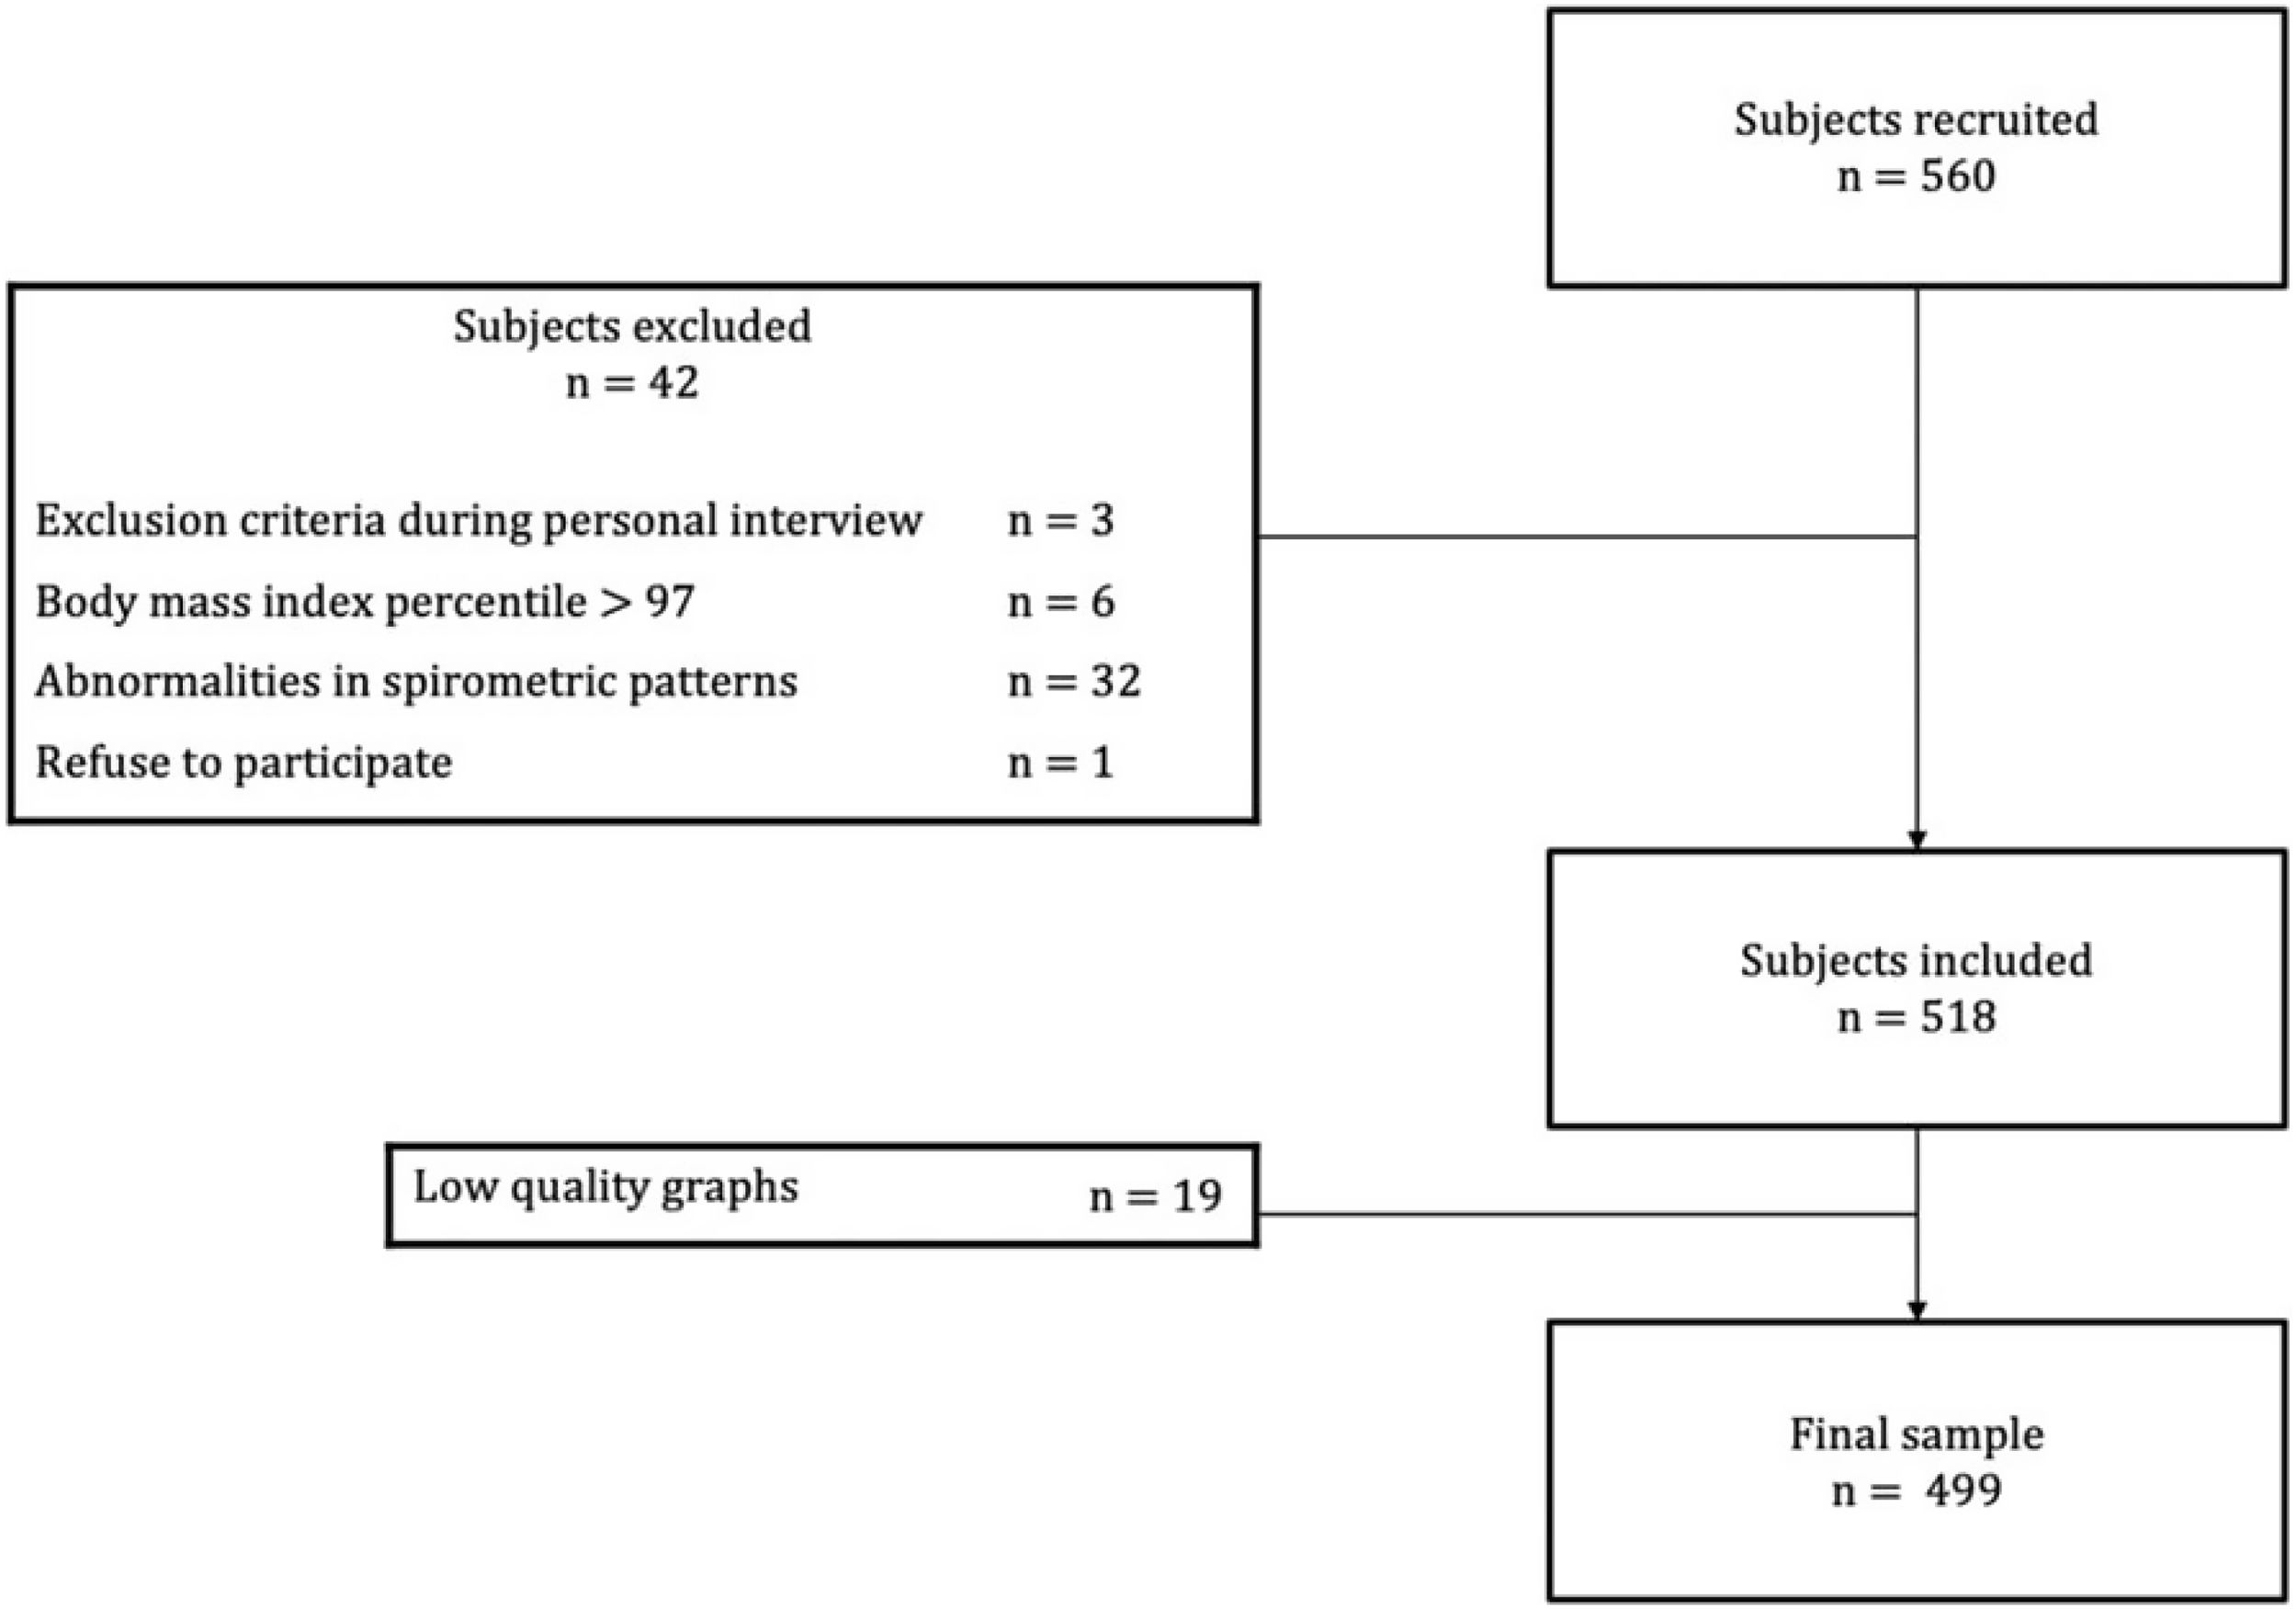
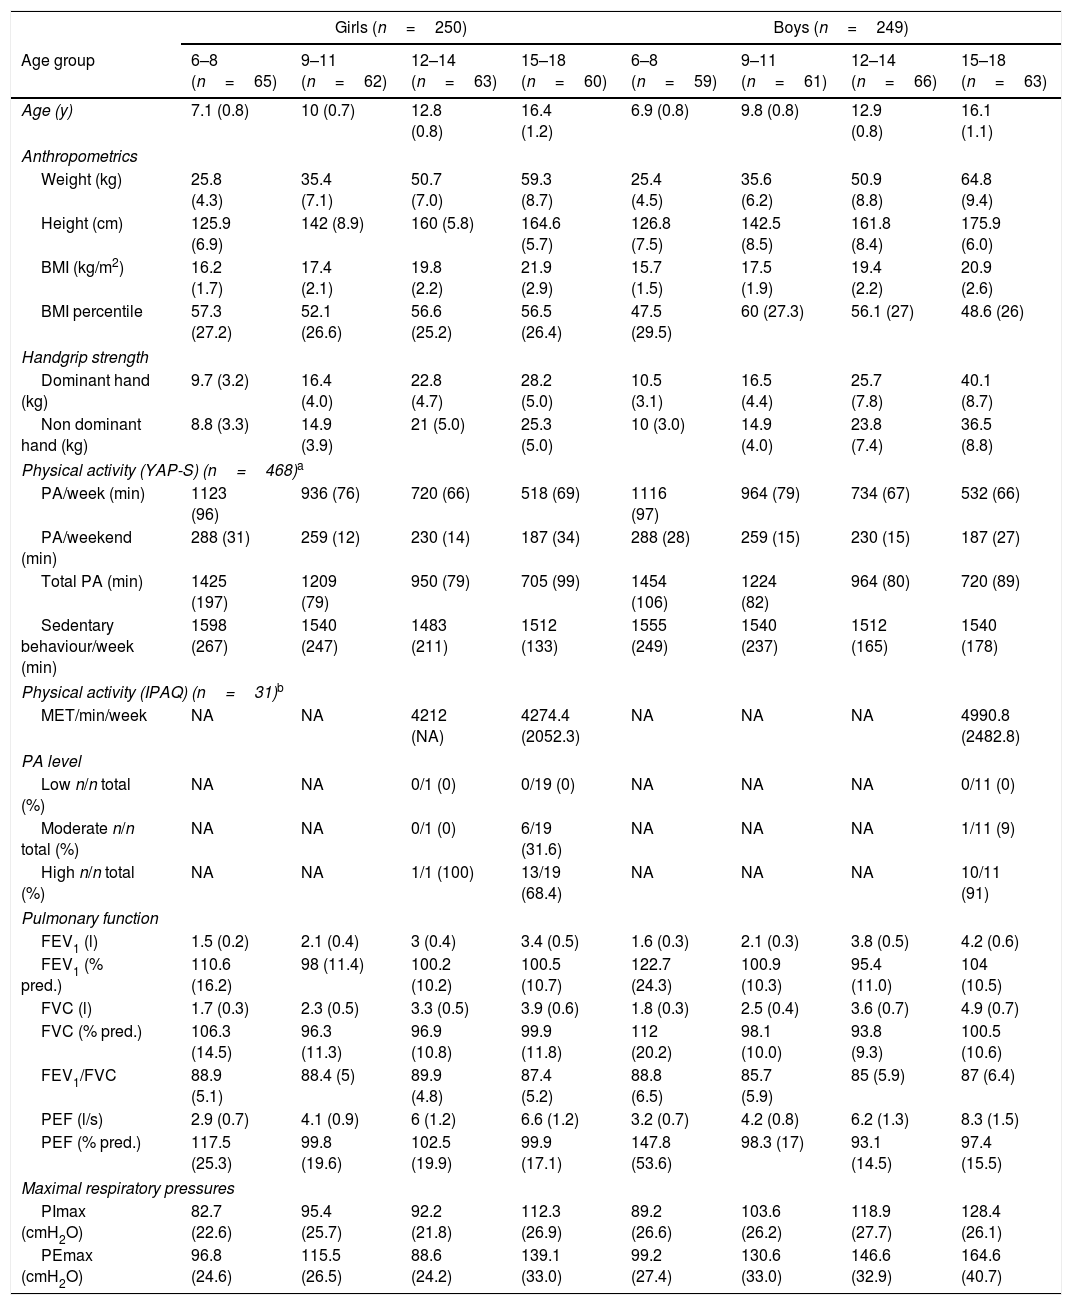
ResultsA total of 560 subjects were initially recruited, with 61 excluded for the reasons detailed in Fig. 1. Thus, data from 499 children (250 girls, 11.5±3.5 years) were included in the analysis. The characteristics of the sample are presented in Table 1.

Characteristics of the sample used for the development of the maximal sniff nasal inspiratory pressure reference equations stratified by sex and age groups (n=499).
| Girls (n=250) | Boys (n=249) | |||||||
|---|---|---|---|---|---|---|---|---|
| Age group | 6–8 (n=65) | 9–11 (n=62) | 12–14 (n=63) | 15–18 (n=60) | 6–8 (n=59) | 9–11 (n=61) | 12–14 (n=66) | 15–18 (n=63) |
| Age (y) | 7.1 (0.8) | 10 (0.7) | 12.8 (0.8) | 16.4 (1.2) | 6.9 (0.8) | 9.8 (0.8) | 12.9 (0.8) | 16.1 (1.1) |
| Anthropometrics | ||||||||
| Weight (kg) | 25.8 (4.3) | 35.4 (7.1) | 50.7 (7.0) | 59.3 (8.7) | 25.4 (4.5) | 35.6 (6.2) | 50.9 (8.8) | 64.8 (9.4) |
| Height (cm) | 125.9 (6.9) | 142 (8.9) | 160 (5.8) | 164.6 (5.7) | 126.8 (7.5) | 142.5 (8.5) | 161.8 (8.4) | 175.9 (6.0) |
| BMI (kg/m2) | 16.2 (1.7) | 17.4 (2.1) | 19.8 (2.2) | 21.9 (2.9) | 15.7 (1.5) | 17.5 (1.9) | 19.4 (2.2) | 20.9 (2.6) |
| BMI percentile | 57.3 (27.2) | 52.1 (26.6) | 56.6 (25.2) | 56.5 (26.4) | 47.5 (29.5) | 60 (27.3) | 56.1 (27) | 48.6 (26) |
| Handgrip strength | ||||||||
| Dominant hand (kg) | 9.7 (3.2) | 16.4 (4.0) | 22.8 (4.7) | 28.2 (5.0) | 10.5 (3.1) | 16.5 (4.4) | 25.7 (7.8) | 40.1 (8.7) |
| Non dominant hand (kg) | 8.8 (3.3) | 14.9 (3.9) | 21 (5.0) | 25.3 (5.0) | 10 (3.0) | 14.9 (4.0) | 23.8 (7.4) | 36.5 (8.8) |
| Physical activity (YAP-S) (n=468)a | ||||||||
| PA/week (min) | 1123 (96) | 936 (76) | 720 (66) | 518 (69) | 1116 (97) | 964 (79) | 734 (67) | 532 (66) |
| PA/weekend (min) | 288 (31) | 259 (12) | 230 (14) | 187 (34) | 288 (28) | 259 (15) | 230 (15) | 187 (27) |
| Total PA (min) | 1425 (197) | 1209 (79) | 950 (79) | 705 (99) | 1454 (106) | 1224 (82) | 964 (80) | 720 (89) |
| Sedentary behaviour/week (min) | 1598 (267) | 1540 (247) | 1483 (211) | 1512 (133) | 1555 (249) | 1540 (237) | 1512 (165) | 1540 (178) |
| Physical activity (IPAQ) (n=31)b | ||||||||
| MET/min/week | NA | NA | 4212 (NA) | 4274.4 (2052.3) | NA | NA | NA | 4990.8 (2482.8) |
| PA level | ||||||||
| Low n/n total (%) | NA | NA | 0/1 (0) | 0/19 (0) | NA | NA | NA | 0/11 (0) |
| Moderate n/n total (%) | NA | NA | 0/1 (0) | 6/19 (31.6) | NA | NA | NA | 1/11 (9) |
| High n/n total (%) | NA | NA | 1/1 (100) | 13/19 (68.4) | NA | NA | NA | 10/11 (91) |
| Pulmonary function | ||||||||
| FEV1 (l) | 1.5 (0.2) | 2.1 (0.4) | 3 (0.4) | 3.4 (0.5) | 1.6 (0.3) | 2.1 (0.3) | 3.8 (0.5) | 4.2 (0.6) |
| FEV1 (% pred.) | 110.6 (16.2) | 98 (11.4) | 100.2 (10.2) | 100.5 (10.7) | 122.7 (24.3) | 100.9 (10.3) | 95.4 (11.0) | 104 (10.5) |
| FVC (l) | 1.7 (0.3) | 2.3 (0.5) | 3.3 (0.5) | 3.9 (0.6) | 1.8 (0.3) | 2.5 (0.4) | 3.6 (0.7) | 4.9 (0.7) |
| FVC (% pred.) | 106.3 (14.5) | 96.3 (11.3) | 96.9 (10.8) | 99.9 (11.8) | 112 (20.2) | 98.1 (10.0) | 93.8 (9.3) | 100.5 (10.6) |
| FEV1/FVC | 88.9 (5.1) | 88.4 (5) | 89.9 (4.8) | 87.4 (5.2) | 88.8 (6.5) | 85.7 (5.9) | 85 (5.9) | 87 (6.4) |
| PEF (l/s) | 2.9 (0.7) | 4.1 (0.9) | 6 (1.2) | 6.6 (1.2) | 3.2 (0.7) | 4.2 (0.8) | 6.2 (1.3) | 8.3 (1.5) |
| PEF (% pred.) | 117.5 (25.3) | 99.8 (19.6) | 102.5 (19.9) | 99.9 (17.1) | 147.8 (53.6) | 98.3 (17) | 93.1 (14.5) | 97.4 (15.5) |
| Maximal respiratory pressures | ||||||||
| PImax (cmH2O) | 82.7 (22.6) | 95.4 (25.7) | 92.2 (21.8) | 112.3 (26.9) | 89.2 (26.6) | 103.6 (26.2) | 118.9 (27.7) | 128.4 (26.1) |
| PEmax (cmH2O) | 96.8 (24.6) | 115.5 (26.5) | 88.6 (24.2) | 139.1 (33.0) | 99.2 (27.4) | 130.6 (33.0) | 146.6 (32.9) | 164.6 (40.7) |
Data are reported as mean (standard deviation) unless otherwise stated.
IPAQ-S was used for older participants in higher education.
BMI: body mass index; cm: centimetres; cmH2O: centimetres of water; FEV1: forced expiratory volume in one second; FVC: forced vital capacity; IPAQ: International Physical Activity Questionnaire; kg: kilograms; l: litres; m: metres; METs: metabolic equivalent of task; min: minutes; PA: physical activity; PEF: peak expiratory flow; PEmax: maximal expiratory pressure; PImax: maximal inspiratory pressure; pred.: predicted; y: years; YAP-S: Youth Activity Profile, Spanish version.
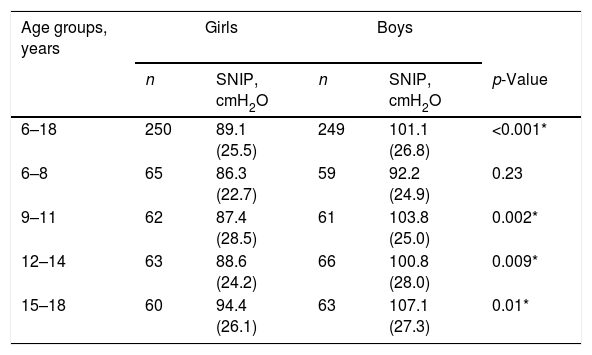
Significant statistical differences were observed in the SNIP values between girls and boys (89.1±25.5 vs. 101.1±26.8cmH2O, respectively; p<.001). When analyzing by sex and age groups, significant differences persisted, with boys consistently showing higher SNIP values, particularly in the 9–11 years group (p=.002). The only exception was in the youngest age group, where no significant differences were found between sexes. These sex- and age-related differences are detailed in Table 2.
Maximal sniff nasal inspiratory pressure values by sex and age groups and their comparison between girls and boys.
| Age groups, years | Girls | Boys | |||
|---|---|---|---|---|---|
| n | SNIP, cmH2O | n | SNIP, cmH2O | p-Value | |
| 6–18 | 250 | 89.1 (25.5) | 249 | 101.1 (26.8) | <0.001* |
| 6–8 | 65 | 86.3 (22.7) | 59 | 92.2 (24.9) | 0.23 |
| 9–11 | 62 | 87.4 (28.5) | 61 | 103.8 (25.0) | 0.002* |
| 12–14 | 63 | 88.6 (24.2) | 66 | 100.8 (28.0) | 0.009* |
| 15–18 | 60 | 94.4 (26.1) | 63 | 107.1 (27.3) | 0.01* |
Data are reported as mean (standard deviation).
cmH2O: centimetres of water; PImax: maximal inspiratory pressure; SNIP: sniff nasal inspiratory pressure.
* Statistically significant.
Regression analysis identified age and BMI as significant predictors for SNIP in both sexes. Additional details are presented in Table S1 of online Supplementary Material. The derived sex-specific reference equations for SNIP are:




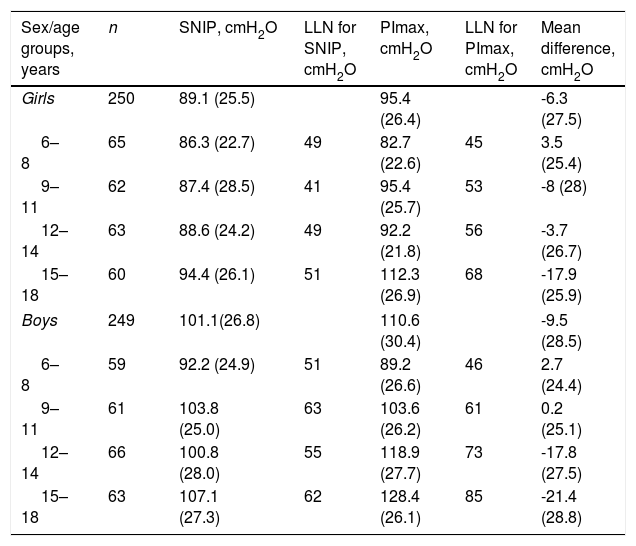
Sex- and age-specific LLN were calculated as Z-scores≥1.645 SD below the mean (Table 3). Values ranged from 51 to 62cmH2O in boys and 49 to 51cmH2O in girls.
Agreement between maximal sniff nasal inspiratory pressure and maximal inspiratory pressure by sex and age groups and lower limits of normal for both tests by sex and age groups.
| Sex/age groups, years | n | SNIP, cmH2O | LLN for SNIP, cmH2O | PImax, cmH2O | LLN for PImax, cmH2O | Mean difference, cmH2O |
|---|---|---|---|---|---|---|
| Girls | 250 | 89.1 (25.5) | 95.4 (26.4) | -6.3 (27.5) | ||
| 6–8 | 65 | 86.3 (22.7) | 49 | 82.7 (22.6) | 45 | 3.5 (25.4) |
| 9–11 | 62 | 87.4 (28.5) | 41 | 95.4 (25.7) | 53 | -8 (28) |
| 12–14 | 63 | 88.6 (24.2) | 49 | 92.2 (21.8) | 56 | -3.7 (26.7) |
| 15–18 | 60 | 94.4 (26.1) | 51 | 112.3 (26.9) | 68 | -17.9 (25.9) |
| Boys | 249 | 101.1(26.8) | 110.6 (30.4) | -9.5 (28.5) | ||
| 6–8 | 59 | 92.2 (24.9) | 51 | 89.2 (26.6) | 46 | 2.7 (24.4) |
| 9–11 | 61 | 103.8 (25.0) | 63 | 103.6 (26.2) | 61 | 0.2 (25.1) |
| 12–14 | 66 | 100.8 (28.0) | 55 | 118.9 (27.7) | 73 | -17.8 (27.5) |
| 15–18 | 63 | 107.1 (27.3) | 62 | 128.4 (26.1) | 85 | -21.4 (28.8) |
Data are reported as mean (standard deviation).
cmH2O: centimetres of water; LLN: lower limit of normal; PImax: maximal inspiratory pressure; SNIP: sniff nasal inspiratory pressure.
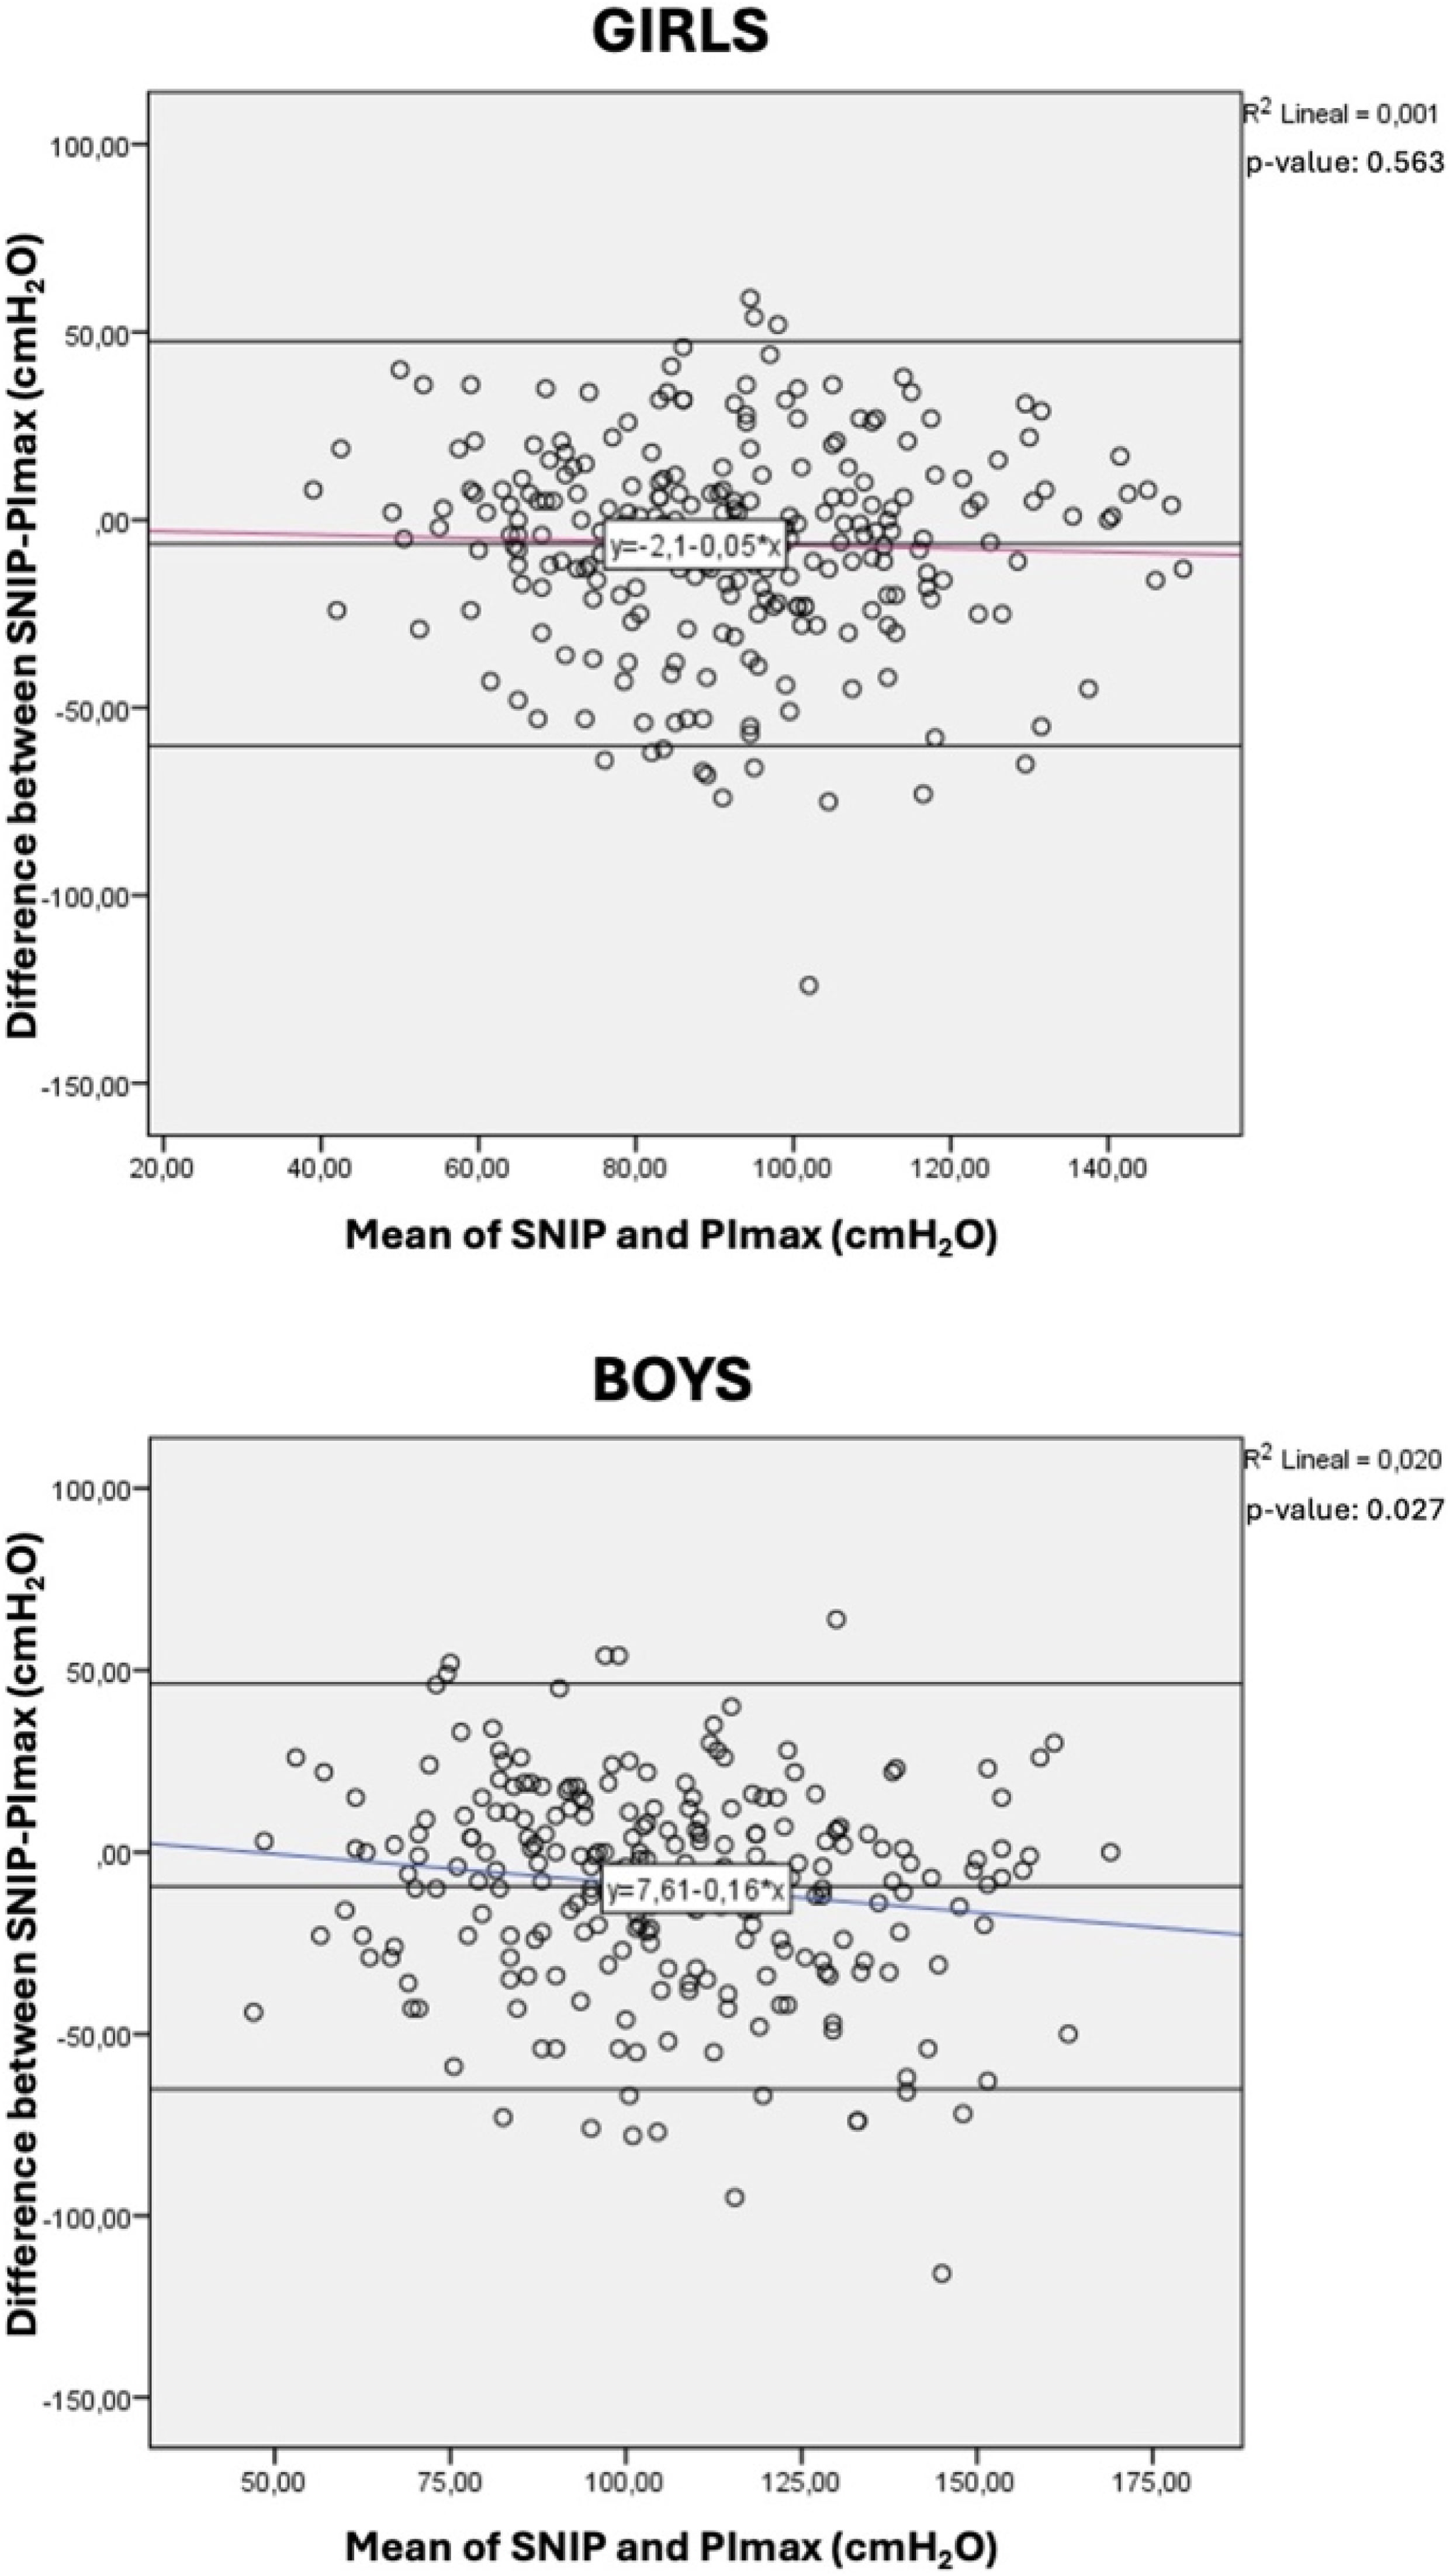
Comparing SNIP and PImax values by sex, significant differences were also detected for both girls (SNIP: 89.1±25.5 vs. PImax: 95.4±26.4 cmH2O; p<.001) and boys (SNIP: 101.1±26.9 vs. PImax: 110.6±30.4cmH2O; p<.001). Pearson's correlation analysis showed a moderate positive correlation between SNIP and PImax values (r=0.508; p<.001). Further analysis by sex and age group revealed significant differences between SNIP and PImax values in girls aged 9–11 and 15–18 years (p<.001) and in boys aged 12–14 and 15–18 years (p<.001). The Bland–Altman analysis revealed a mean difference of −7.9±28 cmH2O between the two techniques, with limits of agreement (LoA) ranging from −62.8 to 47 cmH2O. When analyzed by sex, the mean difference was −6.3(27.5) in girls, with LoA from −60.2 to 47.5cmH2O and −9.5(28.5) in boys, with LoA from −65.2 to 46.3cmH2O (Table 3). In all cases, the regression line exhibited a negative trend, indicating that as the mean values increase, PImax surpasses SNIP (Fig. 2). Proportional bias was observed for the overall sample (p=.02) as well as for the boys (p=.0027), but not for the girls (p=.563).

Bland–Altman plots illustrating the differences between maximal sniff nasal inspiratory pressure (SNIP) and maximal inspiratory pressure (PImax) in the total sample, as well as stratified by sex. The central line represents the bias, while the more distant lines indicate the 95% confidence intervals. The regression lines show a negative trend, indicating that as the mean values increase, the difference between SNIP and PImax widens, favouring PImax. The proportional bias is indicated by the p-values displayed in the upper right corner.
This study provides the first SNIP reference equations for the Spanish paediatric population, derived from the largest global sample and the broadest age range reported to date. Additionally, we present the first sex- and age-specific LLN for SNIP in children aged 6–18 years from a European country.
Boys in our sample exhibited higher SNIP values than girls, consistent with previous reports [14,15]. Sex-related differences in respiratory muscle strength emerge early and persist throughout life. Although they become more pronounced after puberty due to increased testosterone levels in males, disparities are already present in childhood and are largely attributable to biological factors such as body composition, stature, muscle mass and thoracic cage morphology [34].
After sex, age emerged as the second most significant predictor of SNIP. Our results show that SNIP increases with age in both sexes, a trend previously reported [14,15]. Consequently, age was incorporated into the predictive equations for both girls and boys, following the approach described by Rafferty et al. [14]. Similarly, Stefanutti and Fitting [15] developed SNIP reference equations exclusively for boys, with age as the sole explanatory variable. BMI was also included in our models, despite not being consistently identified as a determinant of SNIP in paediatric populations. Nevertheless, associations between SNIP and anthropometric variables have been documented [15,17]. Both age and BMI have also been included in recent Spanish adult SNIP reference equations [35].
SNIP values in our cohort differed from those reported in earlier studies [14,15,17]. For the 6–11-year age group, values in our cohort exceed those described by Rafferty et al. [14] for their 4–11 year sample in both sexes, and are also higher than those observed by Marcelino et al. [17] for boys in the same age range. Conversely, our results are slightly lower than those presented by Stefanutti and Fitting [15]. Several factors could explain this variability. Ethnic background is a plausible contributor in the case of Marcelino et al. [17], whereas a cohort effect might account for differences with the studies by Rafferty et al. [14] and Stefanutti and Fitting [15], as more than 20 years have passed since the data collection. Methodological discrepancies also contribute, primarily regarding the devices used. Our SNIP protocol is comparable to that of Stefanutti and Fitting [15] and the mainly methodological distinction from Marcelino et al. [17] relates to the number of manoeuvres performed, which ranged from 12 to 20 in their study. Notably, Marcelino et al. [36] reported that 80% of the maximum values were reached before the 10th manoeuvre. Rafferty et al. [14] do not specify the exact number of SNIP attempts nor the rest period between measurements, limiting the assessment of protocol comparability.
The adjusted R2 values of our equations were 0.06 and 0.03 for boys and girls. No R2 values have been reported for paediatric SNIP reference equations. In physiological reference modelling, relatively low R2 values are common and do not necessarily indicate poor clinical utility, provided that predictors are statistically significant and models are robust [37]. These results might suggest that, beyond age and BMI, SNIP performance is also influenced by developmental, physiological, and technical factors [37].
We calculated the LLN for SNIP using Z-scores≥1.645SD below the mean values. The LLN represents the lower boundary of the expected SNIP distribution in healthy children. Consequently, values<LLN indicate SNIP measurements that are statistically uncommon among healthy peers of the same sex and age and should be interpreted within the overall clinical context. Although alternative approaches have been proposed, particularly in skeletal muscle assessment [38] or recent pulmonary guidelines [39], this Z-score remains the most widely applied in paediatric respiratory muscle testing [14,26,29,30]. In our study, boys exhibited higher LLN than girls across all age groups, consistent with the observed mean values. Direct comparison was only possible with Marcelino et al. [17], who provided a single SNIP LLN for children aged 6–11 years. In contrast, our findings demonstrate marked variability across narrower age bands, supporting the use of age-specific LLN to better reflect the physiological progression of inspiratory strength with growth [34].
When SNIP was compared with PImax, significant differences favouring PImax were observed in older age groups (9–11 and 15–18 years in girls; 12–14 and 15–18 years in for boys), contrasting with existing literature that generally reported higher SNIP than PImax in both sexes [14,15]. This may be attributed to the fact that we measured PImax from RV, while studies such as those by Marcelino et al. [17] or Rafferty et al. [14] measured PImax from FRC. Marcelino et al. [17] obtained higher SNIP than PImax only in girls, which they suggested might be related to reduced motivation among boys. Stefanutti and Fitting [15] assessed PImax from both RV and FRC and also find a lower PImaxRV than SNIP. Although not statistically significant, our data also revealed that girls aged 6–8 years and boys aged 6–8 and 9–11 years exhibited higher SNIP compared to PImax. This could be explained by younger children finding SNIP easier to perform [8]. Given the discrepancy observed, it is evident that these tests should be considered complementary in children [40]. A notable pattern in our analysis was that SNIP values were comparable or slightly higher than PImax values in groups where PImax means were moderate. However, as PImax increased, SNIP did not match it. Bland–Altman analysis confirmed a proportional bias in the overall sample and in boys, with increasing differences favouring PImax at higher mean values, suggesting a ceiling effect for SNIP. In addition, the LoA were wide, indicating substantial variability between both measurements at the individual level. No proportional bias was observed in girls, possibly due to lower PImax and SNIP means. Taken together, these findings support the notion that SNIP and PImax should be interpreted as complementary measures of inspiratory muscle strength, rather than interchangeable tests.
The LLN mirrored the means, with PImax LLN generally exceeding those of SNIP across age groups. Differences between LLNs were minimal in childhood and increased progressively with age. Further studies are needed to elucidate the mechanisms underlying this sex-specific pattern.
This study has several notable strengths, including an unprecedented sample size, broad age coverage, balanced sex distribution, nationwide representation, and strict adherence to international measurement standards [8,25] with rigorous quality control.
On the other hand, several limitations should be acknowledged. The sample was not fully random due to ethical constraints, potentially introducing bias from volunteer participation. Additionally, participants were self-reported healthy, and undetected upper airway anatomical variations may have influenced results. The absence of short-term repeatability assessment of SNIP represents an additional limitation; however, this study provides clinically relevant reference data in a field with limited evidence, supporting its current clinical utility. Finally, although the proposed reference equations and LLN provide a robust normative framework derived from a healthy Spanish paediatric population, their generalisability to clinical populations and to children from other geographical contexts requires external validation.
Accordingly, future research should focus on evaluating the new reference equations and LLN in diverse paediatric populations and clinical settings, including their clinical relevance in children with confirmed inspiratory muscle weakness. Assessment of the short-term repeatability of SNIP will also be important to strengthen methodological robustness.
The reference equations and the LLN proposed may be implemented in clinical practice, providing a valuable tool for assessing inspiratory muscle weakness in conjunction with the reference equations for PImax previously developed [26]. This will be particularly useful for identifying inspiratory muscle weakness in children unable to perform PImax, such as those with neuromuscular disorders. Given the scarcity of SNIP paediatric reference data worldwide, our equations may also have potential applicability throughout Europe following validation, thereby enhancing respiratory care on an international scale.
ConclusionsThis study provides the largest paediatric SNIP dataset to date, with a well-balanced representation across age groups and sexes, collected following international guidelines. We derived robust reference equations and established sex- and age-specific LLN for SNIP. Our results further demonstrate that SNIP and PImax are not interchangeable in children but rather provide complementary information for the assessment of inspiratory muscle strength. These findings may serve as a valuable resource across European populations with similar demographic characteristics, particularly for evaluating patients in whom PImax is not feasible, thereby supporting improved clinical decision-making and respiratory care.
Artificial intelligence involvementThe authors declare that artificial intelligence tools have been utilized to assist in the manuscript drafting process.
The authors declare that artificial intelligence tools were used to assist in improving the clarity and fluency of the English language in the manuscript. All content was critically reviewed and edited by the authors.
Funding of the researchThis work was funded by a research grant from the Spanish Society of Pulmonology and Thoracic Surgery (Sociedad Española de Neumología y Cirugía Torácica, SEPAR, Spain), project 1373/2023, from The Official College of Physiotherapists from Galicia (Colexio Oficial de Fisioterapeutas de Galicia, CoFiGa, Spain) and from The “San Juan de Dios” University School of Nursing and Physical Therapy (Universidad Pontificia de Comillas, Spain). Funding for open access charge: Universidade da Coruña/CISUG.
Conflict of interestsThe authors declare not to have any conflicts of interest that may be considered to influence directly or indirectly the content of the manuscript.
We sincerely appreciate all the children and their families for their voluntary participation, which made this study possible. We also wish to acknowledge our colleagues who contributed to the data collection: Paula Gálvez Álvarez (University of Málaga) and Marta Rosende González (Complutense University of Madrid).
The followings are the supplementary data to this article: