


Obstructive sleep apnea (OSA) is a complex pathology with heterogeneity that has not been fully characterized to date. Our objective is to identify groups of patients with common clinical characteristics through cluster analysis that could predict patient prognosis, the impact of comorbidities and/or the response to a common treatment.
MethodsCluster analysis was performed using the hierarchical cluster method in 2025 patients in the apnea-HUGU cohort. The variables used for building the clusters included general data, comorbidity, sleep symptoms, anthropometric data, physical exam and sleep study results.
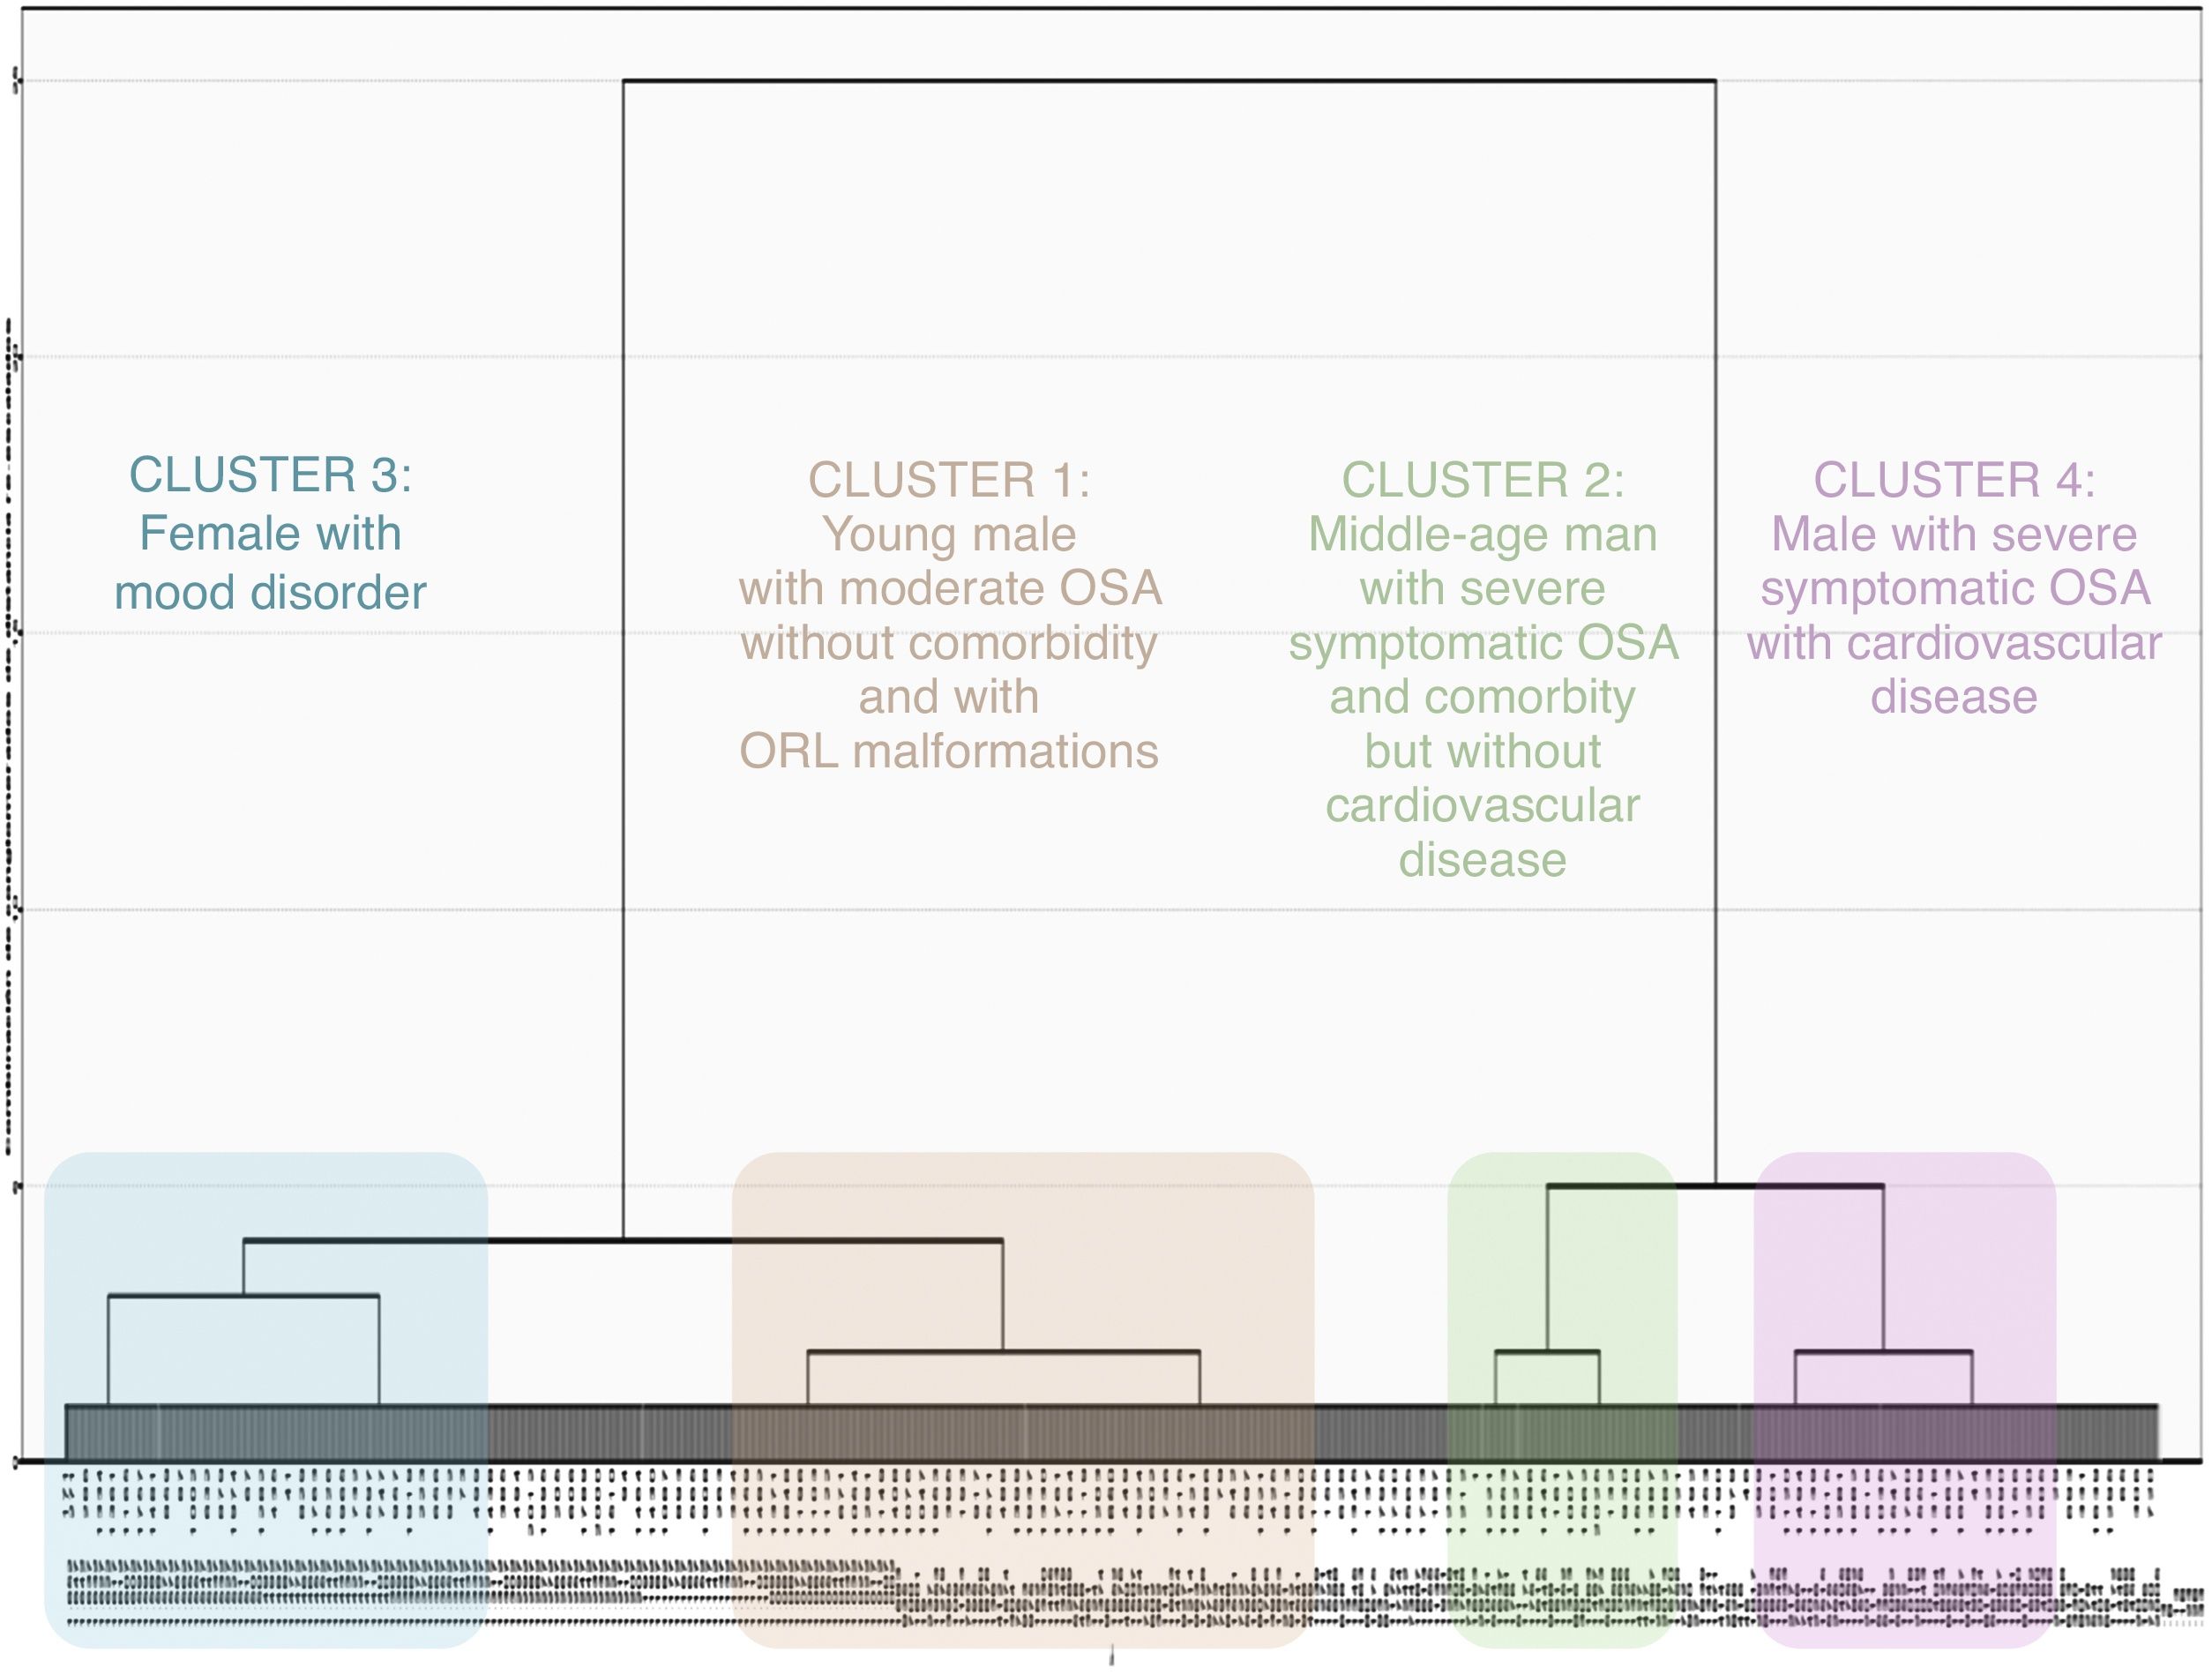
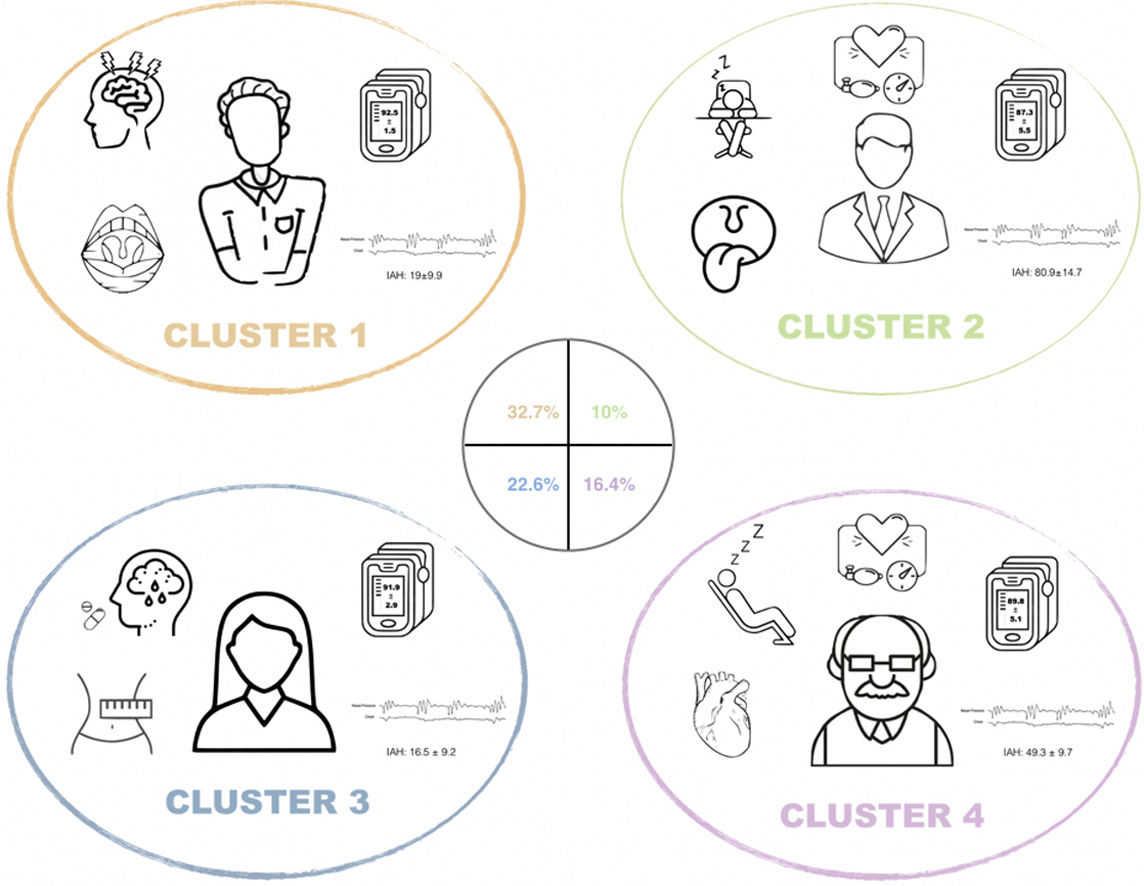
ResultsFour clusters were identified: (1) young male without comorbidity with moderate apnea and otorhinolaryngological malformations; (2) middle-aged male with very severe OSA with comorbidity without cardiovascular disease; (3) female with mood disorder; and (4) symptomatic male with established cardiovascular disease and severe OSA.
ConclusionsThe characterization of these four clusters in OSA can be decisive when identifying groups of patients who share a special risk or common therapeutic strategies, orienting us toward personalized medicine and facilitating the design of future clinical trials.
La Apnea Obstructiva del Sueño (AOS) es una patología compleja en la que su heterogeneidad no ha sido completamente caracterizada hasta la fecha. Nuestro objetivo es identificar grupos de pacientes con características clínicas comunes, por medio de análisis de clúster, que pudieran se predictivos de un pronóstico, impacto de comorbilidades y/o respuesta a un tratamiento común.
MétodosSe realizó un análisis de clúster por el método de conglomerados jerárquico en 2025 pacientes de la cohorte apnea-HUGU. Las variables utilizadas para la construcción de los clúster incluían datos generales, comorbilidad, síntomas de sueño, datos antropométricos, exploración física y resultados del estudio de sueño.
ResultadosSe identificaron 4 clúster: 1) varón joven sin comorbilidad con apnea moderada y alteraciones de la esfera otorrinolaringológica (ORL) 2) Varón de edad media con AOS muy grave sintomático con comorbilidad sin enfermedad cardiovascular desarrollada. 3) Mujer con alteraciones en el estado de ánimo 4) Varón sintomático con enfermedad cardiovascular establecida y AOS grave.
ConclusionesLa caracterización de estos cuatro clúster en la AOS puede ser determinante a la hora de identificar grupos de pacientes que comparten un especial riesgo o estrategias terapéuticas comunes orientándonos hacia la medicina personalizada y facilitando el diseño de futuros ensayos clínicos.
Obstructive sleep apnea (OSA) is a prevalent disease1,2 characterized by the presence of breathing pauses during the night, which is considered a public health problem due to its consequences.3,4 The severity of OSA is mainly described using the apnea–hypopnea index (AHI), which is the number of apneas and hypopneas recorded per hour of sleep.5 However, OSA is a very heterogeneous and complex disease6 that is not entirely well defined by this single parameter. Although at present, both the diagnosis and the classification of severity and treatment management of these patients are mostly determined by their AHI,7,8 the heterogeneity of the disease may explain the lack of response to treatment found in some clinical trials.9,10
In recent years, various approaches to better characterize patients with OSA have been developed through cluster analysis.11–17 This method allows studying the relationships present between groups of patients, selecting patients who are similar to each other but significantly different from others. However, to date, most approaches have provided partial results, including only patients with mild-moderate OSA11 or moderate-severe OSA,12,13,15 focusing exclusively on sleep characteristics,11 symptoms,12 comorbidities14,15 or response to treatment,16 or suffer from having a small sample size.17 In addition, it is particularly striking that none of the previous studies have considered a gender-based perspective in their approach. Although OSA is very prevalent in both sexes,18 some discrepancies remain about its gender predominance.19
Therefore, we feel that an integrated approach to improve the characterization of OSA should consider gender and should jointly evaluate sleep disturbances, symptoms and comorbidity associated with the disease. In this way, a more accurate estimate of the disease burden of the different subtypes identified could be obtained and, at a later stage, it would possibly allow accurate and adequate management directed at the individual needs of each patient.20 Therefore, our objective is the identification of OSA clusters based on a joint approach of the different characteristics that determine their disease burden.
Material and methodsStudy populationA population-based clinical cohort (apnea-HUGU) was selected consisting of 2454 patients consecutively referred to the University Hospital of Guadalajara for suspected OSA between November 2014 and March 2018. All patients>18 years diagnosed with OSA (AHI>5) by polygraphy or polysomnography studies before initiating any treatment for their sleep-related breathing disorder were included. Patients in whom the quality of the study was inadequate, the study outcome was negative, had Central Sleep Apnea (presence of more than 50% central apneas or the presence of Cheyne–Stokes respiration), or had an incomplete first-visit protocol sheet were excluded.
The study was approved by the Research Ethics Committee of the hospital (code: 2019.20.PR).
Sleep studyFollowing the recommendations of the Spanish Society of Pneumology and Thoracic Surgery (SEPAR) for the diagnostic of OSA,21 polygraphy (Embletta, ResMed, Bella Vista, NSW, Australia) or polysomnography (Grael, Compumedics Ltd, Melbourne, Vic, Australia) was performed. In 385 patients (19% of the total patients included) a polysomnography was performed. Coding of sleep phases, respiratory events and arousals were done manually following the guidelines of the American Academy of Sleep Medicine (AASM)22 (Appendix A).
Clinical dataThe reason for consultation, anthropometric characteristics, comorbidities and toxic habits were collected. As the main symptoms of sleep, the presence of snoring, feeling of nonrestorative sleep, episodes of nocturnal asphyxia, witnessed apneas, headache, fatigue, nocturnal awakenings, memory disorders, difficulty concentrating, irritability-apathy and sleepiness were systematically recorded using a 4-point Likert scale (always, frequently, sometimes or never). In turn, excessive daytime sleepiness (EDS) was assessed using the Epworth sleepiness scale (ESS)23 and the perceived general health quality using a visual analog scale. Information was also collected on sleep habits, other sleep disorders (restless leg syndrome, narcolepsy or insomnia, mainly) and regular medication. A complete physical exam was performed (Appendix A).
Statistical analysisFor the classification of the cases, crude variables were considered, without standardization. No imputation or other treatment of the missing values was performed. The analysis of the patients’ distribution by clusters according to the distribution of the variables was carried out by the hierarchical clustering method,24 using the Ward's agglomerative method and the squared Euclidean distance as the interval measure. The variables finally used for building the clusters were gender, age, BMI, arterial hypertension, diabetes, dyslipidemia, snoring, nonrestorative sleep, witnessed apnea, fatigue, ESS, night awakenings and AHI. Several cluster analyses were constructed, and the distribution profile of the common variables in each of the analyses was compared, evaluating the individual agreement in the assigned cluster group using Kappa statistics. To select the number of clusters, the interval was established by identifying the interactions of the method in which the agglomeration distances give great jumps. As stop rule to establish de final number, the sum of squares method was used, choosing the optimal number of cluster by minimizing the within-cluster sum of squares and maximizing the between-cluster sum of squares.
The results are presented as the mean±standard deviation or percentage, according to their nature and distribution. The fit of the quantitative variables to the normal distribution was graphically evaluated using the normal Q–Q plots and the Kolmogorov–Smirnov test. For comparisons between clusters, Fisher's exact tests were used for qualitative variables and ANOVA with post hoc analysis by Bonferroni test for quantitative variables.
The analyses were performed with SPSS version 20.0 (IMB SPSS Statistics, CA, USA) and the CRAN-Package FactoClass version 1.2.7 of R (R Foundation for Statistical Computing, Vienna, Austria). A value of p<0.05 was accepted as the level of significance.
ResultsThe initial data collection was performed on 2454 subjects and a total of 429 patients were excluded in whom the quality of the study was inadequate, the study result was negative, or had Central Sleep Apnea (presence of more than 50% central apneas or the presence of Cheyne–Stokes respiration). The general characteristics of the cohort of 2025 selected OSA patients are summarized in Table 1. In general, terms, our cohort is mainly characterized by being men of mean age (52±13 years) with a mean BMI of 28.8±10.7kg/m2, moderate-severe OSA (mean AHI 32.2±14.7h−1) and whose most frequent comorbidities are arterial hypertension (39.2%) and dyslipidemia (34.7%). The most reported symptoms were witnessed apneas and snoring.
General characteristics of the apnea-HUGUcohort.
| Sex, n (%) | |
| Women | 710 (35.1) |
| Men | 1315 (64.9) |
| Age, years | 52±13 |
| BMI, kg/m2 | 28.8±10.7 |
| Smoking, n (%) | |
| Current | 568 (28.1) |
| Former | 642 (31.8) |
| Never | 811 (40.1) |
| Comorbidities, n (%) | |
| Hypertension | 789 (39.2) |
| Diabetes | 345 (17.2) |
| Dyslipidemia | 694 (34.7) |
| Heart disease | 253 (12.7) |
| Depression | 375 (19.1) |
| Anxiety | 415 (21.1) |
| Neoplasia | 103 (5.1) |
| Sleep symptoms,n(%) | |
| Snoring | |
| Always | 1514 (75.4) |
| Frequently | 274 (13.6) |
| Sometimes | 140 (7.0) |
| No | 80 (4.0) |
| Nonrestorative sleep | |
| Always | 146 (7.3) |
| Frequently | 268 (13.3) |
| Sometimes | 627 (31.2) |
| No | 967 (48.2) |
| Apnea | |
| Always | 745 (37.6) |
| Frequently | 382 (19.3) |
| Sometimes | 286 (14.4) |
| No | 568 (28.7) |
| Fatigue | |
| Always | 675 (33.7) |
| Frequently | 429 (21.4) |
| Sometimes | 366 (18.3) |
| No | 533 (26.6) |
| Nocturnal awakenings | |
| Always | 180 (9.4) |
| Frequently | 388 (20.3) |
| Sometimes | 439 (23.0) |
| No | 900 (47.2) |
| Daytime sleepiness | |
| Always | 617 (30.7) |
| Frequently | 435 (21.6) |
| Sometimes | 368 (18.3) |
| No | 591 (29.4) |
| ESS | 11±5 |
| Sleep parameters | |
| AHI, h−1 | 32.2±24.7 |
| ODI, h−1 | 30.4±24.4 |
| SaO2 nocturnal mean, % | 91±5 |
| SaO2 nocturnal minimum, % | 78±11 |
| tSpO2<90%, % | 22.4±28.4 |
Abbreviations: BMI=body mass index; ESS=Epworth sleepiness scale; AHI=apnea–hypopnea index; ODI=oxygen desaturation index; tSpO2<90%, %=the percentage of time spent at SaO2 below 90%.
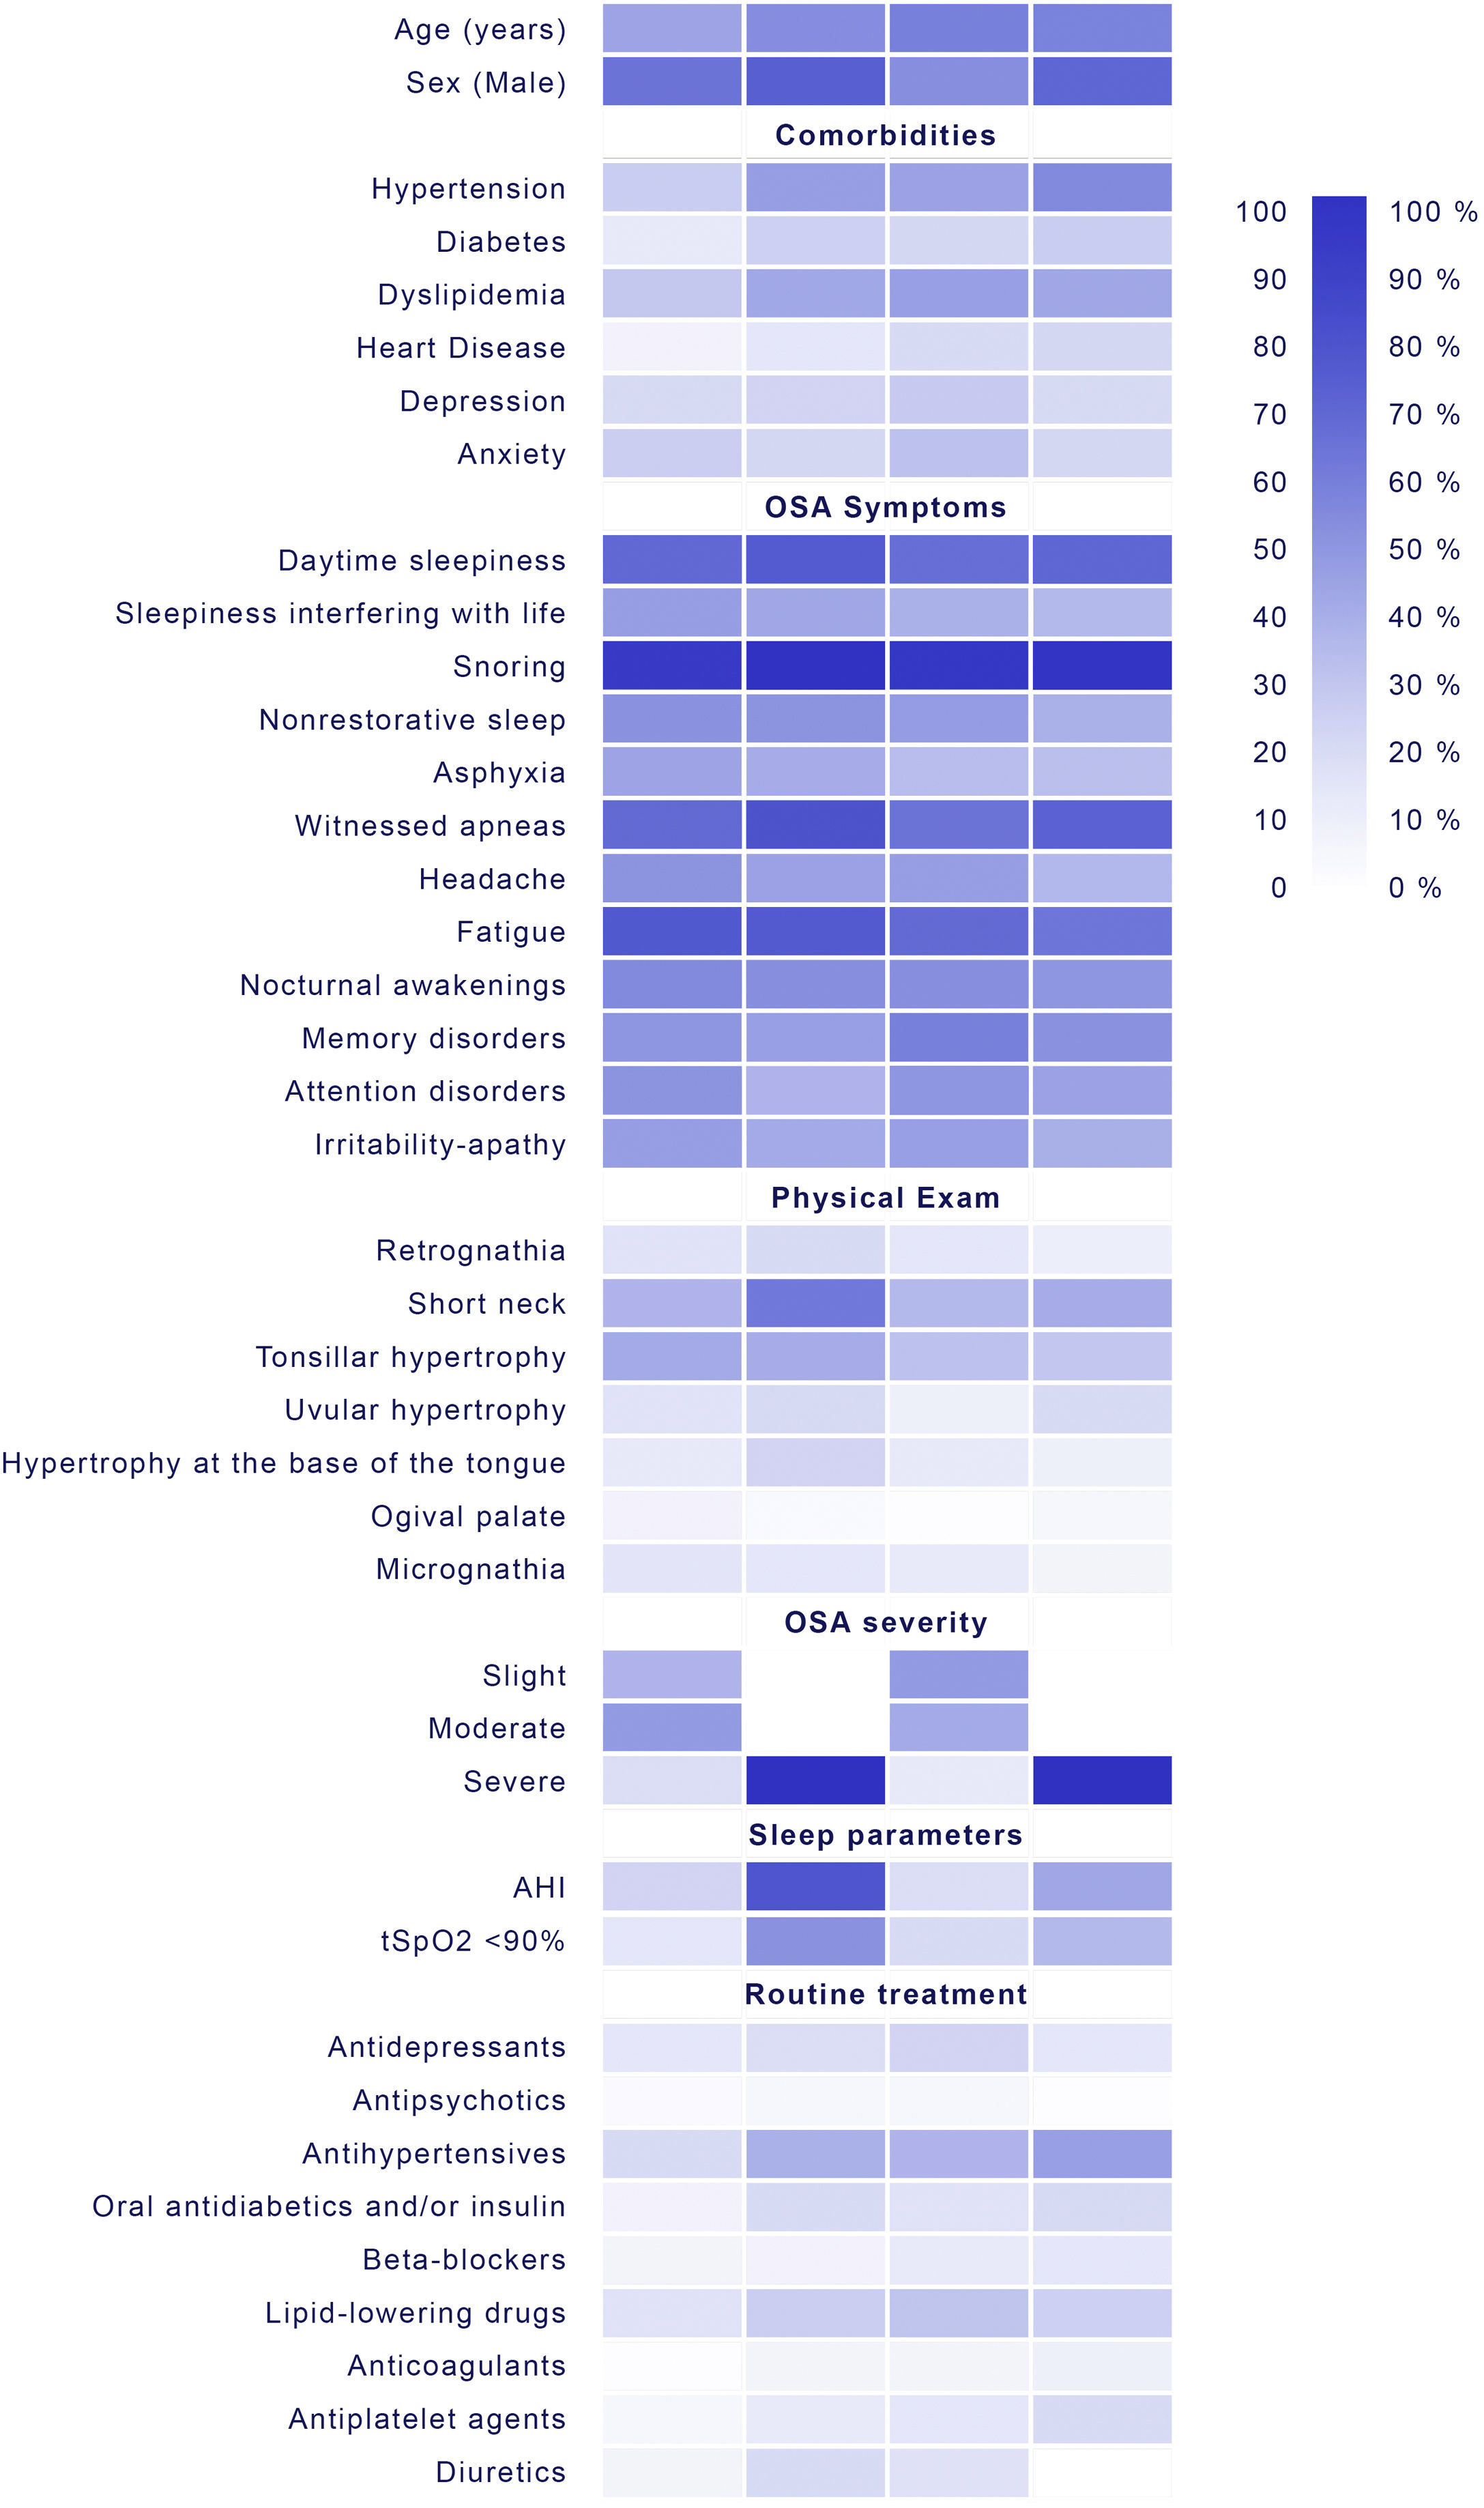
The selected cluster distribution assigned 1655 (81.7%) of the patients evaluated, not allowing the classification of 370 subjects due to missing data. According to the characteristics of the dendrogram, 4 clusters were finally selected (Fig. 1) based on the key symptoms of OSA, comorbidity, physical exam data and sleep study variables (Tables 2–4, Tables A-1 and A-2).

General characteristics and sleep parameters among patients assigned to the different clusters*
| Cluster 1(n=663) | Cluster 2(n=203) | Cluster 3(n=457) | Cluster 4(n=332) | p | |
|---|---|---|---|---|---|
| Sex | <0.001 | ||||
| Male, % | 65.6 | 76.4 | 51.9 | 72.3 | |
| Age, years | 42±9 | 53±11† | 60±10†‡ | 59±13†‡ | <0.001 |
| BMI, kg/m2 | 31.7±7.6 | 30.8±13.6 | 23.8±11.3†‡ | 30.7±5.0§ | <0.001 |
| Smoker | <0.001 | ||||
| Current, % | 35.3 | 29.1 | 22.1 | 24.7 | |
| Former, % | 24.1 | 37.9 | 37.2 | 36.4 | |
| Physical activity | 0.075 | ||||
| Sedentary | 49.7 | 59.9 | 48.9 | 50.4 | |
| Moderate | 21.9 | 23.2 | 26.7 | 26.3 | |
| Active | 28.3 | 16.9 | 24.3 | 23.2 | |
| Physical exam | |||||
| Retrognathia, % | 12.5 | 15.5 | 10.7 | 7.6 | 0.037 |
| Short neck, % | 34.3 | 62.8 | 32.2 | 37.9 | <0.001 |
| Tonsillar hypertrophy, % | 39.2 | 38.8 | 28.4 | 26.0 | 0.006 |
| Uvular hypertrophy, % | 12.8 | 17.2 | 7.5 | 16.3 | 0.001 |
| Hypertrophy at base of tongue, % | 10.0 | 19.0 | 9.9 | 7.5 | 0.029 |
| Nasal septum deviation, % | 10.7 | 8.8 | 6.1 | 11.3 | 0.315 |
| Mallampati | 2.1±1.0 | 2.6±1.1† | 2.3±1.1#$** | 2.3±1.0¶** | <0.001 |
| Ogival palate, % | 6.3 | 3.2 | 1.5 | 4.1 | 0.008 |
| Micrognathia, % | 11.9 | 11.4 | 9.4 | 5.7 | 0.029 |
| Polysomnographic study, % | 17.8 | 21.2 | 16.8 | 22.1 | 0.204 |
| Sleep parameters | |||||
| AHI, h−1 | 19.0±9.9 | 80.9±14.7† | 16.5±9.2†‡ | 49.3±9.7†‡§ | <0.001 |
| ODI, h−1 | 18.2±13.1 | 75.9±15.5† | 16.7±13.1‡ | 45.2±13.7†‡§ | <0.001 |
| SpO2 nocturnal mean, % | 92.5±1.5 | 87.3±5.5† | 91.9±2.9‡ | 89.8±5.1†‡§ | <0.001 |
| SpO2 nocturnal minimum, % | 81.9±8.2 | 66.3±11.1† | 81.6±8.5‡ | 73.6±11.6†‡§ | <0.001 |
| tSpO2<90%, % | 11.2±20.1 | 50.8±26.6† | 16.2±25.4¶‡ | 31.8±28.6†‡§ | <0.001 |
| Severe OSA, % | 14.6 | 100 | 10.1 | 100 | <0.001 |
Values are expressed as the mean±standard deviation or percentage.
Abbreviations: BMI=body mass index; AHI=apnea hypopnea index; ODI=oxygen desaturation index; SpO2=blood oxygen saturation; tSpO2<90%=time spent with SpO2<90%; OSA=obstructive sleep apnea.
Comparison between groups by the chi-square test or ANOVA with post hoc comparisons by the Bonferroni test:
Comparison vs. Cluster 1: † p<0.001; ¶ p<0.01; # p<0.05.
Comparison vs. Cluster 2: ‡ p<0.001; $ p<0.01; ** p<0.05.
Comparison vs. Cluster 3: § p<0.001.
Comparison of the reason for consultation and main clinical characteristics between patients assigned to the different clusters.*
| Cluster 1(n=663) | Cluster 2(n=203) | Cluster 3(n=457) | Cluster 4(n=332) | p | |
|---|---|---|---|---|---|
| Daytime sleepiness | 0.337 | ||||
| Always, % | 30.0 | 35.5 | 27.8 | 27.4 | |
| Frequent, % | 22.6 | 22.7 | 21.6 | 25.0 | |
| Sometimes% | 18.3 | 20.2 | 19.2 | 20.8 | |
| No, % | 29.0 | 21.7 | 31.5 | 26.8 | |
| Epworth scale | 10.8±5.1 | 11.5±5.2 | 10.2±5.0** | 10.5±5.0 | 0.014 |
| Snoring | 0.001 | ||||
| Always, % | 74.1 | 84.2 | 70.9 | 79.5 | |
| Frequent, % | 15.1 | 10.8 | 15.5 | 13.0 | |
| Sometimes% | 6.0 | 3.9 | 10.3 | 6.0 | |
| No, % | 4.7 | 1.0 | 3.3 | 1.5 | |
| Restorative sleep | 0.002 | ||||
| Always, % | 4.7 | 5.4 | 7.4 | 6.0 | |
| Frequent, % | 13.6 | 14.3 | 12.0 | 19.3 | |
| Sometimes% | 30.8 | 30.0 | 34.1 | 38.0 | |
| No, % | 51.0 | 50.2 | 46.4 | 36.7 | |
| Asphyxia | <0.001 | ||||
| Always, % | 8.5 | 11.3 | 6.1 | 5.7 | |
| Frequent, % | 8.0 | 3.4 | 5.7 | 6.0 | |
| Sometimes% | 25.4 | 23.2 | 18.2 | 17.2 | |
| No, % | 58.2 | 62.1 | 70.0 | 71.1 | |
| Apnea | <0.001 | ||||
| Always, % | 33.8 | 51.2 | 31.1 | 37.3 | |
| Frequent, % | 20.2 | 22.2 | 20.1 | 20.8 | |
| Sometimes% | 15.8 | 8.9 | 15.1 | 16.9 | |
| No, % | 30.2 | 17.7 | 33.7 | 25.0 | |
| Headache | <0.001 | ||||
| Always, % | 12.4 | 12.9 | 11.6 | 6.3 | |
| Frequent, % | 15.6 | 8.4 | 13.8 | 9.0 | |
| Sometimes% | 21.8 | 21.3 | 19.7 | 18.1 | |
| No, % | 50.3 | 57.4 | 54.9 | 66.6 | |
| Fatigue | <0.001 | ||||
| Always, % | 36.2 | 37.4 | 30.9 | 25.0 | |
| Frequent, % | 25.8 | 19.7 | 22.1 | 19.6 | |
| Sometimes% | 17.5 | 22.2 | 17.7 | 20.8 | |
| No, % | 20.4 | 20.7 | 29.3 | 34.6 | |
| Nocturnal awakenings | 0.131 | ||||
| Always, % | 8.1 | 8.4 | 9.0 | 12.3 | |
| Frequent, % | 20.4 | 21.2 | 23.0 | 16.0 | |
| Sometimes% | 26.7 | 22.7 | 20.6 | 21.1 | |
| No, % | 44.6 | 47.8 | 47.5 | 50.6 | |
| Memory disorders | 0.243 | ||||
| Always, % | 11.4 | 11.5 | 11.1 | 9.9 | |
| Frequent, % | 13.9 | 10.0 | 16.0 | 15.7 | |
| Sometimes% | 24.0 | 23.0 | 28.7 | 25.6 | |
| No, % | 50.5 | 55.5 | 44.1 | 48.8 | |
| Attention disorders | 0.017 | ||||
| Always, % | 5.5 | 4.7 | 7.3 | 3.8 | |
| Frequent, % | 16.2 | 10.4 | 16.0 | 17.5 | |
| Sometimes% | 28.2 | 19.3 | 26.1 | 21.7 | |
| No, % | 49.9 | 65.6 | 50.6 | 57.0 | |
| Irritability-apathy | 0.582 | ||||
| Always, % | 4.0 | 4.3 | 3.3 | 2.3 | |
| Frequent, % | 17.6 | 16.3 | 17.1 | 15.6 | |
| Sometimes% | 23.2 | 18.5 | 23.6 | 19.5 | |
| No, % | 55.0 | 60.9 | 56.1 | 62.5 | |
Comparison of comorbidities and concomitant treatments between patients assigned to different clusters*
| Cluster 1(n=663) | Cluster 2(n=203) | Cluster 3(n=457) | Cluster 4(n=332) | p | |
|---|---|---|---|---|---|
| Comorbidities | |||||
| Hypertension, % | 23.5 | 45.3 | 43.1 | 54.8 | <0.001 |
| Diabetes, % | 10.4 | 21.2 | 18.4 | 22.6 | <0.001 |
| Dyslipidemia, % | 24.9 | 39.9 | 43.8 | 40.7 | <0.001 |
| Heart disease, % | 5.9 | 11.3 | 15.6 | 18.3 | <0.001 |
| Respiratory disease, % | 9.8 | 10.3 | 12.9 | 11.2 | 0.038 |
| Depression, % | 17.4 | 19.2 | 24.2 | 17.3 | 0.033 |
| Anxiety, % | 21.6 | 17.7 | 27.7 | 18.2 | 0.005 |
| Neurological disease, % | 7.9 | 2.5 | 10.8 | 12 | <0.001 |
| Neoplasia, % | 3.3 | 5.9 | 6.4 | 4.9 | 0.084 |
| Routine treatment | |||||
| Opioids, % | 3.8 | 3.0 | 5.5 | 5.1 | 0.322 |
| Benzodiazepines, % | 10.4 | 9.4 | 16.7 | 11.2 | 0.005 |
| Corticosteroids, % | 0.5 | 2.0 | 1.1 | 2.4 | 0.043 |
| Antiepileptics, % | 2.3 | 2.5 | 2.4 | 1.8 | 0.856 |
| Antidepressants, % | 11.5 | 15.3 | 19.2 | 11.4 | 0.001 |
| Antipsychotics, % | 1.4 | 3.4 | 3.5 | 0.6 | 0.007 |
| NSAIDs, % | 3.8 | 4.4 | 5.9 | 6.3 | 0.320 |
| Antihypertensives, % | 16.2 | 35.5 | 34.0 | 43.7 | <0.001 |
| Oral antidiabetics and/or insulin, % | 5.9 | 16.3 | 13.4 | 17.2 | <0.001 |
| Beta-blockers, % | 4.8 | 5.9 | 8.4 | 10.5 | 0.005 |
| Lipid-lowering drugs, % | 13.4 | 22.2 | 27.2 | 31.0 | <0.001 |
| Anticoagulants, % | 0.6 | 4.9 | 4.6 | 6.6 | <0.001 |
| Antiplatelet agents, % | 3.5 | 8.4 | 11.2 | 15.7 | <0.001 |
| Diuretics, % | 5.1 | 16.3 | 14.0 | 22.3 | <0.001 |
| Thyroid hormones, % | 7.7 | 11.3 | 9.2 | 4.2 | 0.021 |
| Bronchodilators, % | 4.4 | 3.5 | 6.0 | 6.4 | 0.431 |
Cluster 1 (n=663 patients 32.7% of the cohort) “young obese male without comorbidity with moderate OSA and ORL malformations”. Characterized by having a predominance of males (65%), young (mean age: 42±9 years), in which the most frequent reason for consultation was snoring and witnessed apnea. Actively working and in which the symptoms have a significant impact on their daily activities and driving. They present a low comorbidity associated with the other clusters, with lower consumption of drugs in general terms. The symptoms of fatigue (79.5%), concentrating (50%), decreased libido (19%), insomnia (9.5%) and absence of nocturia stand out. They present a predominance of malformations in ORL exam, with frequent presence of tonsillar hypertrophy (39.2%), septal deviation (10.7%) and ogival palate (6.3%). In terms of the severity of OSA, they present moderate apnea (AHI 19.0±9.9) with less oxymetric impact than the rest of the cluster (Oxygen desaturation index (ODI) 18.2±13.1h−1; CT90 (percentage of time spent at SaO2 below 90%) 11.2±20.1%; mean saturation 92.5±1.5%; minimum saturation 81.9±8.2%).
Cluster 2 (n=203 patients 10.0% of the cohort) “middle-aged obese male with very severe OSA symptomatic with comorbidity without developed cardiovascular disease”. Characterized by a predominance of males (76%) of mean age (53±11years) referred for sleepiness and witnessed apneas. They present frequent associated comorbidities as risk factors but without developing cardiovascular disease. The cluster with the highest frequency of EDS (78.4%) and witnessed apneas (only 17.7% never presented them). The short neck (62.8%), retrognathia (15.5%), uvular hypertrophy (17.2%) and hypertrophy at base of tongue (19%) on ORL exam stand out. In the sleep study, they presented very severe apnea (100%) (AHI; 80.9±14.7) and very significant oximetric impact (ODI 75.9±15.5; CT90 50.8±26.6; Mean saturation 87.3±5.5; Minimum saturation 66, 3±11.1).
Cluster 3 (n=457 patients 22.6% of the cohort) “non-obese woman with mooddisorders” This is the cluster with the highest representation of the female gender (48%), of mean age (60±10 years) referred to consultation for snoring and sleep apnea. In relation to the associated comorbidity, the presence of depression and anxiety stands out (24.2% and 27.7%) and the use of antidepressant and anxiolytic medication in relation to the rest of the cluster (5.5% consumed opioids, 16.7% benzodiazepines, 19.2% antidepressants and 3.5% antipsychotics). Taking into account the symptoms, it is the cluster with the lowest presence of snoring (70.9% declare snoring “always”) and witnessed apnea (66.3%) and most frequently denies EDS (31.5%). The latter is infrequent and interferes with their daily activities (35.8%) or driving (20.5%), being the cluster with a lower percentage of traffic accidents due to EDS (14.9%). In relation to the physical exam, the absence of obesity (BMI 23.8±11.3) stands out, with significant differences from the other three clusters. It is the cluster with the lowest clinical probability of suffering OSA according to the specialist who evaluates the patient for their first consultation (27.5% have a low probability of OSA prior to conducting the sleep study). In relation to the results of the sleep study, moderate apnea predominates (AHI: 16.5±9.2) without oximetric impact (ODI 16.7±13.1; CT90 16.2±25.4; Mean saturation 91.9±2, 9; minimum saturation 81.6±8.5), with a low frequency of severe OSA (10.1%).
Cluster 4 (n=332 patients, 16.4% of the cohort) “Symptomatic obese male with established cardiovascular disease and severe OSA”. Middle-age (59±13years) male (72.3%) referred for EDS and witnessed apnea. Major comorbidity was associated with the development of cardiovascular disease (18.3%) and with frequent use of cardiovascular medication (43.7% took antihypertensive, 17.2% oral antidiabetics and/or insulin, 10.5% beta-blockers, 31% lipid-lowering, 6.6% anticoagulant, 15.7% antiplatelet and 22.3% diuretic). In relation to the symptoms, they present EDS, but with little impact on their daily life (32.3%). With respect to the results of the sleep study, these are patients with severe OSA (49.3±9.7) but without as much oximetric impact as cluster 2 (ODI 45.2±13.7; CT90 31.8±28.6; mean saturation 89.8±5.1; minimum saturation 73.6±11.6).
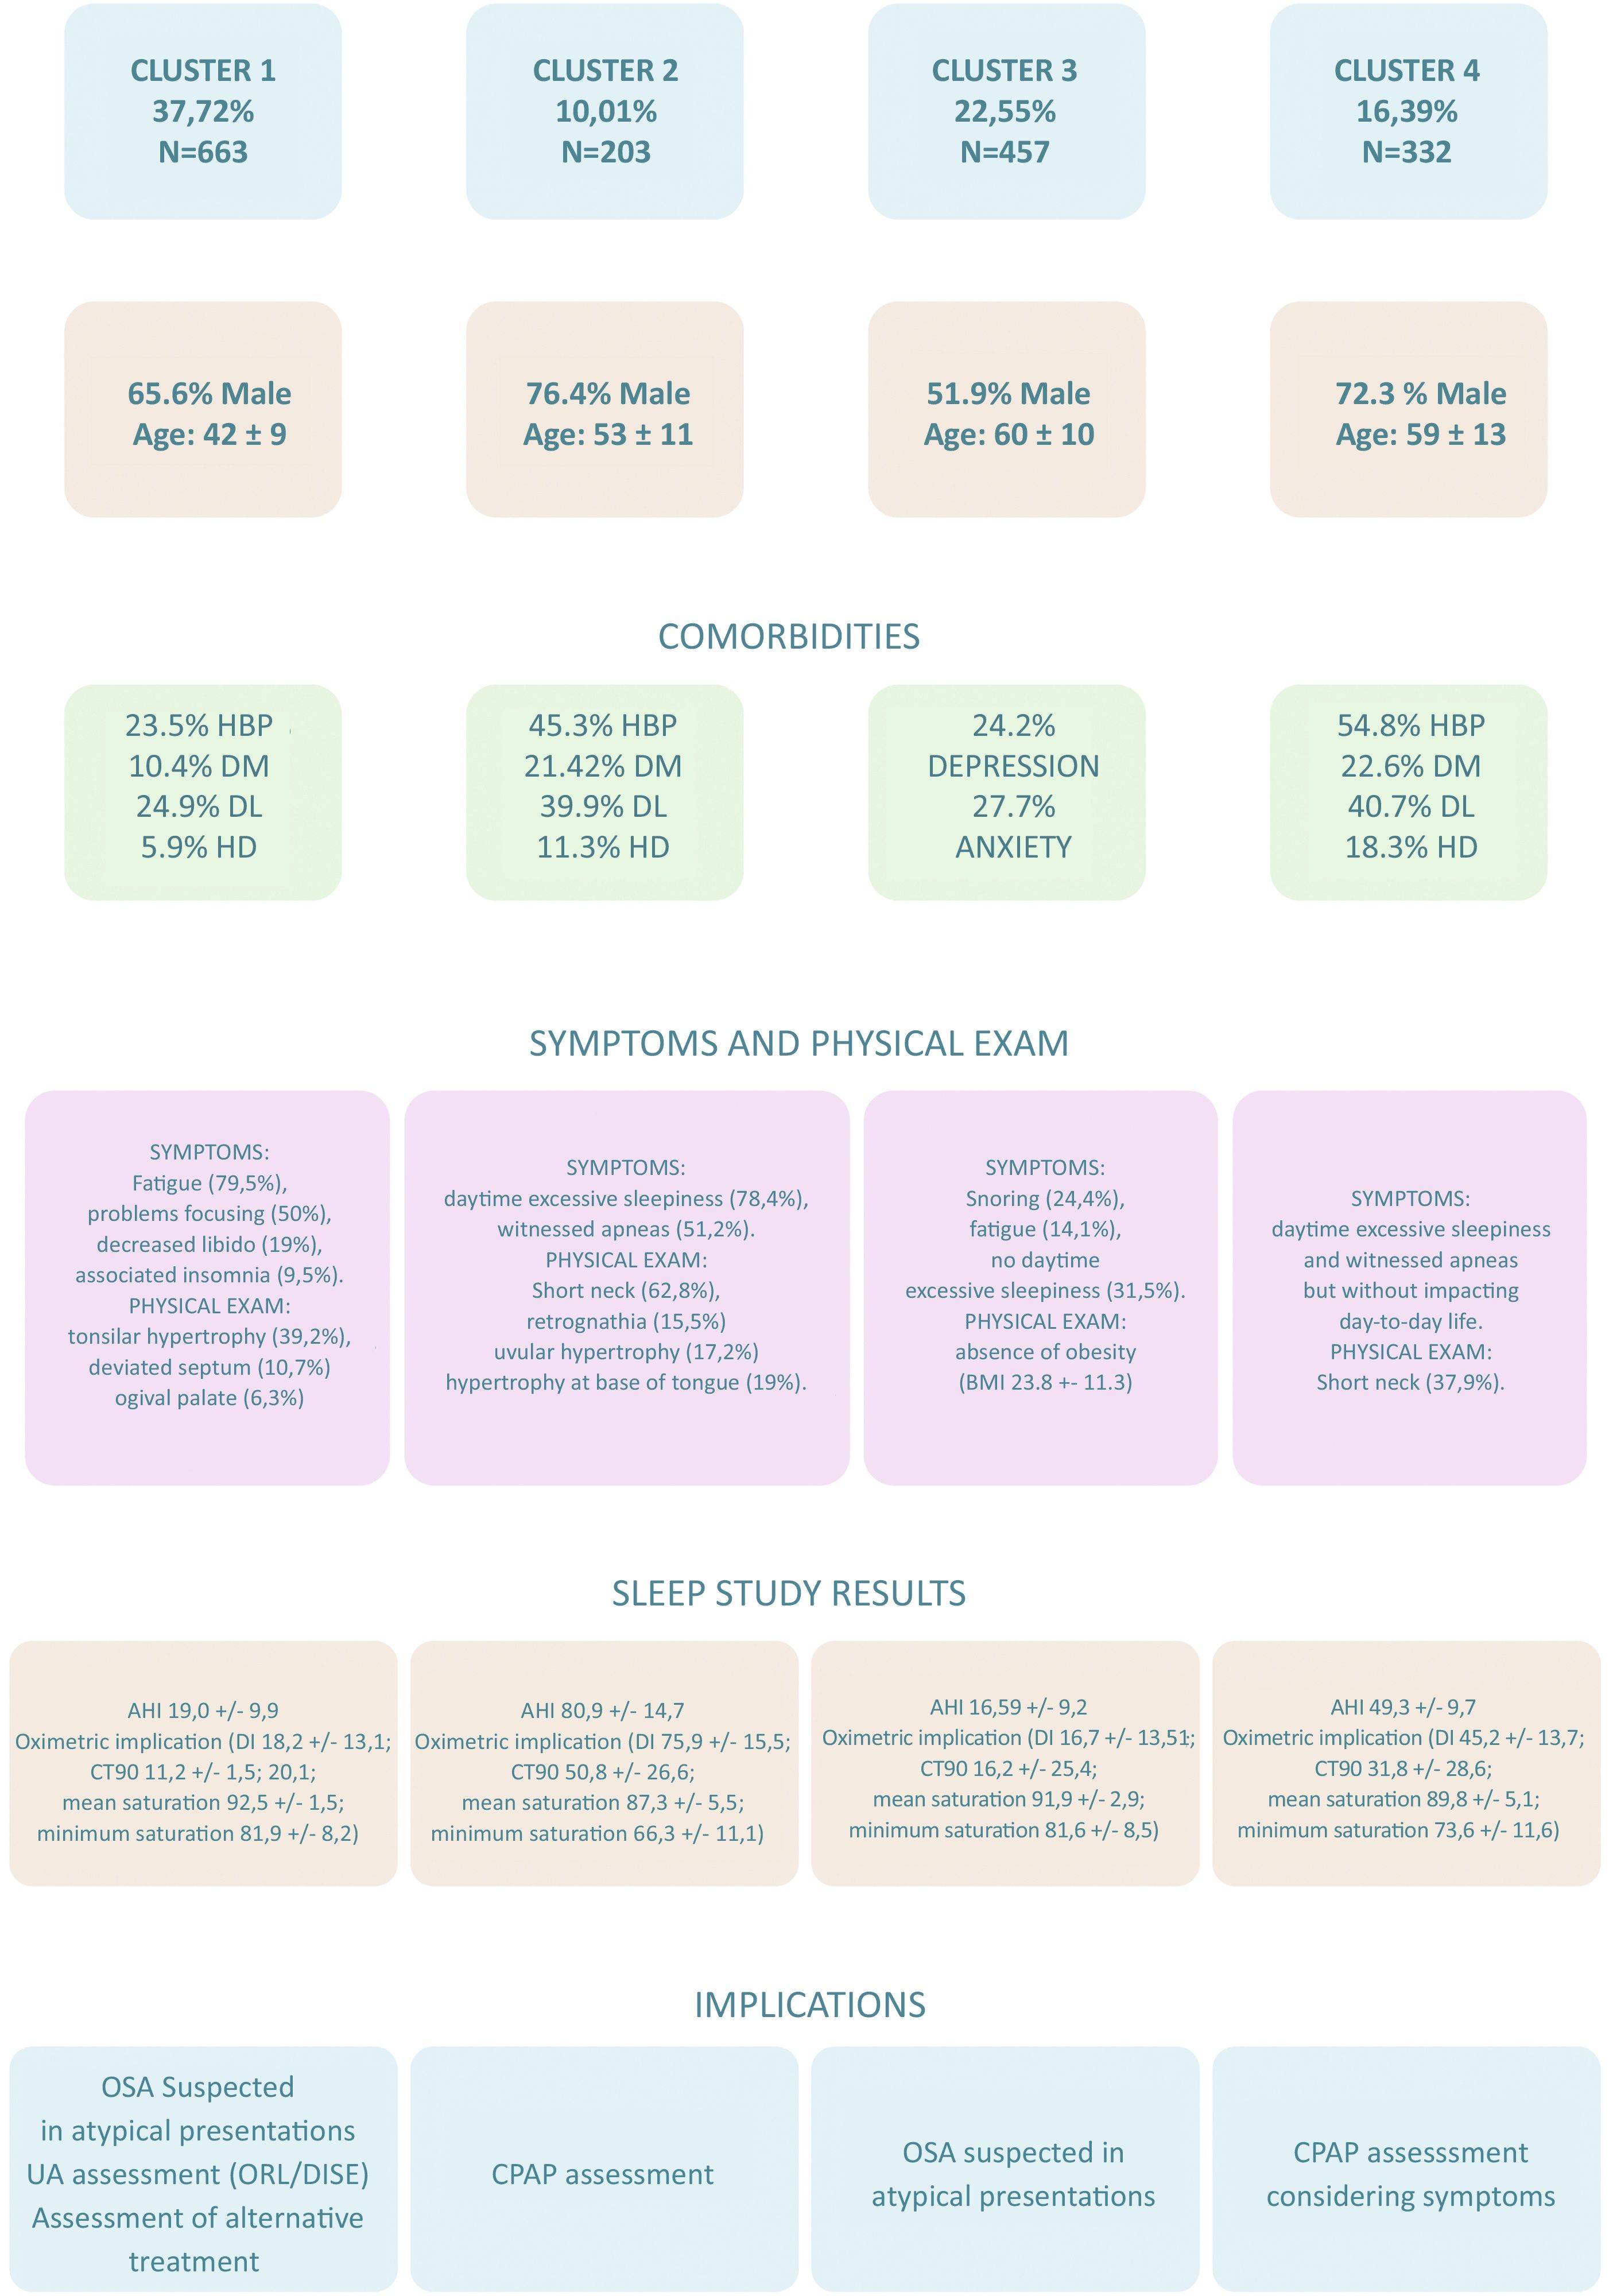
These 4 clusters are represented in Fig. 2.
Discussion
The main finding of our study is the identification of four OSA subtypes, with a predominance of males in three of them (young males with moderate OSA and ORL disorders, adults with severe symptomatic OSA without cardiovascular disease, and older adults with severe OSA and cardiovascular disease) and a fourth with the percentage of female was significantly higher (with mood disorders). These different phenotypes could have implications in diagnosis, treatment and prognosis of OSA patients, but validation of these cluster and more research to establish them in the clinical practice are needed.
OSA presents a clinical spectrum that far exceeds the classic image of the obese and sleepy male patient. Precision medicine aims to delineate the best treatment as dictated by the needs of individual patients and is based on the unique characteristics that distinguish any given patient from others; tools have emerged for other chronic respiratory diseases that allow the realistic application of precision medicine to clinical practice. These tools can and should be adapted and incorporated into the diagnosis and management of OSA.
To date, the heterogeneity of OSA has not been formally characterized from a practical point of view, which is one of the main challenges.25–29 Although the identification of different clusters or clinical phenotypes has led to tangible improvements in diseases such as COPD30,31 or asthma,32 it is necessary to expand our knowledge by improving the identification of the relevant characteristics used for the phenotype,6 acknowledging that clinical phenotypes are only an approximation of a clinical approach that should be focused on patient-centered management.
Additionally, OSA is a chronic disease associated with increased cardiovascular disease33–35 and mortality risks in general.36 Understanding these patterns of clinical presentation is extremely important, given their possible impact on identifying the type of patient and on prognostic and therapeutic prediction. In line with other recent studies,12,17 our study contributes to the identification of subgroups of patients with OSA through the analysis of clusters, but unlike previous studies, our analysis does not focus exclusively on the key symptoms of OSA, but includes a large number of variables related to the clinical history, detailed physical exam, comorbidities (including anxiety and depression), risk factors, concomitant medication and sleep parameters in a broad cohort. On the other hand, our cohort covers the entire spectrum of OSA severity and does not focus exclusively on those with AHI>15, also including a higher percentage of women than the rest of the studies. While the population of our cohort is predominantly male, as in the cluster studies conducted by Vavougios et al., 83.9%14 and Ye et al., 81%,12 the percentage of women in our study was significantly higher (35.1%).
These variables can help to identify each of the clusters in a more personalized way, accurately and more comprehensively predicting the response to treatment and the prognostic evolution.
The clusters identified in our cluster analysis represent the presence of different patterns of clinical presentation of OSA, with could have important diagnostic implications: clusters 1 and 3, which together constituted more than half of the sample, were less likely to present clinically significant EDS and more likely to present fatigue and depression, respectively. Although the majority of individuals in clusters 1 and 3 reported the presence of other classic symptoms of OSA, such as breathing pauses and snoring that disturbed the sleep of their partners, they were less likely to do so than patients in clusters 2 and 4. Similar results were reported by Ye et al.12 These results support the theory that there are patients with OSA who may be less symptomatic or may not present the typical symptoms and have less chance of being referred and/or diagnosed, although these atypical symptoms have a clear impact on day-to-day life of these patients, as demonstrated in cluster 1. The characterization of these two clusters could have a direct implication in improving the underdiagnosis of OSA, helping suspicion of the disease in these specific groups even in the absence of typical symptoms (especially in youth and women). In this regard, the importance of depressive symptoms in women, which lead to greater consumption of anxiolytics and antidepressants in this group, should be highlighted. The analysis by classification of clinical phenotypes in a European cohort (ESADA)37 of 6.555 adult patients with OSA supports our results, emphasizing that OSA can occur in a wide range of “nontraditional” presentations such as insomnia. Phenotypes with symptoms of insomnia comprised more than half of patients with OSA and were more frequently related to comorbidity (cardiovascular, pulmonary and psychiatric) than those with ESD, despite suffering a less severe OSA. The identification of such differences in phenotypes can lead to an improvement in clinical practice by recognizing and adapting the treatment to the specific phenotype. This could suggest that adherence to continuous positive airway pressure (CPAP) therapy could be influenced or even predicted by the phenotype of clinical presentation.38
In this regard, the clinical phenotypes identified in our study could alone capture the relevance of therapeutic management of the disease. The results highlight the importance of considering the initial clinical presentation for a more accurate response to treatment within a given patient and not depending only on the typical symptoms of OSA and AHI, translating a clear applicability in the general population (Fig. 3): Cluster 1 “young obese male without comorbidity with moderate apnea and ORL malformations” with frequent presence of tonsillar hypertrophy (39.2%), septal deviation (10.7%) and ogival palate (6.3%) shows a clear therapeutic implication, being able to benefit from personalized surgical treatment. In this group, therefore, it may be more cost-effective to be referred to the ORL, evaluating the performance of drug induced sleep endoscopy (DISE) or assessing the possibility of a mandibular advancement device (no CPAP therapy), since it can treat, in most cases, moderate OSA with little oximetric impact.39 The identification of this cluster shows the importance of ORL malformations in the development of OSA, although their severity does not increase (probably due to being detected in earlier stages of the disease). Cluster 2, which represents the classic OSA pattern “middle-aged obese male with very severe OSA symptomatic with comorbidity without developed cardiovasculardisease”, may benefit from starting treatment with CPAP. This could have prognostic implication, since the detection of patients with cardiovascular risk factors but without established disease could prevent a first-time cardio or cerebrovascular event. Cluster 3 “non-obese woman with mood disorders” has diagnostic implication, since it would allow establishing a diagnostic suspicion in a group of patients without classic symptoms of OSA,40 but which may also require a specific psychological approach to the disease. It is a population that does not present obesity, and therefore, an intervention on diet/weight loss will not have a great impact. The absence of obesity together with the atypical symptoms may explain the underdiagnosis of OSA in women. This finding is remarkable when compared with previous findings,16 where atypical symptoms are related to obese female OSA.

Main clinical characteristics, comorbidities, symptoms of physical exam and sleep study results of patients assigned to the different clusters and their implication in the management of OSA. HBP=high blood pressure; DM=diabetes mellitus; DL=dyslipidemia; HD=heart disease BMI=body mass index; AHI=apnea–hypopnea index; DI=desaturation index; CT90=the percentage of time spent at SaO2 below 90%; OSA=obstructive sleep apnea; UA=upper airway; ORL=otorhinolaryngology; DISE=drug induced sleep endoscopy; CPAP=continuous positive airway pressure.
Cluster 4 “Symptomatic obese male with established cardiovascular disease and severeapnea” in which the possibility of starting treatment with CPAP should be evaluated based on their symptoms, since it has been shown that the presence of established cardiovascular disease could neutralize the effect of CPAP in the prevention of the appearance of new events.9,10 In addition, the age difference between clusters 2 and 4 suggests the need for a longer exposure time to develop cardiovascular comorbidity.
Identifying distinct clinical profiles of OSA creates a foundation for offering more personalized therapies in the future. A future validation of these clusters is needed before using them in clinical practice. Follow-up studies are needed to describe the applicability of these clusters to clinical practices, and examine whether the response to treatment differs among OSA patients with distinct patterns of clinical presentations, particularly in terms of changes in symptom presentation, blood pressure and cardiovascular comorbidities. Also, it is completely unknown whether this classification will work in other similar populations of patients.
Despite the unique aspects of our manuscript, we recognize some limitations. This is a retrospective study in a single center, although it should be noted that our results are based on a database with minimal bias and with a very precise methodology. Second, 370 patients (18.3% of the analyzed subjects) were not assigned to any cluster because cases with missing data were excluded from the hierarchical clustering method. Although this may limit the external validity of our study, a complete case analysis was performed assuming that the cases with missing data have essentially the same characteristics as the cases with complete data because the methodology and clinical protocols were common in all patients. Third, by following the routine clinical practice, polysomnography has not been performed on all subjects, so the sleep structure has not been considered in our analysis. Also polygraphy leads to AHI lower than those obtained by polysomnography. This fact, together with the selection by the physicians of the diagnostic method based on the clinical characteristics of the patient, could have affected the results of the analysis. Fourth, we still do not have long-term information on the response to treatment of each of the clusters. Another limitation to consider is the collection of alterations in the cognitive area using a non-validated scale. However, we believe that our study presents the strength of representing routine clinical practice and that it has potential clinical relevance, since the different clinical profiles of OSA identified allow a more personalized therapeutic approach.
ConclusionsOur findings suggest that the identification of clinical presentations based on combinations of symptoms, physical exam and comorbidities can more fully capture the spectrum of OSA heterogeneity. This characterization may have implications for the identification of prognostic factors and therapeutic strategies and may be useful for the design of clinical trials to improve their success. Future studies are required to explore the mechanisms underlying the different clinical phenotypes, including genotypic differences associated with different clinical presentations.
Authors’ contributionsThe individual contributions of each author are as follows: O.M. and S.R.-P. conceived the study design. S.R.-P., P.R.B., E.V.A., R.S., J.C. and J.F.F. were responsible for data collection. F.G.R. conducted the statistical analyses; F.G.R. assured quality control and verified the analyses. S.R.P. and O.M. had full access to the data and contributed in finalizing the study design and the interpretation of the results. O.M., J.L.I., S.R.-P. undertook the initial draft. O.M., S.R.P., J.L.I. and F.G.R. participated in writing, review and editing the manuscript and approving the final version, review and reviser for important intellectual content including the decision to submit the final version of the paper.
Guarantor statementSofía Romero Peralta (S.R.P.) is the guarantor of the content of the manuscript, including the data and analysis.
Conflict of interestRomero-Peralta S. has no conflicts of interest to disclose. García-Rio F. has no conflicts of interest to disclose. Resano Barrio P. has no conflicts of interest to disclose. Viejo-Ayuso E. has no conflicts of interest to disclose. Izquierdo J.L. reports personal fees from ASTRA ZENECA, personal fees from BAYER, personal fees from BOEHRINGER INGELHEIM, personal fees from CHIESI, personal fees from GSK, personal fees from GRIFOLS, personal fees from MENARINI, personal fees from NOVARTIS, personal fees from ORION, personal fees from PFIZER, personal fees from SANDOZ, personal fees from TEVA, during the conduct of the study. Sabroso R. has no conflicts of interest to disclose. Castelao J has no conflicts of interest to disclose. Fernández Francés J has no conflicts of interest to disclose. Mediano O. has no conflicts of interest to disclose.
The following are the supplementary data to this article:


