

Tissue hypoxia stimulates the production of erythropoietin (EPO), the main effect of which is, in turn, to stimulate erythropoiesis. Sleep apnea–hypopnea syndrome (SAHS) is an entity characterized by repeated episodes of hypoxemia during sleep.
ObjectiveTo analyze whether hypoxemia stimulated increased urinary excretion of EPO, and if so, to evaluate if treatment with continuous positive airway pressure (CPAP) can inhibit this phenomenon.
MethodsWe studied 25 subjects with suspected SAHS who underwent a polysomnography study (PSG). EPO levels in first morning urine (uEPO) and blood creatinine and hemoglobin were determined in all patients. Patients with severe SAHS repeated the same determinations after CPAP treatment.
ResultsTwelve subjects were diagnosed with severe SAHS (mean±SD, AHI 53.1±22.7). Creatinine and hemoglobin levels were normal in all subjects. uEPO was 4 times higher in the SAHS group than in the control group (1.32±0.83 vs 0.32±0.35 UI/l, P<.002). CPAP treatment reduced uEPO to 0.61±0.9UI/l (P<.02), levels close to those observed in healthy subjects. No dose–response relationship was observed between severity of PSG changes and uEPO values.
ConclusionsPatients with severe SAHS show increased uEPO excretion, but this normalizes after treatment with CPAP.
La hipoxia tisular estimula la producción de eritropoyetina (EPO) que tiene como principal función estimular la eritropoyesis. El SAHS es una entidad caracterizada por la presencia de episodios repetidos de hipoxemia durante el sueño.
ObjetivoAnalizar si dicha hipoxemia es un estímulo suficiente para incrementar la excreción urinaria de EPO. Si la respuesta fuera positiva, valorar si el tratamiento con presión continua positiva de la vía aérea (CPAP) la inhibiría.
MétodosSe han estudiado 25 sujetos con sospecha de SAHS, a los que se les realizó un estudio polisomnográfico. En todos ellos se determinaron los niveles de EPO en la primera orina de la mañana (uEPO), así como los niveles de creatinina y hemoglobina en sangre. En los pacientes con SAHS grave se repitieron las mismas determinaciones tras el tratamiento con CPAP.
ResultadosDoce sujetos fueron diagnosticados de SAHS grave (media ± SD, IAH de 53,1 ± 22,7). La creatinina y la hemoglobina fueron normales en todos los sujetos. La uEPO fue cuatro veces superior en el grupo SAHS respecto a los controles (1,32 ± 0,83 vs 0,32 ± 0,35IU/l, p < 0,002). El tratamiento con CPAP descendió la uEPO hasta 0,61 ± 0,49IU/l (p < 0,02), acercándose al valor de los sujetos sanos. No se observó una relación dosis-respuesta entre la gravedad de las alteraciones de la PSG y los valores de uEPO.
ConclusionesLos pacientes con SAHS grave muestran un incremento en su excreción de uEPO, que se normaliza tras el tratamiento con CPAP.
Sleep apnea–hypopnea syndrome (SAHS) is a very common disease among adults.1 It is characterized by multiple and repeated episodes of upper airway obstruction that cause sleep disruption, microarousals, hypoxemia, and hypercapnia of variable duration and intensity during sleep.2 Its impact on sleep quality, health-related quality of life, daytime sleepiness, and cardiovascular morbidity and mortality have been widely studied.2 However, few attempts have been made to understand the impact of intermittent hypoxemia associated with SAHS on erythropoiesis, and results in general have been divergent.
Human erythropoietin (EPO) is a 30.4kDa glycoprotein hormone composed of a single 165 amino acid residues chain to which four glycans are attached. The kidneys are the main source of EPO, but its messenger RNA (mRNA) has also been detected in the liver, spleen, bone marrow, lung and brain. Circulating levels of EPO increase exponentially with the decline of partial pressure and the levels of oxygen in tissue (PtiO2 and CtiO2, respectively), which in turn depend on local blood flow, hemoglobin (Hb) concentration, partial pressure of oxygen in arterial blood (PaO2), and Hb–O2 affinity. However, PtiO2 and CtiO2 in the renal cortex are less affected by changes in blood flow than other organs; the renal cortex then is very appropriate for regulating EPO production.
In the bone marrow, EPO promotes the survival, proliferation and differentiation of nucleated red blood cells, particularly colony-forming units. Following a rise in plasma EPO it takes around 4 days before reticulocytosis becomes apparent. The hormone is metabolized in the liver and eliminated via the urine.3
Several studies have attempted to show that the intermittent episodes of hypoxia typical of SAHS stimulate EPO production, but results have been inconsistent. Cahan et al. showed that EPO levels rise in plasma during the day4 in patients with SAHS and hypoxemia. They subsequently found that treatment with CPAP could normalize this effect.5 Other authors have reported similar results, but only in severe SAHS, as opposed to mild–moderate disease,6 while others reported minor increases in EPO.7 These results, however, could not be reproduced by authors such as Mckeon et al.,8 Pokala et al.,9 Ryan et al.,10 and Ciftici et al.11
Recently, Zhang et al.12 attempted to clarify these partial and contradictory results with a meta-analysis of 9 studies and 407 patients in whom plasma EPO had been evaluated. They concluded that plasma EPO is significantly higher in patients with SAHS than in normal individuals. They also determined that among the SAHS group, plasma EPO is higher in patients with cardiovascular complications, and, surprisingly, in patients with a body mass index <30.
Given the confusion surrounding the effect of SAHS on plasma EPO levels, we hypothesized that EPO levels in urine (uEPO) may be a more sensitive marker than EPO in plasma, particularly if the analysis is performed on first morning urine, in which at least part of the night's excretion is concentrated. This hypothesis is based on three considerations: (1) EPO is excreted in urine,3 (2) peak production occurs in the early hours of the morning,4 and (3) the hypoxic stimulus of SAHS occurs during the night.
The main objective of this study was to determine if SAHS is a sufficient stimulus to increase uEPO concentrations in first morning urine. Our secondary objective, provided the first objective was met, was to determine if eliminating the hypoxic stimulus of SAHS with CPAP therapy could reduce the morning concentration of uEPO.
Materials and MethodsPatients referred to the Multidisciplinary Sleep Disorder Unit of our hospital with suspected SAHS were recruited consecutively. The study was approved by the local Clinical Research Ethics Committee, and all subjects signed informed consent. Clinical, demographic and anthropometric measurements were obtained at the time of the polysomnography (PSG) study, which was carried out in all study participants. Patients with low oxygen saturation at rest (SatO2 ≤92%) due to any underlying pathology, SAHS patients who were not candidates for CPAP, and patients with kidney or liver diseases were excluded from the study.
DesignThe study involved an initial observational phase, followed by a second interventional phase. In the first phase, participants were divided into two groups depending on PSG results: controls (n=13) and patients with severe SAHS (n=12). In accordance with our secondary objective, all individuals with severe SAHS were candidates for CPAP. After 3–6 months of treatment, they were re-evaluated for the second study phase.
Sleep StudySAHS was evaluated by medical staff specializing in sleep disorders, using the Epworth sleepiness test13 and results of a PSG. The PSG included electroencephalogram, electro-oculogram, electromyogram, electrocardiogram, chest and abdominal movements, oronasal flow, pulse oximetry, leg movements, and body position (eXea Series 5, Bitmed, Zaragoza, Spain).
Mean obstructive apneas and hypopneas per hour were defined according to the Apnea–Hypopnea Index (AHI), and mean desaturations (reduction ≥3%) per hour were defined according to the desaturation index (DI). The percentage of time with SatO2 below 90% was defined using CT90%. SAHS diagnosis was established in patients with AHI >10, and classified as severe in those with AHI >30. The SAHS patient group received auto-titrating CPAP (Autoset S9 with ResScan software, ResMed, San Diego, USA) to determine optimal pressure. Residual AHI was determined during auto-titration.
Determination of Urinary ErythropoietinUEPO was quantified using a commercially available EPO ELISA kit (STEMCELL Technologies, Vancouver, Canada). The kit, initially developed for serum samples, was adapted according to the manufacturer's instructions for use with urine samples. Fifteen ml samples were concentrated 10-fold before quantification by ultrafiltration (molecular weight cut-off [MWCO] 30kDa). The calibration curve was also appropriately diluted in phosphate buffered saline (PBS) and processed using the same ultrafiltration procedure.
Ultrafiltration was performed using the Amicon Ultra-15 (Merck Millipore, Darmstadt, Germany), with a 30kDa MWCO. The sample was activated with 15ml Milli-Q water and centrifuged at 4000×g for 1–2min at 20°C. Tris–HCl 3.75M at pH 7.4 (1.5ml) and Complete Protease Inhibitor Cocktail (300μl) (Sigma–Aldrich, St. Louis, USA) were added to all samples. These were then gently shaken and subjected to ultrasound for 5min to facilitate passage through the filtration device, and centrifuged at 4000×g for 15min at 20°C. The supernatant was filtered under vacuum through a 0.22μm Steriflip device (Merck Millipore, Darmstadt, Germany).
The filtrate from each sample was transferred to the above-mentioned activated device. The resulting filtrate was washed twice with 15ml of Tris–HCl 50mM buffer at pH 7.4 supplemented with 300μl Complete™ and centrifuged at 4000×g for 25min at 20°C until approximately 200μl were obtained. This was then transferred to a new Eppendorf tube and stored at −20°C until the time of EPO analysis.
Following the instructions of the manufacturer of the ELISA kit, samples were diluted 10-fold with the supplied buffer B before they were placed on the anti-EPO microwell plate. Assay samples that showed out-of-range absorbance values underwent an additional dilution with buffer B, and were reanalyzed along with the reference samples. Intra- and inter-assay coefficients of variation were <15%. Data were analyzed automatically using MyAssays software (MyAssays Ltd., Brighton, East Sussex, United Kingdom).
Statistical AnalysisValues are expressed as mean±standard deviation. Clinical differences between the 3 groups were analyzed using the Student's t-test, Mann–Whitney U test, Chi-square test, or Fisher's exact test, as appropriate. Correlations between AHI, DI, CT90%, mean SatO2, minimum SatO2, and uEPO levels were measured by the Spearman correlation test. All statistical tests were considered significant at a P value of <.05. We calculated the sample size for a universe size of 1000 patients, a confidence level of 90%, 10% accuracy, and a proportion of 50%. This gave a total of 60 participants, divided into 2 groups.
Data were analyzed using SPSS version 22 (IBM Corp., Armonk, USA).
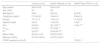
ResultsPopulationA total of 31 subjects were initially considered for inclusion. Of these, 25 were included in the study. The remaining 6 were excluded due to refusal to participate, low baseline SatO2, or high serum creatinine. Clinical characteristics of the study population are shown in Table 1. Of the 25 patients included, 12 were diagnosed with SAHS, with a mean AHI of 56.1±22.7, DI 53.6±24.3, CT90% 27.3%±22.7%, mean SatO2 90.6%±3.9% and minimum SatO2 67.2%±12.4%. As expected, these variables were higher in SAHS patients than in the controls. No significant differences were observed in age, body mass index, serum creatinine, and hemoglobin levels between the two groups. No statistically significant differences in sleepiness according to the Epworth scale were observed between the control group (9.9±5) and the SAHS group (10.8±4.5). However, this variable declined significantly in the SAHS group after treatment with CPAP (7.5±2) (Table 1).
Study Population Clinical Data and Polysomnography Results.
| Control (n=13) | SAHS Patients (n=12) | SAHS Post-CPAP (n=12) | |
|---|---|---|---|
| Age (years) | 50.6±15.8 | 55.8±13.9 | – |
| Sex (♂/♀) | 6/7 | 9/3 | – |
| BMI (kg/m2) | 29±5 | 32.9±9 | 32.9±9 |
| Creatinine (mg/dl) | 0.73±0.20 | 0.84±0.2 | 0.84±0.2 |
| Hb (g/l) | 13.7±1.3 | 14.4±1.3 | 14.2±0.8 |
| Epworth scale | 9.9±5 | 10.8±4.5 | 7.5±2*** |
| AHI | 5.8±2.5 | 56.1±22.7** | 7.2±4.7**** |
| CT90% | 0.3±0.4 | 27.3±22.7* | – |
| DI | 5.5±3.7 | 55.6±24.73* | – |
| Mean SatO2 | 95.6%±1.4% | 90.6%±3.9%** | – |
| Minimum SatO2 | 81.0%±12.6% | 67.2%±12.5%** | – |
| CPAP pressure (cmH2O) | – | – | 10.8±1.1 |
Values are expressed as mean±standard deviation.
CT90%: percentage of time with oxygen saturation <90%; Hb: serum hemoglobin; AHI: sleep apnea–hypopnea index per hour; DI: index of desaturations (3%) per hour; BMI, body mass index; mean SatO2: mean value of oxygen saturation during the night; minimum SatO2: minimum oxygen saturation during the night.
Mean CPAP pressure administered in the treatment of SAHS patients was 10.8±1.1cmH2O, and residual AHI after 3–6 months of treatment was 7.2±4.7cmH2O.
Two patients in the control group had associated cardiovascular alterations, involving supraventricular arrhythmias in both cases. In the SAHS group, 3 patients were hypertensive and 1 had moderate chronic obstructive pulmonary disease. None of them were active smokers.
UEPO LevelsUEPO levels were higher in the SAHS group than in the control group: 1.32±0.83 versus 0.32±0.35IU/l, respectively (P<.002). CPAP treatment reduced uEPO levels to 0.61±0.49IU/l (P<.02), a value not statistically different from the baseline value in the control group (P>.1) (Fig. 1).
 in the group of healthy subjects (n=13), and in the group of SAHS subjects (n=12) before and after CPAP.")
No significant correlation was observed between the PSG variables that define disease severity (AHI, DI, CT90%, mean SatO2, and minimum SatO2) and uEPO levels.
DiscussionThis study demonstrates that SAHS patients have higher levels of uEPO in first morning urine compared with control subjects. Moreover, CPAP administered to treat SAHS decreases uEPO to levels similar to those of healthy subjects.
These results are in line with those of Cahan et al.4 and Winnicki et al.,6 who reported elevated plasma levels of EPO in patients with severe SAHS. Cahan et al.5 subsequently showed that treatment with CPAP could normalize these increased concentrations. The most significant contribution of this study is that this behavior, already established in plasma,12 is also observed in urine, a specimen that is easier and less invasive to obtain.
In the study population, increased uEPO levels did not lead to a significant increase in the concentration of hemoglobin in blood, although mean values in the SAHS group were slightly higher than in controls (Table 1). This result could be expected, since secondary polycythemia is a rare finding in SAHS, observed in approximately 1% of cases.14 Very minor but significant differences with healthy subjects have only been achieved in large patient series, such as that published by Hoffstein et al.15 (624 patients).
The effect of CPAP treatment in reducing uEPO excretion is consistent with that observed with CPAP in polycythemia,14 which also normalizes. Recently, Song et al.,16 in an article pending publication, showed that CPAP corrects intermittent hypoxia caused by SAHS, inhibits EPO production, and also triggers neocytolysis. This is the main mechanism responsible for the rapid normalization of the number of red blood cells after the stimulus of intermittent hypoxia is eliminated.
One rather surprising finding in our study is that no correlation was found between the variables commonly used to quantify SAHS severity (AHI, DI, CT90%, mean SatO2, and minimum SatO2) and uEPO concentrations in the SAHS group. This may be because these variables are not a good indicator of PtiO2 in the renal cortex, which is the stimulus required to increase EPO production. SAHS is widely known to be associated with advanced age and hypertension, which may cause endothelial dysfunction10 and may, over time, affect circulation, particularly in the brain.17 These changes in local circulation may explain why systemic variables, such as AHI, DI, CT90%, and mean and minimum SatO2, are not a good reflection of PtiO2 changes in the renal cortex.
However, chronic structural changes in local circulation are not a prerequisite for PtiO2 to behave differently in different tissues in the presence of apneas. Almendros et al. showed in a rat model of obstructive apnea that PtiO2 in the brain increases with apneas,18 but this phenomenon was not observed in muscle tissue or visceral fat.19 These authors found that this distinct response in the brain is dependent on hypercapnia that occurs during apneas, and is not seen in a model of intermittent hypoxia without hypercapnia.19 All these factors – the structural status of local circulation, presence or absence of hypercapnia, and degree of response by local circulation to hypercapnia – appear to be important for determining PtiO2 in the renal cortex that cannot be measured simply with AHI, DI, CT90%, mean SatO2, and minimum SatO2, and may explain the lack of correlation with uEPO. It is not unreasonable to speculate that other variables such as transcutaneous PO2 or near-infrared spectroscopy20 could provide more accurate data on real PtiO2 in patients of this kind.21
Aside from this, we should point out that our study sample size was calculated to demonstrate our 2 main objectives, and proved sufficient for this purpose, but it is insufficient for identifying correlations between PSG variables and uEPO. If this objective is to be explored, a larger sample and different techniques will be necessary.
It should be noted that the SAHS patient group had severe disease, and this characteristic probably helped to highlight differences in uEPO compared to the control subjects. However, our data cannot be used to predict if the same would occur in patients with mild-to-moderate SAHS. A specific study to quantify uEPO in this population is necessary.
In short, this study shows that uEPO is clearly elevated in a group of patients with severe SAHS compared to the control group. The determination of this hormone in first morning urine is proposed as a simple approach for future studies. Moreover, we were able to reduce these elevated levels to normal with the use of CPAP. Further studies in larger populations are probably required, and other physiological and biological variables should be included for a better characterization of the mechanisms and clinical implications of these findings.
Conflict of InterestsThe authors state that they have no conflict of interests.
Please cite this article as: Félez M, Grau N, Ruiz A, Guardiola E, Sanjuas C, Estirado C, et al. El síndrome de apneas-hipoapneas del sueño (SAHS) grave incrementa la excreción urinaria de eritropoyetina. Efecto del tratamiento con CPAP. Arch Bronconeumol. 2018;54:255–259.


