

Eosinophilic pleural effusion (EPE) has been associated with less risk for malignancy with a potential causal relationship with the presence of air and/or blood in the pleural space. However, these theories have fallen by the wayside in the light of recent publications.
ObjectivesTo determine the incidence and etiology of EPE and to observe whether the eosinophils in the pleural liquid (PL) increase in successive thoracocenteses.
Patients and methodsWe analyzed 730 PL samples from 605 patients hospitalized between January 2004 and December 2010.
ResultsWe identified 55 samples with EPE from 50 patients (8.3%). The most frequent etiologies of EPE were: unknown (36%) and neoplasm (30%). There were no significant differences in the incidence of neoplasms between the non-eosinophilic pleural effusions (non-EPE) (25.9%) and the EPE (30%) (P=.533). One hundred patients (16.5%) underwent a second thoracocentesis. Out of the 9 who had EPE in the first, 6 maintained EPE in the second. Out of the 91 with non-EPE in the first thoracocentesis, 8 (8.8%) had EPE in the repeat thoracocentesis. The percentage of eosinophils did not increase in the successive thoracocenteses (P=.427). In the EPE, a significant correlation was found between the number of hematites and eosinophils in the PL (r=0.563; P=.000).
ConclusionsAn EPE cannot be considered an indicator of benignancy; therefore it should be studied like any other pleural effusion. The number of eosinophils does not seem to increase with the repetition of thoracocentesis and, lastly, the presence of blood in the PL could explain the existence of EPE.
Los derrames pleurales eosinofílicos (DPE) se asociaban a un menor riesgo de malignidad con una potencial relación causal con la presencia de aire y/o sangre en el espacio pleural. Sin embargo, ambas teorías han quedado en entredicho tras las últimas publicaciones.
ObjetivosConocer la incidencia y etiología de los DPE y comprobar si en toracocentesis sucesivas aumentan los eosinófilos en el líquido pleural (LP).
Material y métodosAnalizamos 730 muestras de LP correspondientes a 605 pacientes ingresados entre enero-2004 y diciembre-2010.
ResultadosIdentificamos 55 muestras con un DPE correspondientes a 50 pacientes (8,3%). Las etiologías más frecuentes de DPE fueron: desconocida (36%) y neoplasia (30%). No hubo diferencias significativas en la incidencia de neoplasias entre los derrames pleurales no eosinofílicos (DPNE) (25,9%) y los DPE (30%) (p=0,533). A 100 pacientes (16,5%) se les repitió la toracocentesis. De los 9 con un DPE en la primera, 6 lo mantenían en la segunda. De los 91 con un DPNE en la primera toracocentesis, 8 (8,8%) tuvieron un DPE en las sucesivas. El porcentaje de eosinófilos no aumentó en las toracocentesis sucesivas (p=0,427). En los DPE se encontró correlación significativa entre los números de hematíes y de eosinófilos en LP (r=0,563; p=0,000).
ConclusionesUn DPE no puede considerarse un indicador de benignidad por lo que debe ser estudiado como cualquier derrame pleural. La repetición de toracocentesis no parece que aumente el número de eosinófilos y, por último, la presencia de sangre en el LP podría justificar la existencia de un DPE.
The total nucleated cell count in the pleural liquid (PL) usually provides useful information. In addition to the nature of the pleural lesion that is produced, one of the factors that influences the type of existing cell population is the evolution time of the effusion. Thus, pleural effusions with a predominance of neutrophils are usually observed in acute responses after infections, immunological or inflammatory processes such as bacterial pneumonia, pulmonary embolism or acute pancreatitis. Meanwhile, a predominance of lymphocytes is more frequent in effusions evolving over more than 2 weeks, such as in tuberculosis, lymphomas, rheumatoid pleuritis or chylothorax.1 However, the clinical significance of eosinophilic pleural effusions (EPE) is uncertain.2
The classic articles in the literature consider EPE to be associated with a lower risk for malignancy and that there is a potential causal relationship between the presence of air and/or blood in the pleural space and the appearance of an EPE.3,4 Nevertheless, both theories have been questioned after recent publications have reported that neoplastic effusions are as prevalent in EPE as in non-eosinophilic effusions (non-EPE), and that the incidence of EPE in patients who undergo a second thoracocentesis is no different from that of the first.5–8
The objectives of our study are to know the incidence and etiology of EPE in our population, to evaluate whether these effusions are associated with malignancy with less frequency than non-EPE and to verify whether successive thoracocenteses cause an increase in eosinophils in the PL.
Materials and MethodsWe have consecutively included all the patients with pleural effusion admitted between January 2004 and December 2010 to the Pneumology Department of our hospital. Fasting blood and PL samples were obtained the same day. The following biochemical determinations were carried out: total protein, lactate dehydrogenase (LDH), glucose, cholesterol, red blood cell count and total count and percentage of nucleated cells in PL as well as in plasma (P). In addition, PL samples were sent for pathological and microbiologic anatomy studies. The pleural biopsies were taken with either Cope or Abrams needles, indiscriminately.
The biochemical determinations were done with an ADVIA 1650 analyzer (SIEMENS Healthcare Diagnostics S.L). The ranges of normal values in blood were: total protein 6–8g/dL; LDH 115–320 U/L; glucose 65–110mg/dL; cholesterol 115–220mg/dL. The red blood cell and nucleated cell counts in PL were determined using an ADVIA 2120 hematology analyzer (SIEMENS Healthcare Diagnostics S.L). The differential count of the nucleated cells was done after cytocentrifuging (450×g for 10min) and the May–Grünwald–Giemsa stain was done manually for the PL and automatically for blood.
EPE was defined as pleural effusion with ≥10% eosinophils. In the cases of carrying out 2 or more thoracocentesis in the same patient and more than one sample of pleural liquid met the criteria for EPE, we only took into account the results of the first. Those patients who underwent thoracocentesis in the Emergency Department in order to rule out empyema and did not completely follow the study protocol were also excluded. The pleural effusions were classified as transudates or exudates using Light's and pleural cholesterol criteria.9,10 The etiology of the EPE was established based on the clinical histories, physical exploration, radiological studies, laboratory findings and the results of the analyses of the liquid and pleural biopsy. The etiology of the pleural transudates (congestive heart failure, chronic hepatopathy and nephrotic syndrome) was based on the clinical and laboratory data as well as the negative microbiology and cytology of the pleural liquid.11 The diagnosis of the pleural exudates was established based on the following criteria:
Malignant pleural effusion: positive cytology in the PL and/or histology of the pleural biopsy.
Tuberculous pleural effusion: culture for Mycobacterium tuberculosis in pleural liquid or biopsy, or respiratory signs (sputum, bronchial aspiration or bronchoalveolar lavage), or rather granulomas in the pleural biopsy.
Parapneumonic pleural effusion/empyema: patients with typical signs and symptoms (acute febrile syndrome and pleuritic pain) and pulmonary infiltrates on chest radiography, with no other explanation for pleural effusion.
Post-traumatic pleural effusion: those that develop after chest trauma with no other cause that could explain it.
Pleural effusions due to connective tissue diseases: patients with one of these diseases, after the exclusion of other causes of the pleural effusion.
Pleural effusions of unknown origin: when all the diagnostic procedures were not able to identify the etiology of the effusion. These patients were followed in order to make sure that the pleural effusion did not re-occur.
Statistical AnalysisThe data are expressed as mean and interquartile range. For the comparison between the study groups, we used Pearson's chi-squared test for the qualitative variables and the non-parametric Mann–Whitney test for the quantitative variables. For the comparison of the continuous variables in the same individual, the Wilcoxon test for paired data was used. All those values with a P<.05 were considered significant. For the data analysis, SPSS for Windows v.15 was used.
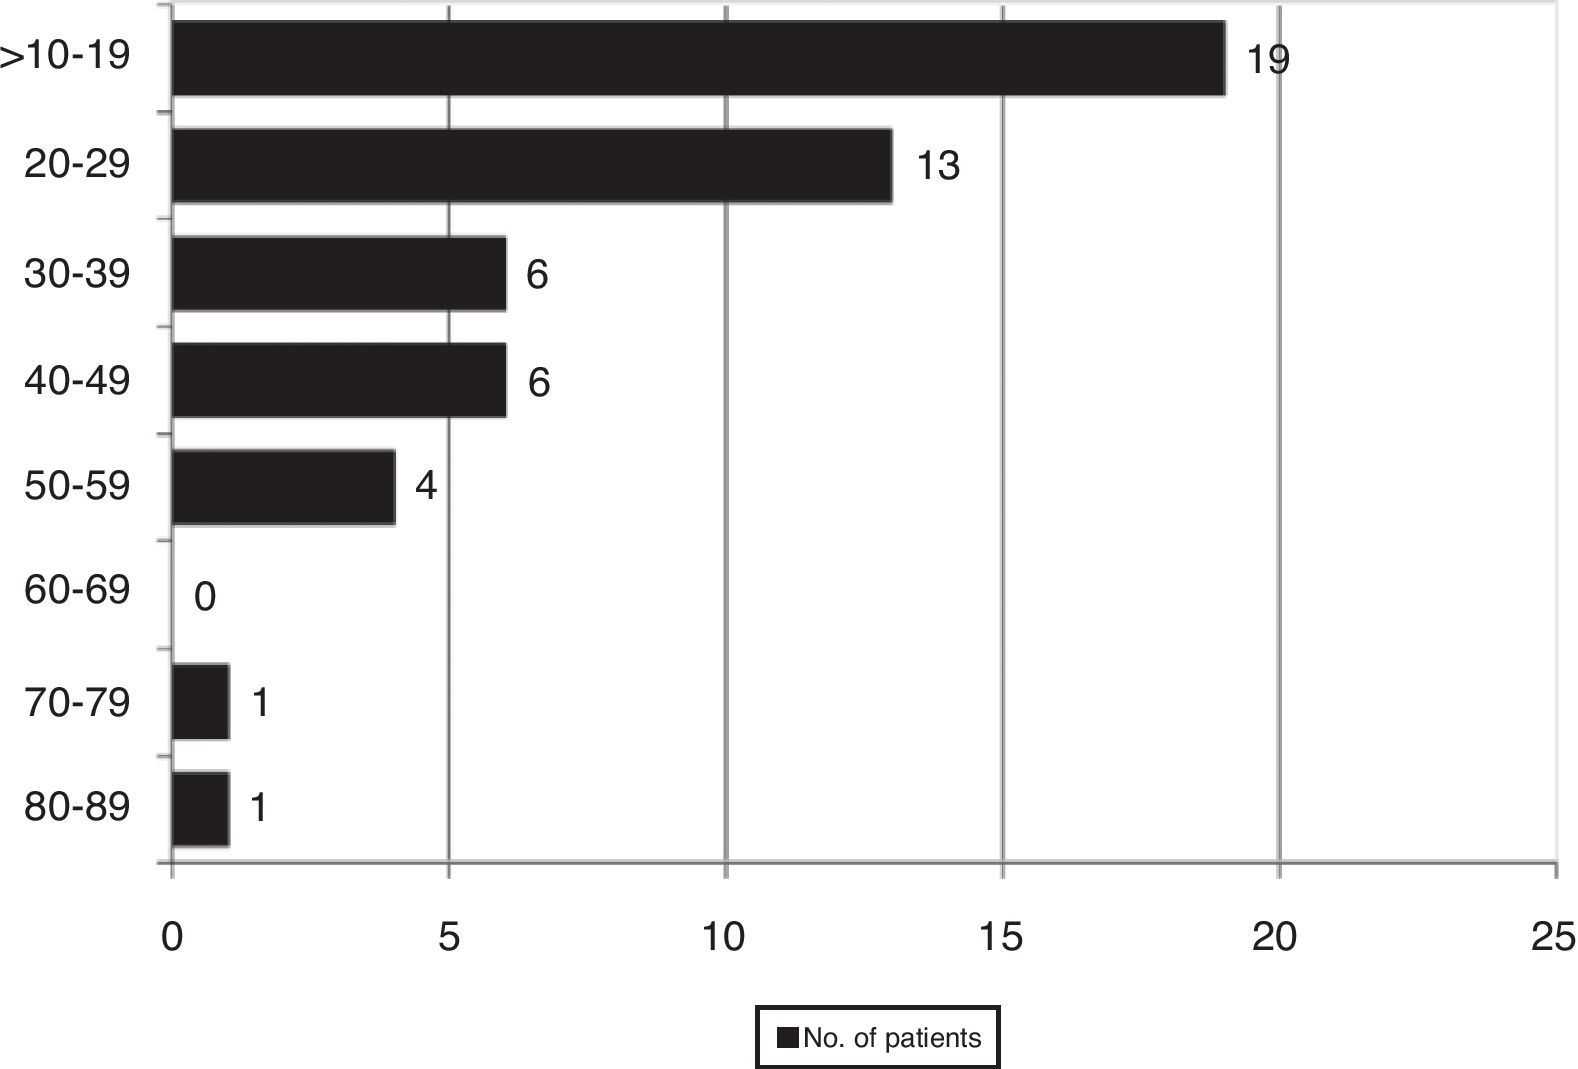
ResultsWe found 55 EPE in 730 samples (7.5%), which corresponded with 50 patients out of a total of 605 (8.3%). Fig. 1 shows the distribution of the percentage of eosinophils in all the cases with EPE.

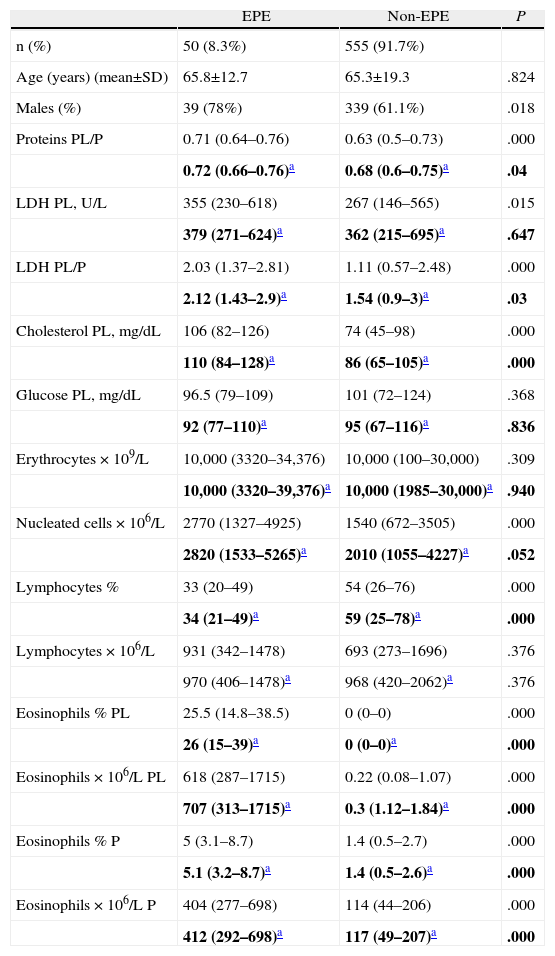
The characteristics of the patients with EPE and non-EPE are expressed in Table 1. In the EPE, the percentage of males was significantly higher than in the non-EPE. Equally, in the EPE we found significantly higher levels of total proteins PL/S, LDH PL, LDH PL/S, cholesterol PL, nucleated cells and eosinophil percentage and count, both in PL as well as in S, than in the non-EPE. If the transudates are excluded (heart failure, chronic hepatopathy, hypoalbuminemia and nephrotic syndrome) from both groups (EPE and non-EPE) in order to verify that this difference is not due to a greater number of transudates in the non-EPE, significant differences continued to be observed for the total protein parameters PL/P, LDH PL/P, cholesterol PL and eosinophil percentage and count, the latter in PL as well as in P. In the non-EPE, the percentage of lymphocytes is significantly higher than in the EPE, both in the totality of the effusions and in the exudates.
Comparison of Age, Sex and Biochemical Parameters in Patients With Eosinophilic and Non-eosinophilic Pleural Effusion.
| EPE | Non-EPE | P | |
| n (%) | 50 (8.3%) | 555 (91.7%) | |
| Age (years) (mean±SD) | 65.8±12.7 | 65.3±19.3 | .824 |
| Males (%) | 39 (78%) | 339 (61.1%) | .018 |
| Proteins PL/P | 0.71 (0.64–0.76) | 0.63 (0.5–0.73) | .000 |
| 0.72 (0.66–0.76)a | 0.68 (0.6–0.75)a | .04 | |
| LDH PL, U/L | 355 (230–618) | 267 (146–565) | .015 |
| 379 (271–624)a | 362 (215–695)a | .647 | |
| LDH PL/P | 2.03 (1.37–2.81) | 1.11 (0.57–2.48) | .000 |
| 2.12 (1.43–2.9)a | 1.54 (0.9–3)a | .03 | |
| Cholesterol PL, mg/dL | 106 (82–126) | 74 (45–98) | .000 |
| 110 (84–128)a | 86 (65–105)a | .000 | |
| Glucose PL, mg/dL | 96.5 (79–109) | 101 (72–124) | .368 |
| 92 (77–110)a | 95 (67–116)a | .836 | |
| Erythrocytes×109/L | 10,000 (3320–34,376) | 10,000 (100–30,000) | .309 |
| 10,000 (3320–39,376)a | 10,000 (1985–30,000)a | .940 | |
| Nucleated cells×106/L | 2770 (1327–4925) | 1540 (672–3505) | .000 |
| 2820 (1533–5265)a | 2010 (1055–4227)a | .052 | |
| Lymphocytes % | 33 (20–49) | 54 (26–76) | .000 |
| 34 (21–49)a | 59 (25–78)a | .000 | |
| Lymphocytes×106/L | 931 (342–1478) | 693 (273–1696) | .376 |
| 970 (406–1478)a | 968 (420–2062)a | .376 | |
| Eosinophils % PL | 25.5 (14.8–38.5) | 0 (0–0) | .000 |
| 26 (15–39)a | 0 (0–0)a | .000 | |
| Eosinophils×106/L PL | 618 (287–1715) | 0.22 (0.08–1.07) | .000 |
| 707 (313–1715)a | 0.3 (1.12–1.84)a | .000 | |
| Eosinophils % P | 5 (3.1–8.7) | 1.4 (0.5–2.7) | .000 |
| 5.1 (3.2–8.7)a | 1.4 (0.5–2.6)a | .000 | |
| Eosinophils×106/L P | 404 (277–698) | 114 (44–206) | .000 |
| 412 (292–698)a | 117 (49–207)a | .000 |
The data are expressed as means (percentile 25−percentile 75). EPE, eosinophilic pleural effusion; non-EPE, non-eosinophilic pleural effusion; LDH, lactate dehydrogenase; PL, pleural liquid; P, plasma.
The median percentage of eosinophils in the PL of the patients with an EPE was 25.5% (14.8%–38.5%), significantly higher than the percentage of eosinophils in peripheral blood 5% (3.1%–8.7%) (P=.000). The median eosinophil count in the pleural liquid of these patients was 618 cells×106/L (287–1.715), significantly higher than the peripheral blood at 404 cells×106/L (277–698), P=.000. Thirty-one of the 50 patients with an EPE had more than 350eosinophils/mm3 in peripheral blood, corresponding with: 10 neoplastic effusions, 10 of unknown origin, 4 post-trauma, 2 parapneumonic, 2 post-surgery, 1 systemic lupus erythematosus, 1 rheumatoid arthritis and 1 heart failure.
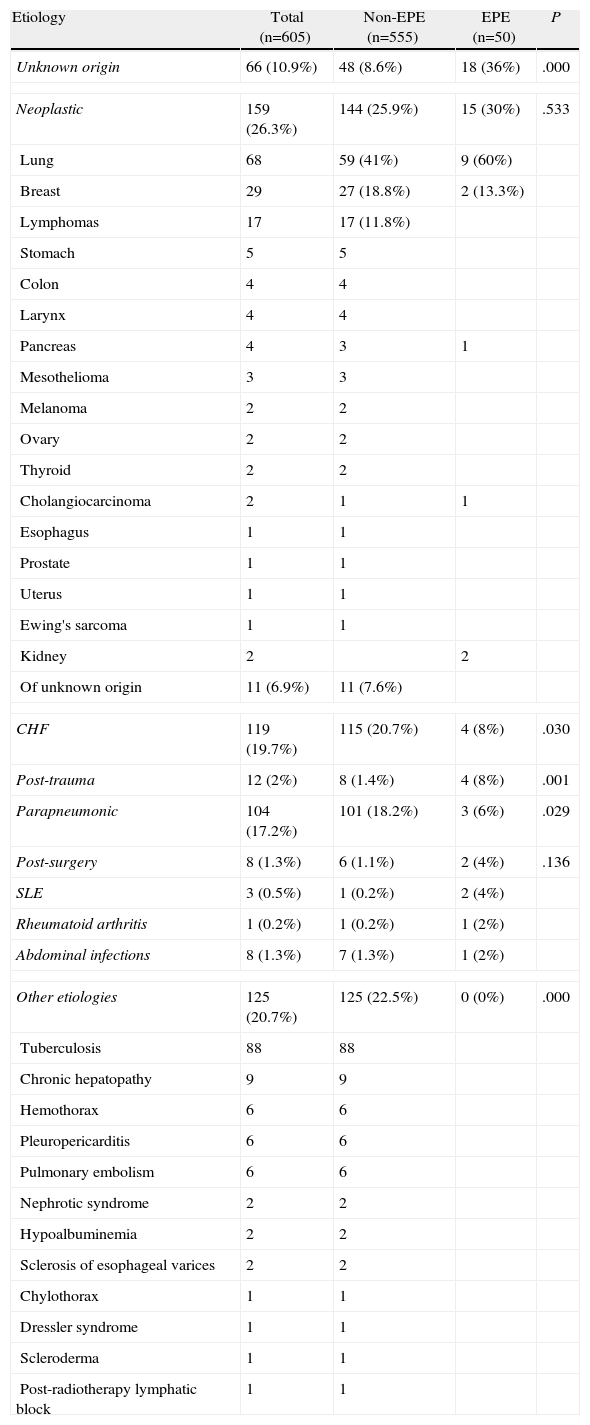
The etiology of the patients with EPE is indicated in Table 2. The percentage of pleural effusions of unknown origin was significantly higher in EPE than in non-EPE (P=.000); the same was true for the post-trauma effusions (P=.001). Contrarily, significant differences were not found in the percentage of neoplastic effusions between the EPE and non-EPE (P=.533). Lastly, the percentage of effusions due to heart failure and parapneumonia was significantly higher in the non-EPE than in the EPE.
Etiology of the Eosinophilic Pleural Effusions.
| Etiology | Total (n=605) | Non-EPE (n=555) | EPE (n=50) | P |
| Unknown origin | 66 (10.9%) | 48 (8.6%) | 18 (36%) | .000 |
| Neoplastic | 159 (26.3%) | 144 (25.9%) | 15 (30%) | .533 |
| Lung | 68 | 59 (41%) | 9 (60%) | |
| Breast | 29 | 27 (18.8%) | 2 (13.3%) | |
| Lymphomas | 17 | 17 (11.8%) | ||
| Stomach | 5 | 5 | ||
| Colon | 4 | 4 | ||
| Larynx | 4 | 4 | ||
| Pancreas | 4 | 3 | 1 | |
| Mesothelioma | 3 | 3 | ||
| Melanoma | 2 | 2 | ||
| Ovary | 2 | 2 | ||
| Thyroid | 2 | 2 | ||
| Cholangiocarcinoma | 2 | 1 | 1 | |
| Esophagus | 1 | 1 | ||
| Prostate | 1 | 1 | ||
| Uterus | 1 | 1 | ||
| Ewing's sarcoma | 1 | 1 | ||
| Kidney | 2 | 2 | ||
| Of unknown origin | 11 (6.9%) | 11 (7.6%) | ||
| CHF | 119 (19.7%) | 115 (20.7%) | 4 (8%) | .030 |
| Post-trauma | 12 (2%) | 8 (1.4%) | 4 (8%) | .001 |
| Parapneumonic | 104 (17.2%) | 101 (18.2%) | 3 (6%) | .029 |
| Post-surgery | 8 (1.3%) | 6 (1.1%) | 2 (4%) | .136 |
| SLE | 3 (0.5%) | 1 (0.2%) | 2 (4%) | |
| Rheumatoid arthritis | 1 (0.2%) | 1 (0.2%) | 1 (2%) | |
| Abdominal infections | 8 (1.3%) | 7 (1.3%) | 1 (2%) | |
| Other etiologies | 125 (20.7%) | 125 (22.5%) | 0 (0%) | .000 |
| Tuberculosis | 88 | 88 | ||
| Chronic hepatopathy | 9 | 9 | ||
| Hemothorax | 6 | 6 | ||
| Pleuropericarditis | 6 | 6 | ||
| Pulmonary embolism | 6 | 6 | ||
| Nephrotic syndrome | 2 | 2 | ||
| Hypoalbuminemia | 2 | 2 | ||
| Sclerosis of esophageal varices | 2 | 2 | ||
| Chylothorax | 1 | 1 | ||
| Dressler syndrome | 1 | 1 | ||
| Scleroderma | 1 | 1 | ||
| Post-radiotherapy lymphatic block | 1 | 1 | ||
EPE, eosinophilic pleural effusion; non-EPE, non-eosinophilic pleural effusion; CHF, congestive heart failure; SLE, systemic lupus erythematosus.
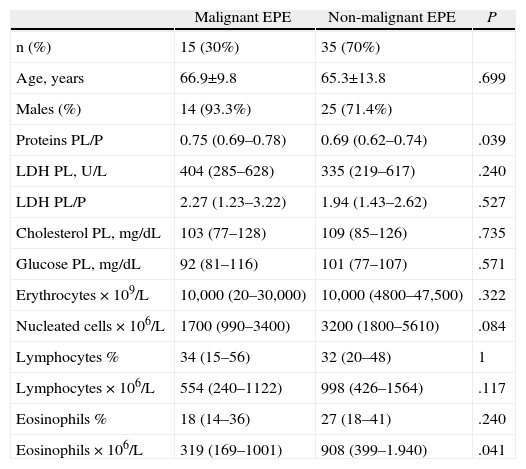
About 8% of the EPE (4/50) corresponded with transudates, compared with 20.7% of the non-EPE (115/555). The comparative analysis of the patients with an EPE that was either malignant or non-malignant is indicated in Table 3. It should be highlighted that the eosinophil count was significantly higher in the non-malignant EPE than in the malignant EPE (P=.041). The diagnostic capacity of the percentage of eosinophils in PL for differentiating the malignant from the non-malignant effusions in the EPE group is discrete (area under the curve 0.61; 95% confidence interval 0.44–0.77). One cut-point at 25% eosinophils in the PL had a sensitivity of 60% and a specificity of 63%.
Comparison Between the Malignant and Non-malignant Eosinophilic Plural Effusions.
| Malignant EPE | Non-malignant EPE | P | |
| n (%) | 15 (30%) | 35 (70%) | |
| Age, years | 66.9±9.8 | 65.3±13.8 | .699 |
| Males (%) | 14 (93.3%) | 25 (71.4%) | |
| Proteins PL/P | 0.75 (0.69–0.78) | 0.69 (0.62–0.74) | .039 |
| LDH PL, U/L | 404 (285–628) | 335 (219–617) | .240 |
| LDH PL/P | 2.27 (1.23–3.22) | 1.94 (1.43–2.62) | .527 |
| Cholesterol PL, mg/dL | 103 (77–128) | 109 (85–126) | .735 |
| Glucose PL, mg/dL | 92 (81–116) | 101 (77–107) | .571 |
| Erythrocytes×109/L | 10,000 (20–30,000) | 10,000 (4800–47,500) | .322 |
| Nucleated cells×106/L | 1700 (990–3400) | 3200 (1800–5610) | .084 |
| Lymphocytes % | 34 (15–56) | 32 (20–48) | 1 |
| Lymphocytes×106/L | 554 (240–1122) | 998 (426–1564) | .117 |
| Eosinophils % | 18 (14–36) | 27 (18–41) | .240 |
| Eosinophils×106/L | 319 (169–1001) | 908 (399–1.940) | .041 |
EPE, eosinophilic pleural effusion; LDH, lactate dehydrogenase; PL, pleural liquid; P, plasma.
We carried out a follow-up of the 18 EPE of unknown origin. Two patients were lost to follow up and did not attend scheduled office visits. In 15 of the 16 cases (93.8%), the pleural effusion disappeared spontaneously 6 months later, and in the remaining case the effusion continues to persist to date (and is being followed in our outpatient consultation). Two of the 15 patients in whom the pleural effusion disappeared later died, both due to respiratory infections.
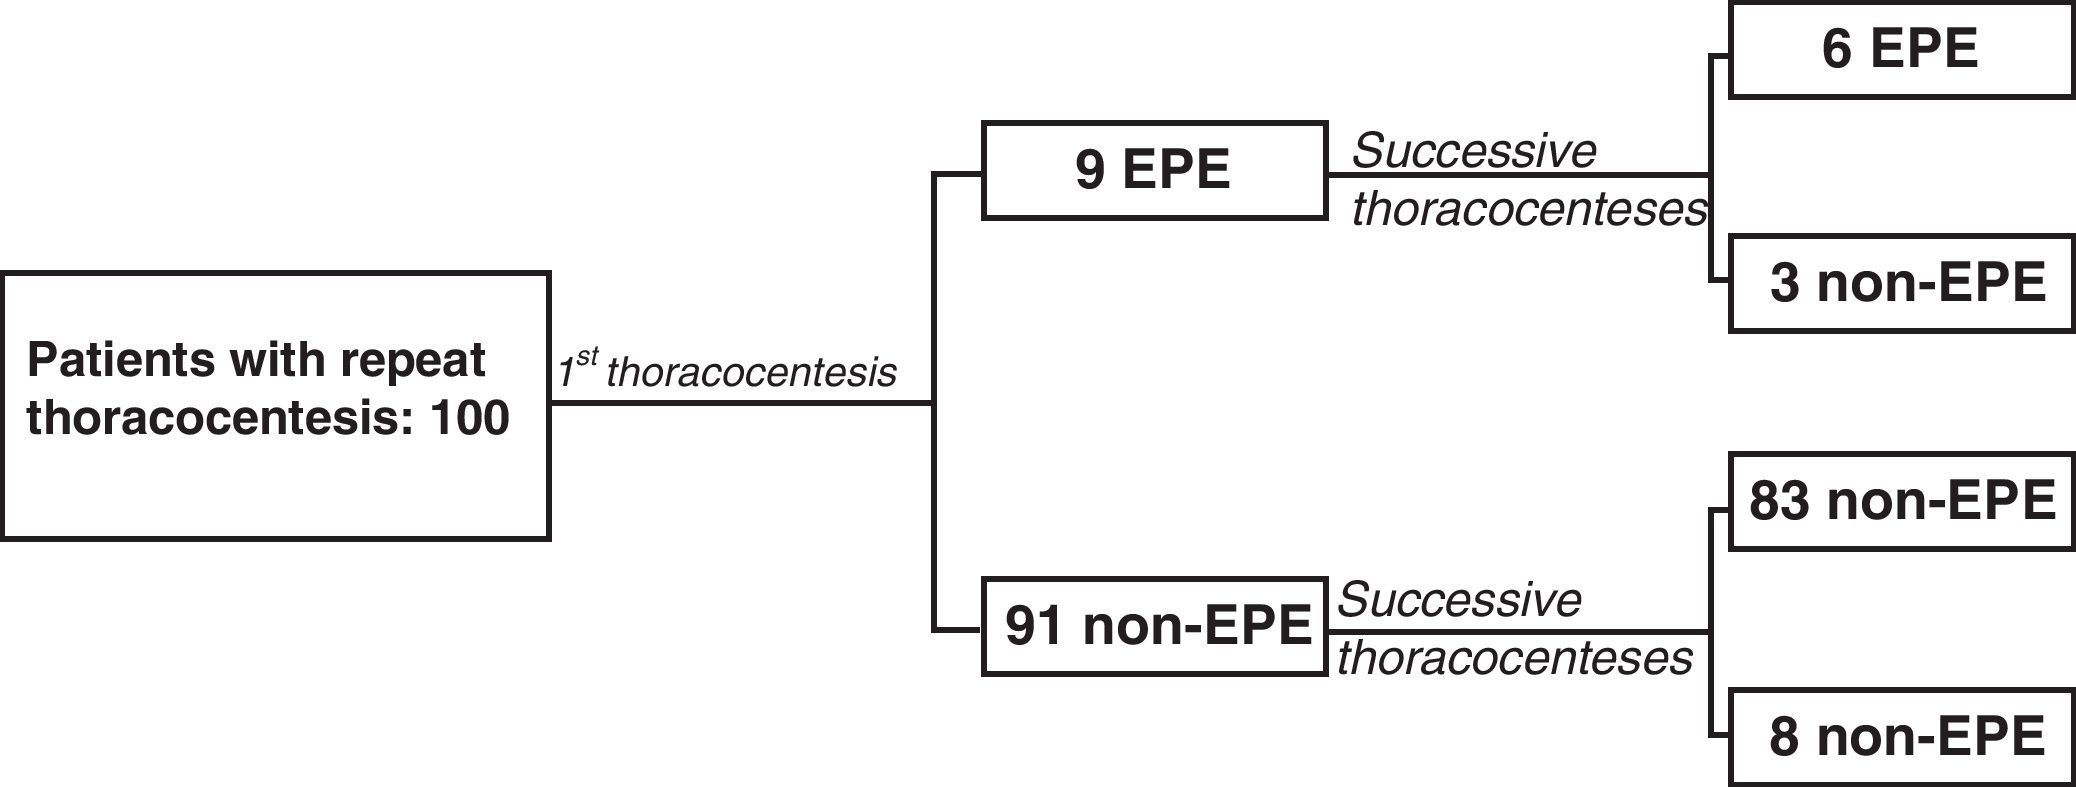
A total of 125 thoracocenteses were repeated in 100 of the 605 patients (16.5%): 9 with EPE (9%) and 91 (91%) with non-EPE in the first thoracocenteses. The average interval between the first and the second thoracocentesis was 8 days (4–14). In 6 of the 9 patients with EPE, the predominance of eosinophils was present in both samples, while in 3 there was only a predominance of eosinophils in the first thoracocentesis (Fig. 2). Out of the 6 patients that presented EPE in both thoracocenteses, the percentage of eosinophils was only higher in the second thoracocentesis in one case. In the 91 patients who had a non-EPE on the first thoracocentesis, 8 presented EPE at one or more of the successive thoracocenteses (8.8%). The percentage of eosinophils did not increase in successive thoracocenteses as there were no significant differences between the means of both samples (P=.427).

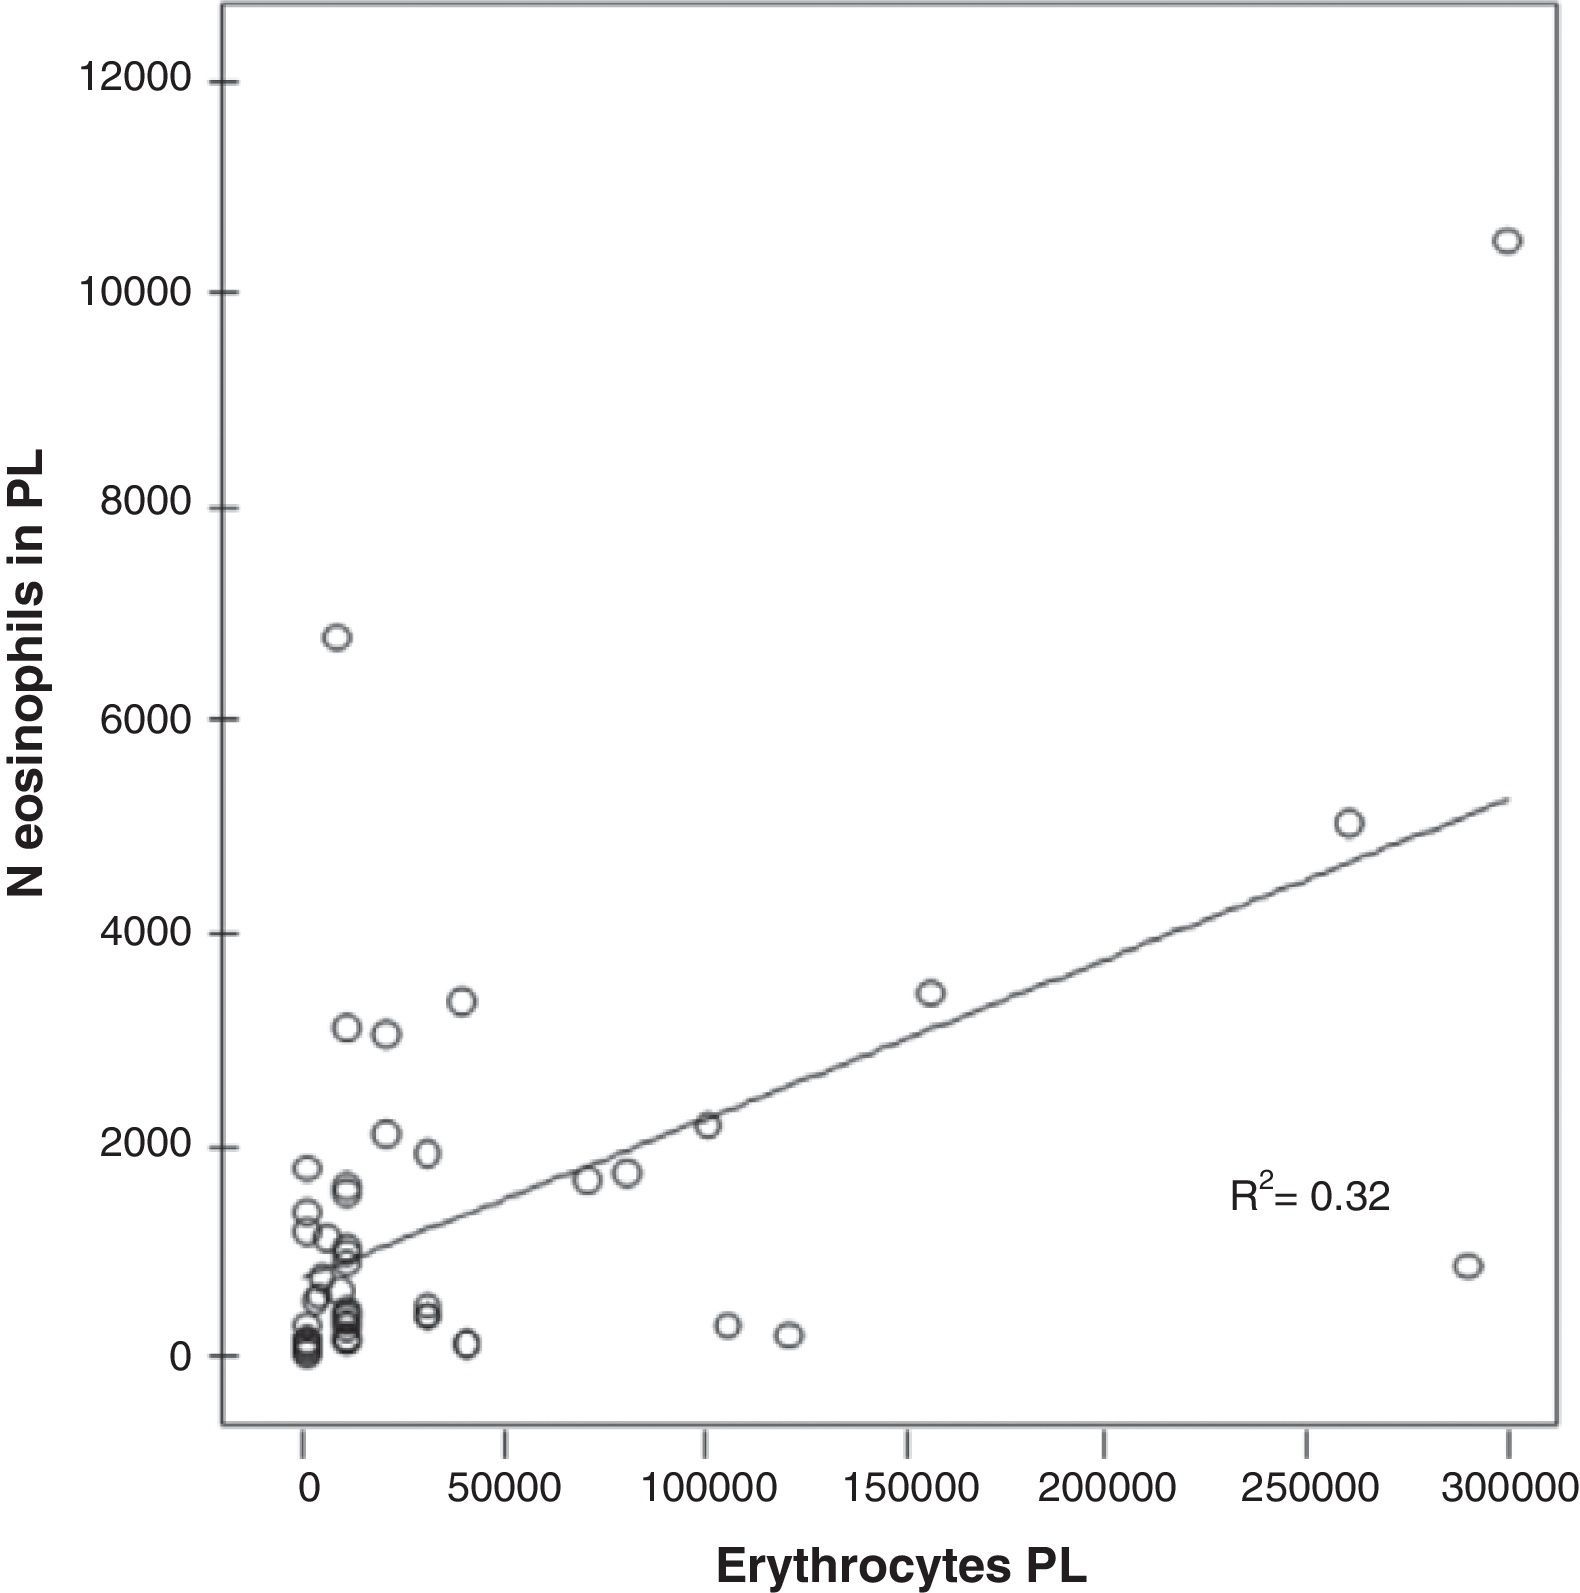
A significant correlation was found in the PL between the number of red blood cells and the number of eosinophils in the EPE (r=0.563; P<.000) (Fig. 3).
Discussion
This study confirms that the incidence of malignant effusions in EPE is similar to that found non-EPE and, therefore, a predominance of eosinophils (≥10%) cannot be considered an indicator of benignancy. In addition, the percentage of eosinophils does not seem to increase in successive thoracocenteses and, last of all, the presence of blood in PL could explain the appearance of EPE.
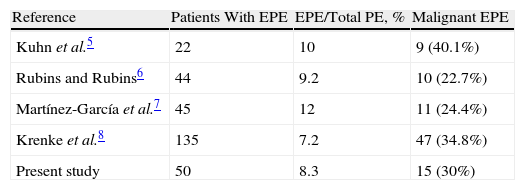
Since the classic review by Adelman et al.3 which found only 8% malignant effusions among the 343 patients with EPE, it has been considered that, when given a pleural effusion of these characteristics, the possibility of an effusion with malignant etiology is very unlikely. These results were later backed by Wysenbeek et al.4 and Kamel et al.12 However, new studies have not confirmed this finding5–8 (Table 4) as, in all of them, the probability that an EPE is neoplastic was similar to that of the non-EPE. Along these lines, in our study, 30% of the EPE were neoplastic in origin, compared with 25.9% of the non-EPE (non-significant differences).
Percentage of Malignant Effusions in Patients With Eosinophilic Pleural Effusions.
| Reference | Patients With EPE | EPE/Total PE, % | Malignant EPE |
| Kuhn et al.5 | 22 | 10 | 9 (40.1%) |
| Rubins and Rubins6 | 44 | 9.2 | 10 (22.7%) |
| Martínez-García et al.7 | 45 | 12 | 11 (24.4%) |
| Krenke et al.8 | 135 | 7.2 | 47 (34.8%) |
| Present study | 50 | 8.3 | 15 (30%) |
PE, pleural effusion; EPE, eosinophilic pleural effusion.
The high male/female ratio that we have found with EPE (3.5/1) has already been observed in previous studies.4,8,12 In addition, the percentage of males with EPE was significantly higher than in those with non-EPE (P=.018). Likewise, the EPE presented higher values for the parameters of proteins PL/P, LDH PL, LDH PL/P, cholesterol PL and nucleated cells (Table 1). As these results can be influenced by the greater number of transudates in the non-EPE group, a new calculation was done, excluding the transudates from both groups. Higher levels were still found for proteins PL/P, LDH PL/P, cholesterol PL and eosinophil percentage and count, the latter in pleural liquid as well as in blood (Table 1). These results have not been able to be compared with those of other authors because there are no data in this regard, but it is possible that their increased levels could respond to some pathogenic mechanism involved in the appearance of an EPE that is still unknown.2 As expected, the eosinophil percentage and count in PL were significantly higher in the EPE. In the non-EPE, both the median and the percentiles 25–75 of the percentage of eosinophils in PL were zero, which means that at least in 75% of these effusions eosinophils were not observed in the PL. Thirty-one of the 50 patients with EPE had peripheral eosinophilia, but this fact does not seem to be related with the etiology of the effusion as their origin was similar.
In 36% of the EPE, a definitive diagnosis was not reached, which is a percentage much higher than the 8.6% of the non-EPE (P=.000). These data are similar to that published by Rubins and Rubins,6 Martínez-García et al.7 (although in this latter case without a significant difference compared to the non-EPE), and Adelman et al.3 who found that the EPE are often associated with idiopathic effusions. The prognosis of these effusions seems to be favorable as in 15 out of 16 patients followed in our outpatient consultation; the effusion resolved itself spontaneously in a maximum period of 6 months. In the 2 patients who died, the pleural effusion had already disappeared and the causes of death were intercurrent processes (respiratory infections) with important underlying pathologies (GOLD Grade 4 COPD and pneumoconiosis, respectively). The other case is still being controlled in our outpatient consultations due to persistence of the effusion, and to date its cause has yet to be identified. In this direction, although in a study different from ours, Rubins and Rubins6 report that EPE, in general (not idiopathic), have a significantly higher survival (16.8 months) than non-EPE (7.7 months), regardless of age.
Despite the fact that, as in other series, the percentage of malignant effusions with EPE moves in a relatively low range between 5% and 11%3,5–7 (9.4% in our case), neoplastic pleuritis was the second most frequent cause of EPE (15/50; 30%) and the first in the non-EPE (144/555; 25.9%) without any significant differences found between the two. In trying to explain the increase in eosinophils in some malignant pleural effusions, Kalomenidis and Light2 suggest the possibility that some cancer cells can produce adhesion molecules and chemokines, which could attract the eosinophils.13 It is striking that, in our series, the eosinophil count in non-malignant EPE is significantly higher than in malignant ones (P=.041) (Table 3). This result concurs with that by Krenke et al., who found an inverse relationship between the percentage of eosinophils in PL and the proportion of patients with malignant pleural effusion.8 Nevertheless, this parameter has a very discrete capacity for discrimination in the EPE group, between malignant and non-malignant effusions (sensitivity 60%, specificity 63% for a cut-point of 25% eosinophils).
Out of the 125 patients categorized in the “other etiologies” group (Table 2), which encompassed all those diseases that did not present an EPE, 88 (70.4%) were tuberculous in origin. The fact that none of these pleuritis has EPE is surprising since, although in other series the percentage of tuberculosis is small,5,6,8 it must be kept in mind that, in all of them, the incidence of tuberculous effusions in the total effusions is very low (less than 3%), while in ours it is 14.5%. Contrarily, in the series by Martínez-García et al.7 in a setting similar to ours with an incidence of tuberculosis of 20.1%, 9.7% of the tuberculous effusions had EPE and 15.6% of these were tuberculous. In the case by Kamel et al.12 in a study carried out in Tunisia, a country with a high prevalence of tuberculous pleuritis, 39.6% of the EPE were tuberculous in origin. In the same way, we have also found no cases of pulmonary embolism (PE) with EPE in the 6 patients of our series. Romero-Candeira et al.14 found that 18% of their 60 patients with pleural effusion due to PE present EPE. However, there is great discrepancy in this regard as the results of other authors varied between 0%6 (as in our study) and 33%,5 although the number of PE with pleural effusion of this series is small (9 cases). The possibility that an EPE secondary to a PE had been erroneously classified as of unknown origin seems unlikely because, as is recommended, all the patients with pleural effusion of unknown origin and compatible clinical signs undergo thoracic computed angiotomography (CT).15
After the study by Adelman et al.3 it was affirmed that the presence of an EPE after previous thoracocentesis could be due to the entrance of either air or blood in the pleural cavity. In this direction, in a study carried out in 26 patients with pleural effusion with neoplastic origin, Chung et al.16 concluded that repetitive thoracocenteses can induce the local release of proinflammatory cytokines, which would explain the increase in eosinophils in these cases. However, like other authors,6,8,17 we have not been able to confirm whether the repetition of thoracocenteses can be the cause of EPE. Out of the 9 patients who presented EPE in the first thoracocentesis, 3 did not present with successive thoracocenteses. Out of 91 with non-EPE, 8.8% presented EPE in later thoracocenteses, similar to the 8.3% of the initial thoracocentesis. In addition, there were no significant differences between the percentage of eosinophils of the first thoracocentesis and the successive ones. Several studies have demonstrated that the injection of blood or air can cause peritoneal and pleural eosinophilia,18,19 presumably due to an eosinophil chemotactic effect by the erythrocytes or the dust particles suspended in the air.20 However, Kalomenidis and Light argue that, while it is common for patients with trauma or chest surgery to present EPE, it is not possible to separately attribute the development of these effusions to the entrance of air and blood into the pleural space. In their opinion, the common denominator of the presence of air or blood in the pleural cavity would be the mechanical injury of the pleura. This would cause a deformation of the mesothelial cells that would stimulate the release of chemokines responsible for the accumulation of eosinophils.2
A significant correlation has been found between the number of eosinophils and erythrocytes in the PL of the patients with EPE (r=0.563; P<.000) (Fig. 3), which suggests that the presence of blood in the PL could explain the presence of EPE. Rubins and Rubins,6 however, did not find this correlation; therefore, new studies are necessary to confirm this result.
In conclusion, our study confirms that the presence of an EPE cannot be considered an indicator of benignancy. Therefore, given the presence of a pleural effusion of these characteristics, the study protocol should be the standard one used in any pleural effusion. Repeat thoracocentesis does not seem to increase the number of eosinophils. Contrarily, the presence of blood in the PL could justify the existence of an EPE.
Conflict of InterestsThe authors have no conflict of interest to declare.
Please cite this article as: Ferreiro L, et al. Derrames pleurales eosinofílicos: incidencia, etiología y significado pronóstico. Arch Bronconeumol. 2011;47:504–9.


