

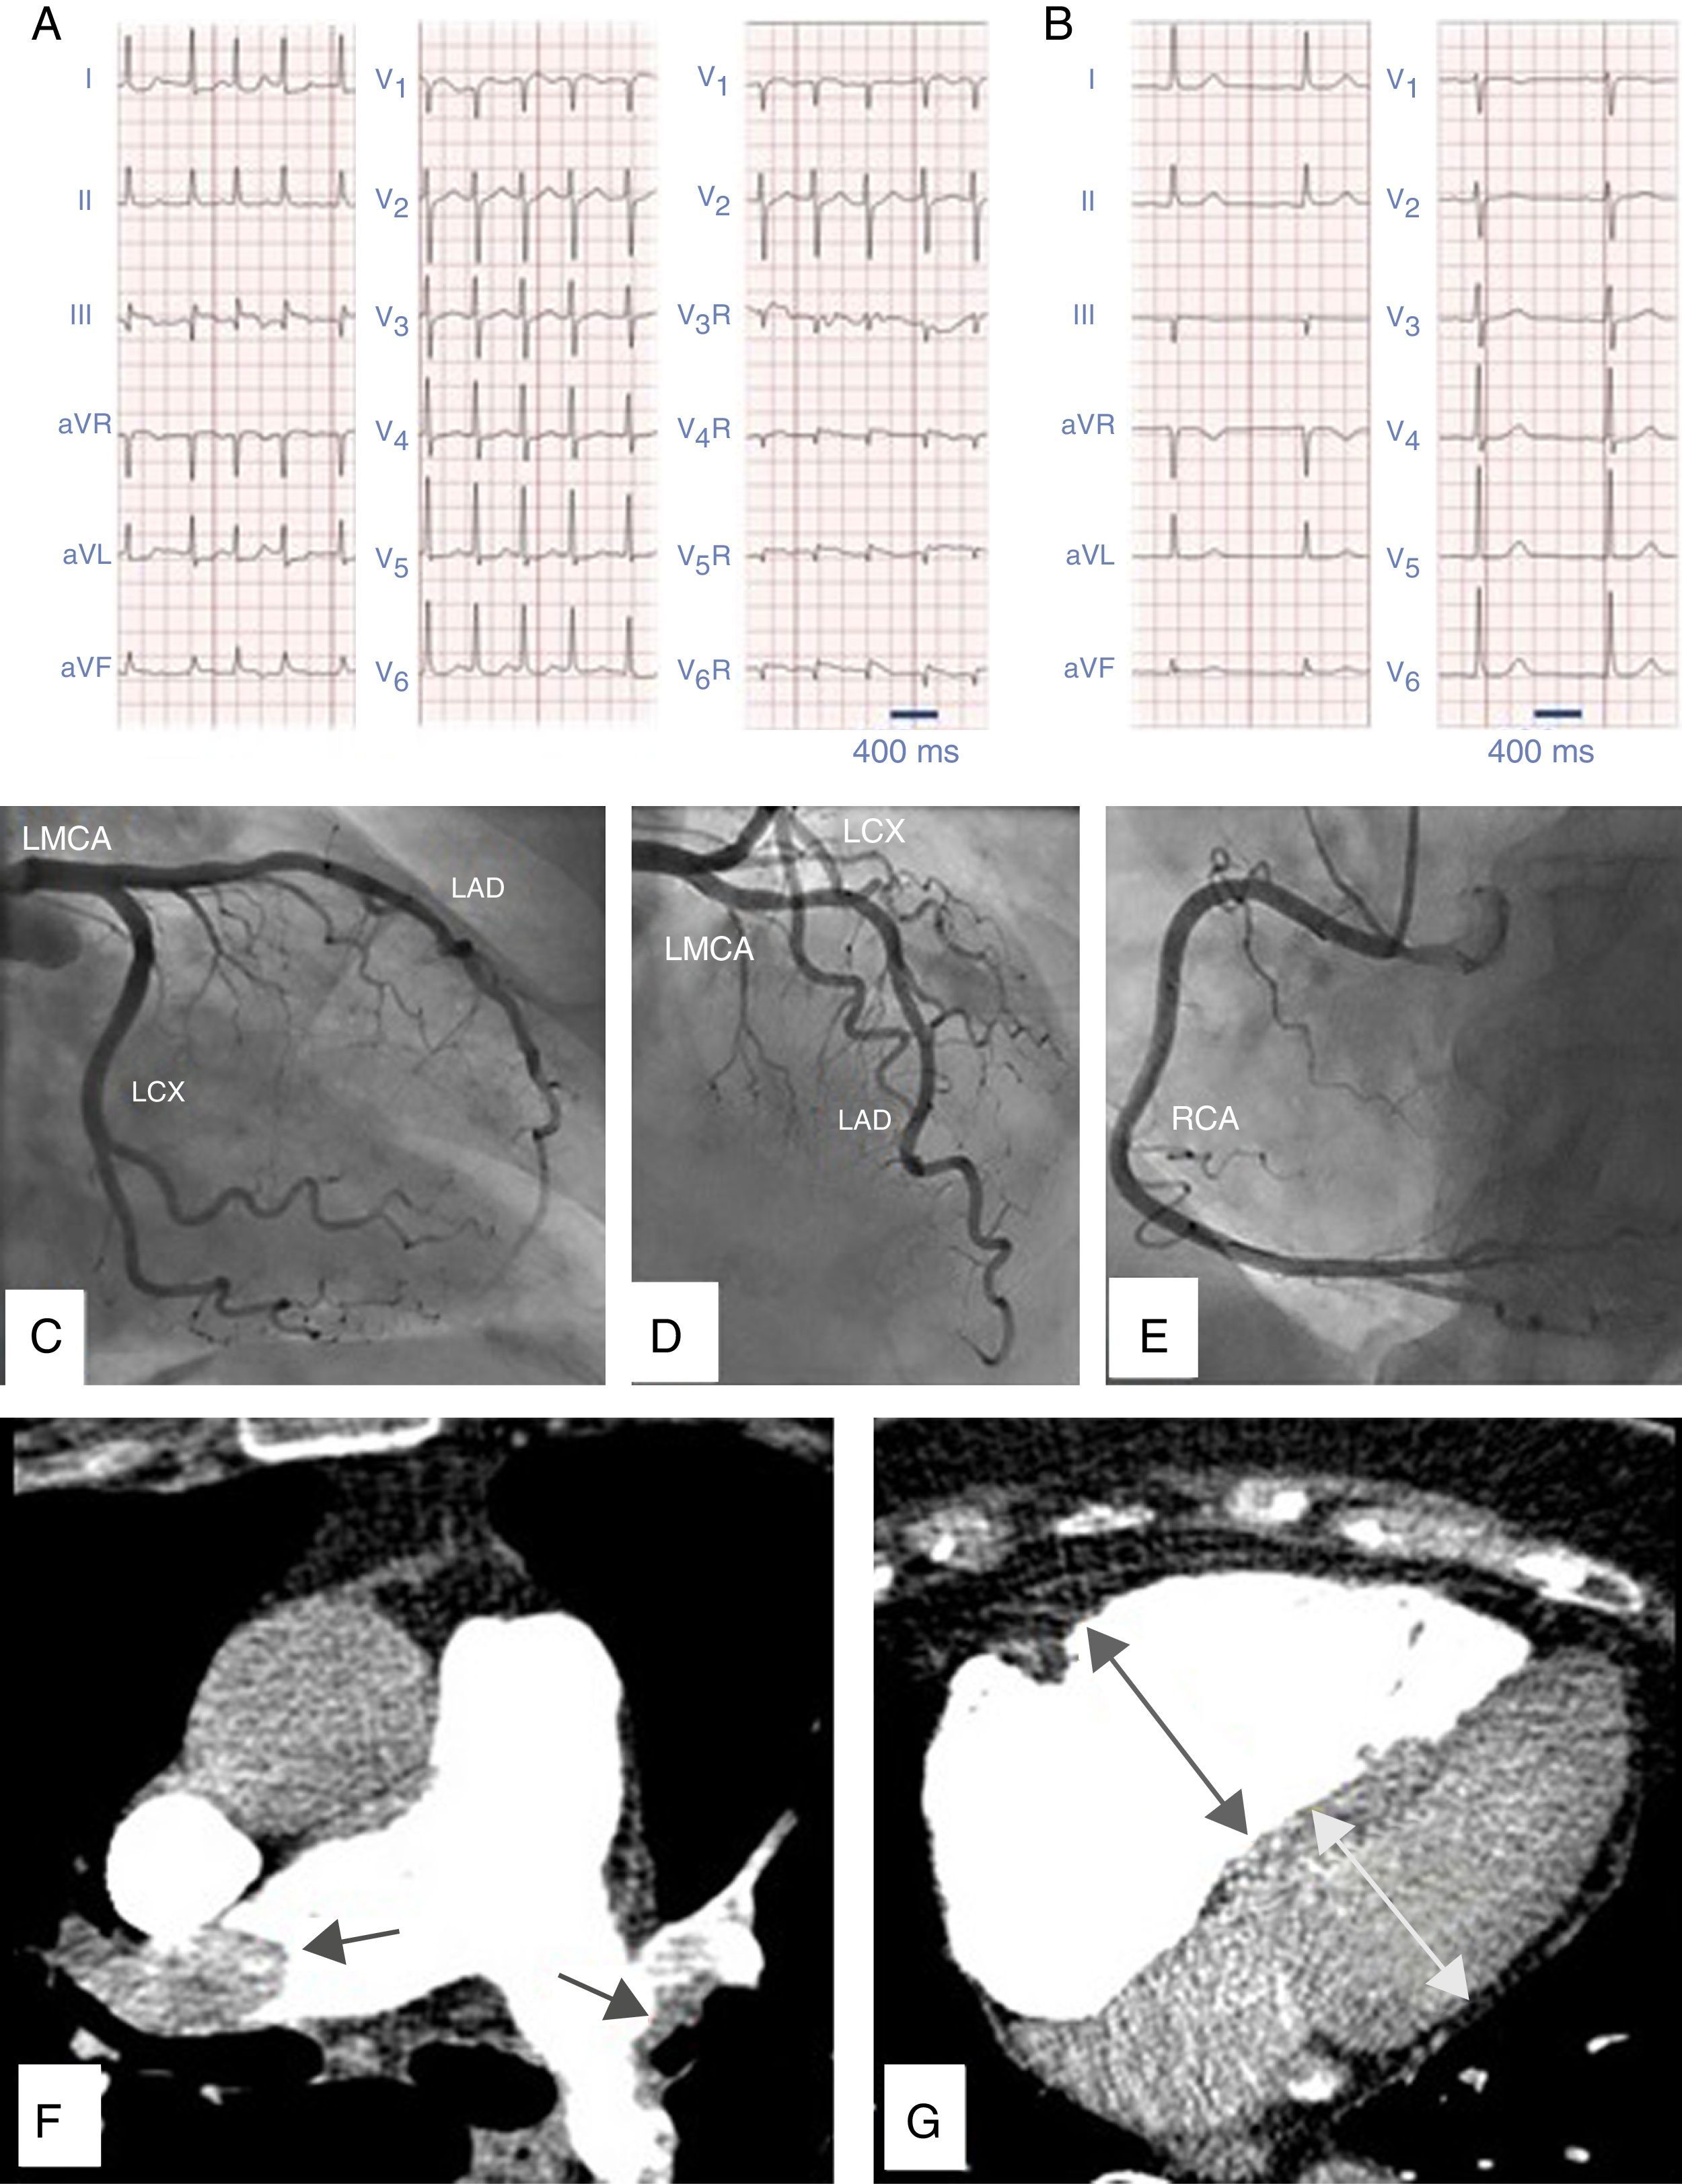
A 78-year-old woman with hypertension and obesity presented in the emergency department with a 2-day history of intermittent and oppressive chest pain. Electrocardiogram (ECG) showed ST-segment elevation in inferior and right chest leads suggestive of inferior myocardial infarction with right ventricular (RV) involvement (Fig. 1A). Previous ECG was normal (Fig. 1B). She underwent emergency catheterization, but no coronary occlusion was detected (Fig. 1C, D and E). In view of concomitant dyspnea and hypoxemia, D-dimer testing was ordered: results were elevated, at around 24000pg/dL. Pulmonary angiography confirmed the suspected diagnosis of acute pulmonary embolism (PE) (Fig. 1F) with RV hypertrophy (Fig. 1G). Treatment began with unfractionated heparin and symptoms consequently improved.
 Twelve-lead electrocardiogram in atrial fibrillation showing ST-segment elevation in leads III, AVF, AVR and V1 with ST-segment depression in I and AVL indicating inferior myocardial infarction. There is also ST-segment elevation in right precordial chest leads V4R, V5R and V6R demonstrating right ventricular involvement. (B) Twelve-lead electrocardiogram some months before, in sinus rhythm, with no ST-segment disturbances. (C) Coronary angiography with no significant lesions in left circumflex coronary artery (LCX), (D) left main coronary artery (LMCA), left anterior descending artery (LAD). (E) right coronary artery (RCA). (F) CT-pulmonary angiography revealing bilateral pulmonary embolism. (G) CT-pulmonary angiography with dilated right ventricle.")
(A) Twelve-lead electrocardiogram in atrial fibrillation showing ST-segment elevation in leads III, AVF, AVR and V1 with ST-segment depression in I and AVL indicating inferior myocardial infarction. There is also ST-segment elevation in right precordial chest leads V4R, V5R and V6R demonstrating right ventricular involvement. (B) Twelve-lead electrocardiogram some months before, in sinus rhythm, with no ST-segment disturbances. (C) Coronary angiography with no significant lesions in left circumflex coronary artery (LCX), (D) left main coronary artery (LMCA), left anterior descending artery (LAD). (E) right coronary artery (RCA). (F) CT-pulmonary angiography revealing bilateral pulmonary embolism. (G) CT-pulmonary angiography with dilated right ventricle.
PE is a life-threatening condition, which is sometimes difficult to diagnose due to a non-specific clinical presentation. A high index of suspicion is therefore essential, and all past medical history, current symptoms and results of medical tests must be taken into account.
We report here a well-documented sequence of imaging tests, leading to a successful clinical outcome. We aim to help readers recognize similar cases in the future, especially when acute coronary syndrome is suspected. Several ECG patterns have been related to PE,1 but presentation with concomitant ST-segment elevation in both inferior and right chest leads is extremely rare.
Please cite this article as: García-Ropero Á, Navas Lobato MA, Farré Muncharaz J. Correlación entre las pruebas de imagen de una paciente con embolismo pulmonar agudo que imitaba un infarto de miocardio inferior con extensión ventricular derecha. Arch Bronconeumol. 2016;52:487–488.


