
Bronchiectasis is frequently associated with various comorbidities, including pulmonary hypertension (PH), which is quite common.1 PH related to chronic lung disease and/or hypoxia is classified as group 3 PH and is typically characterized by a mild to moderate elevation in mean pulmonary arterial pressure (mPAP), ranging from 21 to 34mmHg via right heart catheterization (RHC).2,3 Emerging evidence suggests that severe PH within this group signifies a distinct and more aggressive pulmonary vascular phenotype, leading to worse outcomes.3,4 This has raised the possibility that pulmonary arterial hypertension (PAH)-targeted therapy could be beneficial, making accurate detection of severe PH in bronchiectasis critical for treatment.
While RHC remains the definitive diagnostic tool for PH, its invasive nature has prompted the exploration of noninvasive diagnostic alternatives. Echocardiography, the pulmonary artery (PA) to ascending aorta (Ao) diameter ratio (PA/Ao) on chest computed tomography (CT), and N-terminal pro-brain natriuretic peptide (NT-proBNP) levels have been investigated for their potential to predict severe PH risk in patients with chronic obstructive pulmonary disease (COPD) and interstitial lung disease (ILD).5,6 Patients identified as high-risk for PH through these methods should be referred to specialized centers for more detailed evaluation. However, these noninvasive methods have not yet been investigated for predicting severe PH in bronchiectasis patients.
Research on the prognostic impact of PH, especially severe PH in bronchiectasis patients, is limited. One study indicated worse hypoxemia and survival rates in bronchiectasis patients with PH,7 while another study found no significant survival difference despite high mPAP levels. Intriguingly, PAH-specific treatments have shown to significantly reduce systolic PAP (sPAP).8 The inconsistent findings regarding the influence of PH on mortality, as opposed to other conditions like COPD and ILD, necessitate further research to understand pulmonary vascular involvement and the efficacy of PAH-targeted therapies in bronchiectasis.
In order to assess the impact of pulmonary vascular disease severity on mortality in bronchiectasis patients, we conducted a retrospective observational study on bronchiectasis patients who underwent RHC for suspected PH at our hospital from June 2014 to September 2021. The Ethics Committee of Shanghai Pulmonary Hospital approved the study (Approval No. K22-345). Our cohort included adults (≥18 years) with bronchiectasis confirmed by chest CT within one year before RHC. We collected data on mortality and lung transplantation of included patients until May 31, 2022. Following the 2022 ESC/ERS guidelines for PH,2 we categorized patients with bronchiectasis and no other identifiable cause for PH into Group 3 PH. Our final analysis focused on patients with Group 3 PH and those without PH according to RHC findings.
Information on age, sex, body mass index, smoking history, comorbidities, arterial partial pressures of oxygen (PaO2) and carbon dioxide (PaCO2), NT-proBNP levels, and WHO Functional Class at the time of initial RHC were recorded. Lung function results were documented within one year of RHC. Two independent reviewers measured PA and Ao diameters on chest CT scans, calculating the PA/Ao ratio with excellent inter-rater reliability (intra-class correlation coefficient of 0.931). The Reiff score assessed radiological bronchiectasis severity, while echocardiography estimated sPAP. Patients with unmeasurable sPAP were presumed to have normal pressures.
Hemodynamic parameters from RHC defined PH severity: severe PH was mPAP>20mmHg with pulmonary vascular resistance (PVR)>5 Wood units, while non-severe PH had mPAP>20mmHg with PVR≤5 Wood units. Absence of PH was recorded for mPAP≤20mmHg. PAH-targeted therapy prescriptions were also noted. Both echocardiography and RHC were performed in accordance with the standard protocols established in our hospital, as has been previously reported.8
Statistical analyses included t-tests, Mann–Whitney U tests, and Chi-squared tests for group comparisons. Logistic regression identified severe PH predictors, with significant variables or clinical relevance included in a multivariate model following recent journal editor recommendations for causal inference.9 ROC curves determined severe PH prediction cutoffs. Cox regression assessed the impact of PH severity on survival, adjusting for age and sex. Survival time was calculated from RHC to death or lung transplantation. Significance was set at P<0.05, using SPSS, R software, and GraphPad Prism for analysis.
We assessed 172 bronchiectasis patients who had undergone RHC, of whom 135 met the criteria for Group 3 PH or non-PH and were included to investigate predictors of severe PH. Data from 113 patients were used to assess the impact of hemodynamic severity on survival (Fig. 1A).
![(A–E): A: Patient flow chart. HRCT=high-resolution computed tomography; B: A Histogram is presented showing the probability of severe pulmonary hypertension in patients with bronchiectasis who fulfill zero to two criteria: a plasma NT-proBNP≥1392pg/ml and the main pulmonary artery to the ascending aorta diameter ratio (at the tubular site on chest HRCT scan) ≥1.085. The proportion of patients who fulfill zero, one and two criteria are also presented; C: Receiver operating characteristics (ROC) curve for assessing the accuracy of the combination of noninvasive clinical parameters in predicting severe pulmonary hypertension confirmed by right heart catheterization in bronchiectasis: PA to Ao ratio ≥1.085, AUC 0.752, 95% CI: 0.671–0.823, P<0.0001; plasma NT-proBNP≥1392pg/ml: AUC 0.758, 95% CI: 0.677–0.828, P<0.0001; combination of both parameters: AUC 0.802, 95% CI: 0.726–0.878, P<0.0001; D: Survival curves (Kaplan–Meier) for bronchiectasis patients with no PH, non-severe PH and severe PH after adjusted for age and sex (severe PH versus no PH: hazard ratio [HR] 2.73, 95% CI: 0.79–9.40, P=0.11; non-severe PH versus no PH: HR 1.64, 95% CI: 0.48–5.61, P=0.43); E: PH-related survival curves (Kaplan–Meier) for bronchiectasis patients with severe PH, and non-severe PH and no PH after adjusted for age and sex (severe PH versus non-severe PH and no PH: HR 2.19, 95% CI: 1.10–4.38; P=0.027).](https://static.elsevier.es/multimedia/03002896/0000006000000007/v1_202407021853/S0300289624000735/v1_202407021853/en/main.assets/gr1.jpeg?xkr=ue/ImdikoIMrsJoerZ+w9zfHQrK7O1GixshFj/RYvvhfIeFLIshOrwnoGDwJytw3P/oiFcT3h6qa0s2Be593HlCxeWQtHrYqAquG5rKxCvRPjezb2qw02GxbN4V6GHvzABKjkOw/HZWE9jeawgO6vota1sSqynM/XKhIRFoX0zuO+453IO1LHS7+pZ7mWw4iiUk3Yu8ehVNrbrEWHLbPy1zvh3ak+Z4rAm0twhD0NR4MfgdHO9gn5ZjzlAAfzhGIy02uvdQ3cjauwvxyARBDEwhUS8HlL7AsiHqzEA1UxUI= "(A–E): A: Patient flow chart. HRCT=high-resolution computed tomography; B: A Histogram is presented showing the probability of severe pulmonary hypertension in patients with bronchiectasis who fulfill zero to two criteria: a plasma NT-proBNP≥1392pg/ml and the main pulmonary artery to the ascending aorta diameter ratio (at the tubular site on chest HRCT scan) ≥1.085. The proportion of patients who fulfill zero, one and two criteria are also presented; C: Receiver operating characteristics (ROC) curve for assessing the accuracy of the combination of noninvasive clinical parameters in predicting severe pulmonary hypertension confirmed by right heart catheterization in bronchiectasis: PA to Ao ratio ≥1.085, AUC 0.752, 95% CI: 0.671–0.823, P<0.0001; plasma NT-proBNP≥1392pg/ml: AUC 0.758, 95% CI: 0.677–0.828, P<0.0001; combination of both parameters: AUC 0.802, 95% CI: 0.726–0.878, P<0.0001; D: Survival curves (Kaplan–Meier) for bronchiectasis patients with no PH, non-severe PH and severe PH after adjusted for age and sex (severe PH versus no PH: hazard ratio [HR] 2.73, 95% CI: 0.79–9.40, P=0.11; non-severe PH versus no PH: HR 1.64, 95% CI: 0.48–5.61, P=0.43); E: PH-related survival curves (Kaplan–Meier) for bronchiectasis patients with severe PH, and non-severe PH and no PH after adjusted for age and sex (severe PH versus non-severe PH and no PH: HR 2.19, 95% CI: 1.10–4.38; P=0.027).")
(A–E): A: Patient flow chart. HRCT=high-resolution computed tomography; B: A Histogram is presented showing the probability of severe pulmonary hypertension in patients with bronchiectasis who fulfill zero to two criteria: a plasma NT-proBNP≥1392pg/ml and the main pulmonary artery to the ascending aorta diameter ratio (at the tubular site on chest HRCT scan) ≥1.085. The proportion of patients who fulfill zero, one and two criteria are also presented; C: Receiver operating characteristics (ROC) curve for assessing the accuracy of the combination of noninvasive clinical parameters in predicting severe pulmonary hypertension confirmed by right heart catheterization in bronchiectasis: PA to Ao ratio ≥1.085, AUC 0.752, 95% CI: 0.671–0.823, P<0.0001; plasma NT-proBNP≥1392pg/ml: AUC 0.758, 95% CI: 0.677–0.828, P<0.0001; combination of both parameters: AUC 0.802, 95% CI: 0.726–0.878, P<0.0001; D: Survival curves (Kaplan–Meier) for bronchiectasis patients with no PH, non-severe PH and severe PH after adjusted for age and sex (severe PH versus no PH: hazard ratio [HR] 2.73, 95% CI: 0.79–9.40, P=0.11; non-severe PH versus no PH: HR 1.64, 95% CI: 0.48–5.61, P=0.43); E: PH-related survival curves (Kaplan–Meier) for bronchiectasis patients with severe PH, and non-severe PH and no PH after adjusted for age and sex (severe PH versus non-severe PH and no PH: HR 2.19, 95% CI: 1.10–4.38; P=0.027).
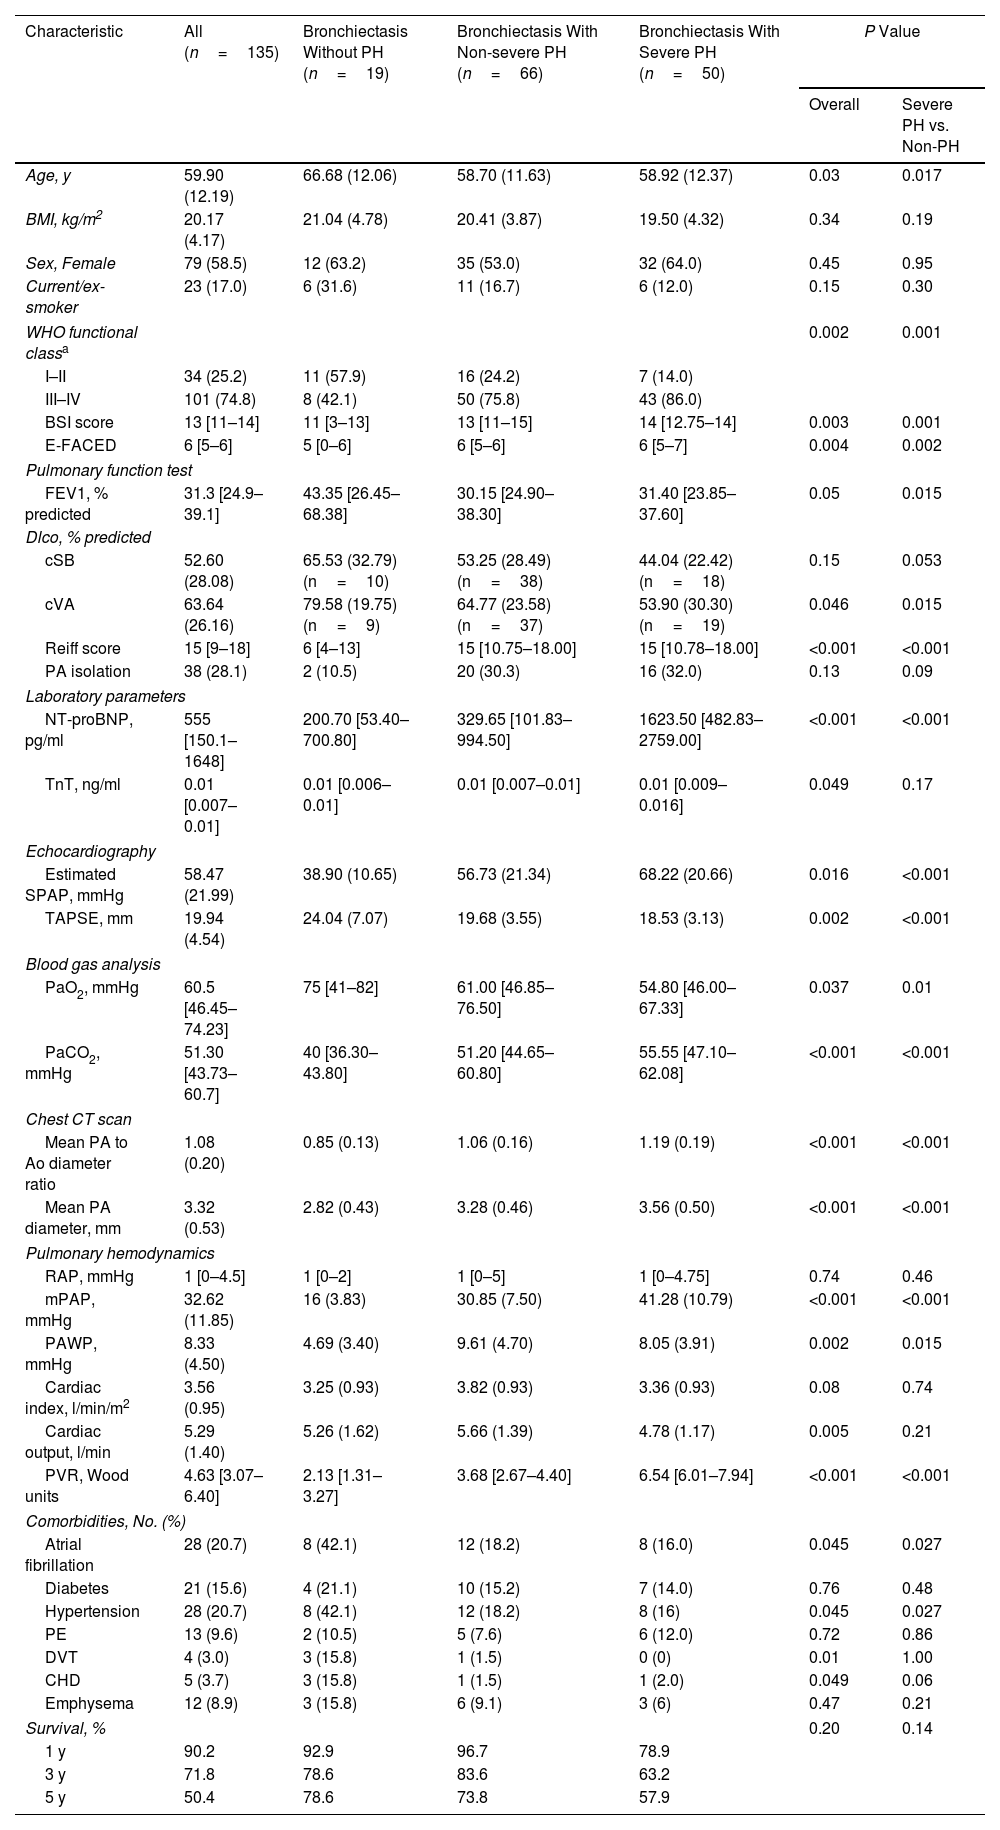
The cohort had an average age of 60.5 years, with 58.5% being female. Of the patients, 14.1% had no PH, 44.4% had non-severe PH, and 41.5% had severe PH. Patients with severe PH were generally younger and presented lower FEV1% predicted value, DLco% predicted value, and PaO2 but higher plasma NT-proBNP levels, sPAP as estimated by echocardiography, PaCO2, PA/Ao ratio on chest CT images, mPAP, PVR, and Reiff scores than those without severe PH, as summarized in Table 1.
Characteristics for Patients with Bronchiectasis Without PH, Non-severe PH, and With Severe PH (n=135).
| Characteristic | All (n=135) | Bronchiectasis Without PH (n=19) | Bronchiectasis With Non-severe PH (n=66) | Bronchiectasis With Severe PH (n=50) | P Value | |
|---|---|---|---|---|---|---|
| Overall | Severe PH vs. Non-PH | |||||
| Age, y | 59.90 (12.19) | 66.68 (12.06) | 58.70 (11.63) | 58.92 (12.37) | 0.03 | 0.017 |
| BMI, kg/m2 | 20.17 (4.17) | 21.04 (4.78) | 20.41 (3.87) | 19.50 (4.32) | 0.34 | 0.19 |
| Sex, Female | 79 (58.5) | 12 (63.2) | 35 (53.0) | 32 (64.0) | 0.45 | 0.95 |
| Current/ex-smoker | 23 (17.0) | 6 (31.6) | 11 (16.7) | 6 (12.0) | 0.15 | 0.30 |
| WHO functional classa | 0.002 | 0.001 | ||||
| I–II | 34 (25.2) | 11 (57.9) | 16 (24.2) | 7 (14.0) | ||
| III–IV | 101 (74.8) | 8 (42.1) | 50 (75.8) | 43 (86.0) | ||
| BSI score | 13 [11–14] | 11 [3–13] | 13 [11–15] | 14 [12.75–14] | 0.003 | 0.001 |
| E-FACED | 6 [5–6] | 5 [0–6] | 6 [5–6] | 6 [5–7] | 0.004 | 0.002 |
| Pulmonary function test | ||||||
| FEV1, % predicted | 31.3 [24.9–39.1] | 43.35 [26.45–68.38] | 30.15 [24.90–38.30] | 31.40 [23.85–37.60] | 0.05 | 0.015 |
| Dlco, % predicted | ||||||
| cSB | 52.60 (28.08) | 65.53 (32.79) (n=10) | 53.25 (28.49) (n=38) | 44.04 (22.42) (n=18) | 0.15 | 0.053 |
| cVA | 63.64 (26.16) | 79.58 (19.75) (n=9) | 64.77 (23.58) (n=37) | 53.90 (30.30) (n=19) | 0.046 | 0.015 |
| Reiff score | 15 [9–18] | 6 [4–13] | 15 [10.75–18.00] | 15 [10.78–18.00] | <0.001 | <0.001 |
| PA isolation | 38 (28.1) | 2 (10.5) | 20 (30.3) | 16 (32.0) | 0.13 | 0.09 |
| Laboratory parameters | ||||||
| NT-proBNP, pg/ml | 555 [150.1–1648] | 200.70 [53.40–700.80] | 329.65 [101.83–994.50] | 1623.50 [482.83–2759.00] | <0.001 | <0.001 |
| TnT, ng/ml | 0.01 [0.007–0.01] | 0.01 [0.006–0.01] | 0.01 [0.007–0.01] | 0.01 [0.009–0.016] | 0.049 | 0.17 |
| Echocardiography | ||||||
| Estimated SPAP, mmHg | 58.47 (21.99) | 38.90 (10.65) | 56.73 (21.34) | 68.22 (20.66) | 0.016 | <0.001 |
| TAPSE, mm | 19.94 (4.54) | 24.04 (7.07) | 19.68 (3.55) | 18.53 (3.13) | 0.002 | <0.001 |
| Blood gas analysis | ||||||
| PaO2, mmHg | 60.5 [46.45–74.23] | 75 [41–82] | 61.00 [46.85–76.50] | 54.80 [46.00–67.33] | 0.037 | 0.01 |
| PaCO2, mmHg | 51.30 [43.73–60.7] | 40 [36.30–43.80] | 51.20 [44.65–60.80] | 55.55 [47.10–62.08] | <0.001 | <0.001 |
| Chest CT scan | ||||||
| Mean PA to Ao diameter ratio | 1.08 (0.20) | 0.85 (0.13) | 1.06 (0.16) | 1.19 (0.19) | <0.001 | <0.001 |
| Mean PA diameter, mm | 3.32 (0.53) | 2.82 (0.43) | 3.28 (0.46) | 3.56 (0.50) | <0.001 | <0.001 |
| Pulmonary hemodynamics | ||||||
| RAP, mmHg | 1 [0–4.5] | 1 [0–2] | 1 [0–5] | 1 [0–4.75] | 0.74 | 0.46 |
| mPAP, mmHg | 32.62 (11.85) | 16 (3.83) | 30.85 (7.50) | 41.28 (10.79) | <0.001 | <0.001 |
| PAWP, mmHg | 8.33 (4.50) | 4.69 (3.40) | 9.61 (4.70) | 8.05 (3.91) | 0.002 | 0.015 |
| Cardiac index, l/min/m2 | 3.56 (0.95) | 3.25 (0.93) | 3.82 (0.93) | 3.36 (0.93) | 0.08 | 0.74 |
| Cardiac output, l/min | 5.29 (1.40) | 5.26 (1.62) | 5.66 (1.39) | 4.78 (1.17) | 0.005 | 0.21 |
| PVR, Wood units | 4.63 [3.07–6.40] | 2.13 [1.31–3.27] | 3.68 [2.67–4.40] | 6.54 [6.01–7.94] | <0.001 | <0.001 |
| Comorbidities, No. (%) | ||||||
| Atrial fibrillation | 28 (20.7) | 8 (42.1) | 12 (18.2) | 8 (16.0) | 0.045 | 0.027 |
| Diabetes | 21 (15.6) | 4 (21.1) | 10 (15.2) | 7 (14.0) | 0.76 | 0.48 |
| Hypertension | 28 (20.7) | 8 (42.1) | 12 (18.2) | 8 (16) | 0.045 | 0.027 |
| PE | 13 (9.6) | 2 (10.5) | 5 (7.6) | 6 (12.0) | 0.72 | 0.86 |
| DVT | 4 (3.0) | 3 (15.8) | 1 (1.5) | 0 (0) | 0.01 | 1.00 |
| CHD | 5 (3.7) | 3 (15.8) | 1 (1.5) | 1 (2.0) | 0.049 | 0.06 |
| Emphysema | 12 (8.9) | 3 (15.8) | 6 (9.1) | 3 (6) | 0.47 | 0.21 |
| Survival, % | 0.20 | 0.14 | ||||
| 1 y | 90.2 | 92.9 | 96.7 | 78.9 | ||
| 3 y | 71.8 | 78.6 | 83.6 | 63.2 | ||
| 5 y | 50.4 | 78.6 | 73.8 | 57.9 | ||
Data are presented as No. (%) or mean (standardized deviation) or median (interquartile range). Ao=ascending aorta; BMI=body-mass index; CHD=chronic heart disease; COPD=chronic obstructive pulmonary disease; CT=computed tomography; CTD=connective tissue disease; cSB=single breath corrected for hemoglobin; cVA=alveolar volume corrected for hemoglobin; DLco=diffusion capacity of lung for carbon monoxide; DVT=deep vein thrombosis; mPAP=mean pulmonary arterial pressure; NT-proBNP=N-terminal pro-brain natriuretic peptide; PA=pulmonary artery; PaO2=partial pressure of oxygen; PaCO2=partial pressure of carbon dioxide; PAWP=pulmonary arterial wedge pressure; PE=pulmonary embolism; PH=pulmonary hypertension; PVR=pulmonary vascular resistance; SPAP=systolic pulmonary arterial pressure; TAPSE=tricuspid annular plane systolic excursion; WHO=World Health Organization; y=year.
The multivariate model identified two independent predictors of severe PH: the PA/Ao ratio on chest CT images and plasma NT-proBNP levels, with respective cutoff values being set at ≥1.085 and ≥1392pg/ml. Patients meeting both criteria had a 75.8% probability of severe PH, whereas those meeting neither had only a 10.5% chance (Fig. 1B). The combined indicators’ AUC was 0.802 (95% CI: 0.726–0.878), suggesting a better predictive value than each alone despite statistically insignificant (Fig. 1C).
By May 31, 2022, 22 patients (16.3%) were lost to follow-up; 34 (25.2%) died; and two (1.5%) underwent lung transplantation. Median time to the composite endpoint outcome was 1.6 years. Regarding the causes of death or lung transplantation, 32 were classified as PH-related (88.9%) and 4 were classified as “other” (11.1%).
Patients with severe PH showed an increased trend toward all-cause mortality compared to those without PH after adjusting for age and sex (hazard ratio [HR] 2.73, 95% CI: 0.79–9.40, P=0.11); this trend was also noted among those with non-severe PH (HR 1.64, 95% CI: 0.48–5.61, P=0.43), as depicted in Fig. 1D. Interestingly, severe PH was associated with increased PH related mortality or lung transplantation (HR 2.19, 95% CI: 1.10–4.38; P=0.027) compared to non-severe PH and no PH after adjustment for the age and sex (Fig. 1E). Phosphodiesterase type 5 inhibitors were prescribed more frequently to patients with severe PH than those with non-severe PH (38% vs. 13.6%, P<0.001). Although individuals receiving PAH-targeted treatment had worse baseline hemodynamics than untreated patients, no significant difference in overall survival time was observed across the entire population or specifically among those with severe PH.
To our knowledge, this study represents the most comprehensive analysis to date of the clinical features, noninvasive predictors, and outcomes associated with severe PH in patients with bronchiectasis. Our data suggest that individuals with severe PH tend to be younger, present with more severe disease as measured by the bronchiectasis severity index, more pronounced hypoxemia and reduced diffuse capacity compared to those without. Two significant clinical predictors have been identified: a plasma NT-proBNP≥1392pg/ml and a PA/Ao ratio ≥1.085 on chest HRCT, which together provide a reliable indication of severe PH. The identification of severe PH by RHC is associated with a trend toward an increased risk of mortality.
Currently, there are no established noninvasive screening methods for severe PH in bronchiectasis. Our study identified two key clinical predictors: a plasma NT-proBNP level ≥1392pg/ml and a PA/Ao ratio ≥1.085. Given that chest CT is the gold standard for diagnosing bronchiectasis,10 measuring the PA/Ao ratio presents an appealing option for screening patients in a clinical setting without subjecting them to the rigors of a chest CT examination. The combination of plasma NT-proBNP level and the PA/Ao ratio provides a reliable, non-invasive method to identify patients with severe PH associated with bronchiectasis who should be referred for RHC evaluation.
Previous research on the impact of PH on mortality in bronchiectasis has been inconclusive, with some studies suggesting an association with increased mortality and others finding no difference in survival rates.1,7,8 Our study, adhering to the recent ERS/ESC PH guidelines for classifying the severity of PH, observed a trend toward reduced survival in patients with both severe and non-severe PH. However, this difference did not reach statistical significance, which may be attributed to our small sample size, particularly in the group with no PH (n=19). The variability in findings across studies may be due to several factors, including how patients were selected, the definitions and levels of PH severity used, the presence of different comorbidities, and the types of treatment interventions administered. Despite these inconsistencies, the trend we observed highlights the need for thorough screening for severe PH in at-risk patients. Interestingly, we noted that PAH-specific medications were more frequently initiated in patients with severe PH compared to those with non-severe PH (38% vs. 13.66%). Survival rates between patients treated with PAH medications and those not treated were similar, despite the former group having more severe pulmonary hemodynamics and diffusion capacity impairments. Therefore, potential benefits from PAH-targeted therapies in bronchiectasis with severe PH still merit further investigation through randomized controlled trials.
Our findings should be interpreted with caution due to the retrospective design, single-center setting, and small sample size which may limit generalizability. Additionally, incomplete data on DLco% of predicted value and the lack of assessment of other mortality risk factors within the bronchiectasis population are limitations.
In conclusion, our research highlights specific clinical indicators that may assist in identifying severe PH in bronchiectasis patients. Although severe PH was associated with a trend toward higher mortality, further large-scale prospective studies are needed to confirm these findings and optimize treatment strategies.
Data Availability StatementThe data that support the findings of this study are available from the corresponding author upon reasonable request.
Human Ethics Approval DeclarationThis study was performed in accordance with the Declaration of Helsinki. Research ethics committee approval was obtained from the Shanghai Pulmonary Hospital Health Research Ethics Committee reference K22-345. Participant consent was not required because anonymous health claim data was used.
ContributorsConception and design of the study: YHG, JFX.
Data acquisition: YHG, JFX, YNZ, JWB, SL, LW, LW, SGG, HZZ.
Analysis of the data: YHG, JFX, YNZ, JWB, SL, LW, LW, SGG, HZZ.
YHG, YNZ, JWB, SL, LW and JFX drafted the initial manuscript. YHG, YNZ, JWB, SL, LW and JFX contributed to the data interpretation and edited the manuscript for important scientific content. All the authors agree to be accountable for all aspects of the work in regard to accuracy and integrity.
FundingThis work was supported by the National Natural Science Foundation of China (81925001 to JFX; 82270047 to YHG); Shanghai Pujiang Program (21PJD061 to YHG); the Innovation Program of Shanghai Municipal Education Commission (202101070007-E00097 to JFX); Program of Shanghai Municipal Science and Technology Commission (21DZ2201800 to JFX); Innovative research team of high-level local universities in Shanghai and Innovative team of Shanghai Pulmonary Hospital.
Conflicts of InterestAll authors declare no competing interests.


