

Asthma is an inflammatory disorder of the airways and the symptoms of asthma could be exacerbated by Mycoplasma pneumoniae infection. Interleukin-2 and interleukin-4 have been implicated in immune and inflammatory reactions. We examined the associations of IL2 and IL4 polymorphisms and expression with the risks of asthma and M. pneumoniae infection in children.
MethodsA total of 392 asthmatic children and 849 controls were recruited into the study. Eight polymorphisms in IL2 and IL4 were genotyped with Sequenom MassARRAY platform. M. pneumoniae infection and copy number was determined with fluorescence PCR. IL-2 and IL-4 serum expression levels were determined by using ELISA.
ResultsWe found a significant association of IL2 rs6534349 polymorphism with increased asthma risk (heterozygotes, P=.029; homozygous variants; P=.013) and of IL4 rs2227284 polymorphism with reduced asthma risk (heterozygotes, P=.026; homozygous variants; P=.001). Besides, the association of other polymorphisms, except rs2070874 polymorphism, became apparent when the asthmatic children were grouped according to GINA classification of asthma control and severity. In addition, IL-2 and IL-4 serum expression levels were significantly higher in M. pneumoniae negative (P=.038) and positive (P=.011) subjects respectively. This observation holds true among asthmatic patients (P=.016 for IL-2 and P=.042 for IL-4), but only the IL-4 observation remained correct among non-asthmatic controls (P=.032). We also observed that the rs6534349 GG genotype was significantly associated with increased odds of getting high load M. pneumoniae infection (P=.0376).
ConclusionsIL2 and IL4 could be important biomarkers for estimating the risks of asthma and M. pneumoniae infection in children.
El asma es una afección inflamatoria de las vías respiratorias. Las infecciones por Mycoplasma pneumoniae pueden exacerbar los síntomas del asma. Se ha demostrado que la interleucina 2 y la interleucina 4 participan en las reacciones inmunitarias e inflamatorias. Hemos estudiado la relación entre los polimorfismos de la IL2 y la IL4 y su expresión y el riesgo de padecer asma e infección por M. pneumoniae en niños.
MétodosSe reclutó a 392 niños asmáticos y 849 controles para el estudio. Se genotiparon 8 polimorfismos en IL2 e IL4 con la plataforma MassARRAY de Sequenom. La infección por M. pneumoniae y el número de copias se establecieron mediante PCR fluorescente. Los niveles séricos de expresión de IL-2 e IL-4 se midieron con ELISA.
ResultadosHallamos una relación significativa entre el polimorfismo rs6534349 de IL2 y el aumento de riesgo de sufrir asma (heterocigóticos, p=0,029; variantes homocigóticas, p=0,013), así como entre el polimorfismo rs2227284 de IL4 y una reducción del riesgo de padecer asma (heterocigóticos, p=0,026; variantes homocigóticas, p=0,001). Además, la relación con otros polimorfismos, excepto el rs2070874, se hizo evidente al agrupar a los niños asmáticos según la clasificación GINA de control y gravedad del asma. Asimismo, los niveles séricos de expresión de IL-2 e IL-4 fueron significativamente mayores en los sujetos no infectados (p=0,038) e infectados (p=0,011) por M. pneumoniae, respectivamente. Esta observación también se cumple entre los pacientes asmáticos (p=0,016 para IL-2 y p=0,042 para IL-4), pero en los controles no asmáticos solo se cumple en el caso de la IL-4 (p=0,032). Del mismo modo, observamos que el genotipo GG rs6534349 estaba claramente relacionado con un aumento de las posibilidades de tener una infección con alta carga de M. pneumoniae (p=0,0376).
ConclusionesLa IL2 y la IL4 podrían ser biomarcadores importantes para calcular el riesgo de padecer asma, así como infección por M. pneumoniae, en niños.
Asthma is a complex chronic inflammatory disease of the airways characterized by airflow obstruction and hyperresponsiveness. In children, asthma arises principally from allergic inflammation, and can lead to varying degrees of airway obstruction, including but not limited to dyspnea, coughing, chest tightness, and recurrent episodes of wheezing. In China and the rest of the world, asthma in children represents a major public health concern in pediatric pulmonology, and the prevalence of childhood asthma increases every year.1,2
Mycoplasma pneumoniae is an important pathogen which has been primarily recognized as a causative agent of community-acquired pneumonia, especially among children.3 The link between M. pneumoniae infection and asthma was first suspected several decades ago.4 More recently, various lines of evidence have emerged and M. pneumoniae infection has been implicated in the onset and exacerbation of asthma.5,6M. pneumoniae infection damages respiratory epithelial cells, thus increasing airway reactivity and resulting in the activation of a large number of T cells.7 T cells trigger the activation of B cells, which produce antibodies and release inflammatory cytokines, which in turn contribute to the development of asthma-related symptoms.
Despite the complexity of the mechanisms underlying the onset of asthma, interleukins (ILs), especially IL-2 and IL-4, are known to play a central role in this process.8 IL-2 promotes the maturation of primitive T cells, while IL-4, through its complex interaction with IL-12, helps to determine whether T cells should differentiate into Th1 or Th2 cells, thus producing different types of cytokines.9 These events cause major pathophysiological changes during asthma, and therefore play a key role in the development of the disease. In addition, the important role of IL-2 and IL-4 in the adaptive immune system suggests that cytokines could affect the ability of immune cells to fight off M. pneumoniae infection. We therefore hypothesized that variations in IL-2 and IL-4 levels and function could be associated with the risk of asthma and M. pneumoniae infection.10,11 A potential factor which could influence the interindividual variation in IL-2 and IL-4 levels and function, and therefore the risk of asthma, is single nucleotide polymorphisms (SNPs) within the genes encoding the cytokines.12,13 In this study, we aimed to establish how SNPs in IL-2 and IL-4 genes may be associated with the risk of asthma in children. In particular, we addressed the rs6822844, rs6534349, rs2069762 and rs3136534 polymorphisms of IL-2, and rs2243250, rs2070874, rs2227284 and rs2243290 polymorphisms of IL-4. We also aimed to investigate the presence of differential serum expression levels of IL-2 and IL-4 in M. pneumoniae-positive and negative subjects, and to examine the relationship between SNPs and the risk of high-load M. pneumoniae infection.
MethodsSubjectsThe study was approved by the ethics committee of the Yiwu Maternity and Child Care Hospital, Zhejiang (Ref. No: 2009/PED/0215.045). A total of 392 children with asthma and 849 non-asthmatic controls aged between 4 and 15 years old were recruited from the Yiwu Maternity and Child Care Hospital and the Children's Hospital of Zhejiang Province between March 2009 and October 2013. Asthma in children was ascertained by routine diagnosis based on the Global Initiative for Asthma (GINA) guidelines. Controls were children without asthma or allergic symptoms who visited the same hospitals for other medical problems unrelated to asthma. Among the controls, a total of 83 had stridor, 89 had foreign body aspiration, 80 had persistent cough, 66 underwent diagnosis for pulmonary infections, and 531 were healthy children who attended the hospital for follow-up after diagnosis of a transient respiratory infection. Controls and cases were matched by frequency in terms of gender and age. All subjects were of Chinese Han ethnicity. Informed consent was obtained from the parents of the participating subjects before inclusion in the study.
Detection of Mycoplasma pneumoniae InfectionDNA was extracted from respiratory specimens (throat swab, No.=528; bronchoalveolar lavage, No.=432; sputum specimens, No.=204; bronchial aspirate, No.=77) obtained from the subjects. Bronchoalveolar lavage was performed on 318 controls (i.e. those who had stridor, foreign body aspiration, persistent cough and who underwent diagnosis for pulmonary infections) as part of their diagnosis or treatment, and on 114 asthmatic children for identification of infectious agents, cytokines and cellular profiles (either for diagnostic purposes or as part of another ongoing research study). A single bronchoalveolar lavage was performed on each subject. Detection of Mycoplasma pneumoniae infection among the subjects was performed with fluorescence PCR Mycoplasma pneumoniae Detection Kit (Acon Biotech, Hangzhou, China), according to the manufacturer's instructions.
ELISA Quantification of IL-2 and IL-4Serum was isolated from the blood samples collected and diluted 1:4 in sample diluent before being used for ELISA quantification of IL-2 and IL-4. The serum IL-2 and IL-4 concentrations were determined with the Human Interleukin 2/IL-2 ELISA Kit and Human Interleukin 4/IL-4 ELISA Kit (Xinqidi Biological Technology Co. Ltd., Wuhan, China), which have a sensitivity of <0.40pg/ml and <0.20pg/ml respectively, according to the manufacturer's protocols.
SNP GenotypingDNA was isolated from subjects’ blood samples using TIANamp blood DNA kit (Tiangen Biotech, Beijing, China). Polymorphisms were genotyped on the DNA isolated using the Sequenom MassARRAY platform (Sequenom, San Diego, USA), according to the manufacturer's instructions. Genotyping was repeated in 10% of the samples for confirmation purposes. The reproducibility rate of the genotypes was 100%.
Statistical AnalysisThe distribution of genotypes in asthmatic children and non-asthmatic controls was compared using a χ2 test, and the association between the polymorphisms and asthma risk was evaluated by logistic regression analysis. To examine the relationship between polymorphisms and the risk of predisposition to high-load M. pneumoniae infection, the genotype distribution was compared using the χ2 test followed by logistic regression analysis. Expression of IL-2 and IL-4 in M. pneumoniae-positive and M. pneumoniae-negative patients was compared using a t-test to determine any significant difference in the expression between the two groups. For all analyses, P<.05 was considered significant.
ResultsSubjects Characteristics and M. pneumoniae InfectionCases and controls were frequency-matched in terms of gender and age. No significant differences were found for either gender (P=.99) or mean age (P=.98). Based on GINA classification, 177 cases were controlled asthma, 118 were partially controlled asthma and 97 were uncontrolled asthma. In addition, 102 were classified as severe, 80 moderate and 210 mild.
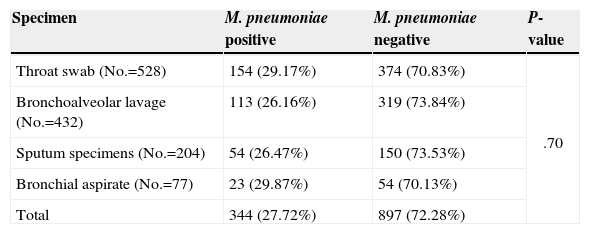
Detection of M. pneumoniae InfectionA total of 344 subjects tested positive for M. pneumoniae infection, of which 130 were children with asthma and 214 were non-asthmatic controls. Of the 897 M. pneumoniae-negative subjects, 262 were children with asthma and 635 were non-asthmatic controls. Table 1 shows the prevalence of M. pneumoniae detected in different types of specimens. The type of specimen used did not significantly affect the detection of M. pneumoniae (P=.70).
Detection of M. pneumoniae Infection Using Different Samples.
| Specimen | M. pneumoniae positive | M. pneumoniae negative | P-value |
|---|---|---|---|
| Throat swab (No.=528) | 154 (29.17%) | 374 (70.83%) | .70 |
| Bronchoalveolar lavage (No.=432) | 113 (26.16%) | 319 (73.84%) | |
| Sputum specimens (No.=204) | 54 (26.47%) | 150 (73.53%) | |
| Bronchial aspirate (No.=77) | 23 (29.87%) | 54 (70.13%) | |
| Total | 344 (27.72%) | 897 (72.28%) |
The number of bacterial copies in the M. pneumoniae-positive subjects ranged from 6.43×10³ to 6.48×10⁷organismsml−1, with a median and mean of 3.96×10⁵ and 1.67×10⁷organismsml−1, respectively. A total of 206 and 138 subjects had bacterial load lower and higher than mean, respectively.
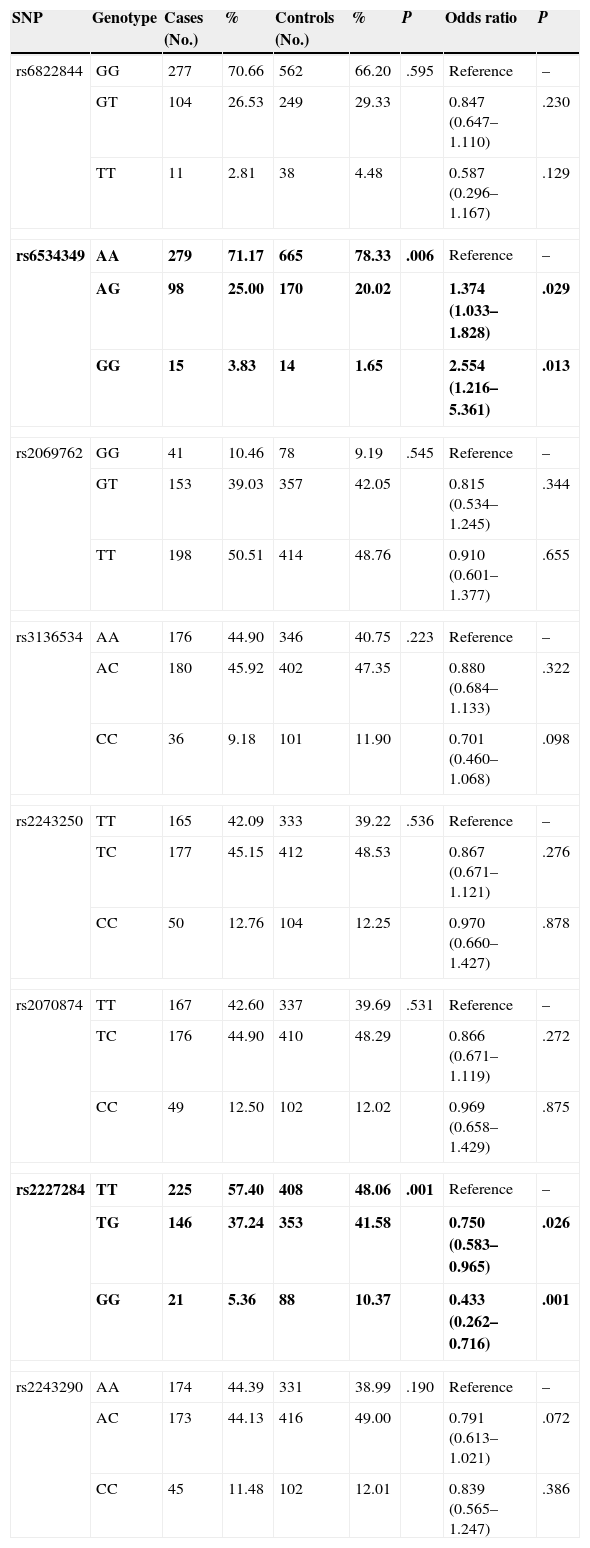
Genotype Distribution in Asthmatic Children and Healthy ControlsOf the 8 polymorphisms studied, significant differences between cases and controls were observed in only 2, namely rs6534349 polymorphism of IL-2 (P=.006) and rs2227284 polymorphism of IL-4 (P=.001) (Table 2). No deviation from Hardy-Weinberg equilibrium was observed for any of the 8 polymorphisms (P>.05).
Genotype Distribution and Risk Association in Asthmatic Children and Healthy Controls.
| SNP | Genotype | Cases (No.) | % | Controls (No.) | % | P | Odds ratio | P |
|---|---|---|---|---|---|---|---|---|
| rs6822844 | GG | 277 | 70.66 | 562 | 66.20 | .595 | Reference | – |
| GT | 104 | 26.53 | 249 | 29.33 | 0.847 (0.647–1.110) | .230 | ||
| TT | 11 | 2.81 | 38 | 4.48 | 0.587 (0.296–1.167) | .129 | ||
| rs6534349 | AA | 279 | 71.17 | 665 | 78.33 | .006 | Reference | – |
| AG | 98 | 25.00 | 170 | 20.02 | 1.374 (1.033–1.828) | .029 | ||
| GG | 15 | 3.83 | 14 | 1.65 | 2.554 (1.216–5.361) | .013 | ||
| rs2069762 | GG | 41 | 10.46 | 78 | 9.19 | .545 | Reference | – |
| GT | 153 | 39.03 | 357 | 42.05 | 0.815 (0.534–1.245) | .344 | ||
| TT | 198 | 50.51 | 414 | 48.76 | 0.910 (0.601–1.377) | .655 | ||
| rs3136534 | AA | 176 | 44.90 | 346 | 40.75 | .223 | Reference | – |
| AC | 180 | 45.92 | 402 | 47.35 | 0.880 (0.684–1.133) | .322 | ||
| CC | 36 | 9.18 | 101 | 11.90 | 0.701 (0.460–1.068) | .098 | ||
| rs2243250 | TT | 165 | 42.09 | 333 | 39.22 | .536 | Reference | – |
| TC | 177 | 45.15 | 412 | 48.53 | 0.867 (0.671–1.121) | .276 | ||
| CC | 50 | 12.76 | 104 | 12.25 | 0.970 (0.660–1.427) | .878 | ||
| rs2070874 | TT | 167 | 42.60 | 337 | 39.69 | .531 | Reference | – |
| TC | 176 | 44.90 | 410 | 48.29 | 0.866 (0.671–1.119) | .272 | ||
| CC | 49 | 12.50 | 102 | 12.02 | 0.969 (0.658–1.429) | .875 | ||
| rs2227284 | TT | 225 | 57.40 | 408 | 48.06 | .001 | Reference | – |
| TG | 146 | 37.24 | 353 | 41.58 | 0.750 (0.583–0.965) | .026 | ||
| GG | 21 | 5.36 | 88 | 10.37 | 0.433 (0.262–0.716) | .001 | ||
| rs2243290 | AA | 174 | 44.39 | 331 | 38.99 | .190 | Reference | – |
| AC | 173 | 44.13 | 416 | 49.00 | 0.791 (0.613–1.021) | .072 | ||
| CC | 45 | 11.48 | 102 | 12.01 | 0.839 (0.565–1.247) | .386 | ||
Significant risk association was only observed for the IL-2 rs6534349 and IL-4 rs2227284 polymorphisms (Table 2). For the IL-2 rs6534349 polymorphism, the heterozygous AG genotype and homozygous variant GG genotype resulted in a 1.374-fold (95% CI=1.033–1.828, P=.029) and a 2.554-fold (95% CI=1.216–5.361, P=.013) increase in risk, respectively. Heterozygous TG genotype of the IL-4 rs2227284 polymorphism, meanwhile, showed an odds ratio of 0.750 (95% CI=0.583–0.965, P=.026), while the homozygous GG genotype showed an odds ratio of 0.433 (95% CI=0.262–0.716, P=.001).
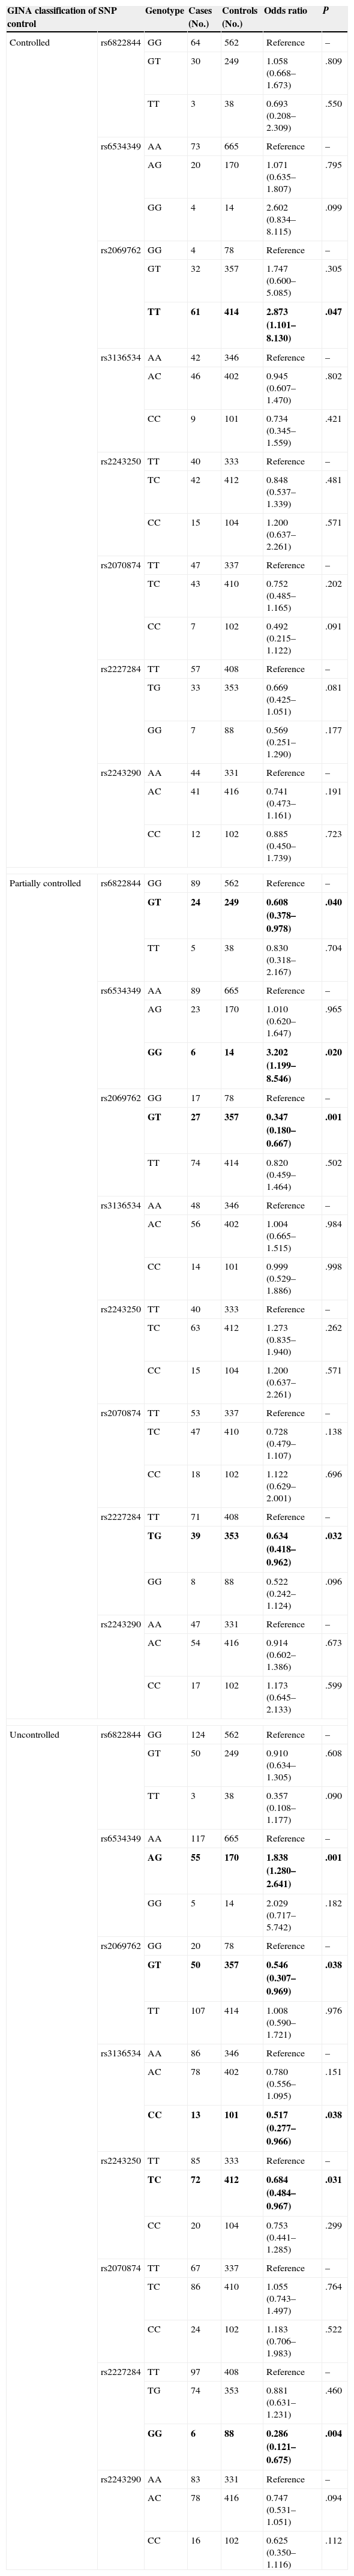
Asthmatic Risk Association Based on GINA Classification of Asthma ControlThe genotype distribution and risk association of the polymorphisms based on GINA classification of asthma control are shown in Table 3. For controlled asthma, only the IL-2 rs2069762 polymorphism was found to be associated with risk of the disorder (P=.047). None of the polymorphisms in the IL-4 gene appeared to confer a risk or protect its carriers from asthma. In the partially controlled asthma group, however, 3 IL-2 polymorphisms (rs6822822, rs2069762, rs6534349) and 1 IL-4 polymorphism (rs2227284) showed a risk association with asthma (P=.040, .001, .020 and .032, respectively). In the uncontrolled group, 5 polymorphisms, i.e. IL-2 rs6534349 (P=.001), rs2069762 (P=.038), and rs3136543 (P=.038), as well as IL-4 rs2243250 (P=.031) and rs2227284 (P=.004), showed significant asthmatic risk association.
Genotype Distribution and Risk Association in Asthmatic Children and Healthy Controls Based on GINA Classification of Asthma Control.
| GINA classification of control | SNP | Genotype | Cases (No.) | Controls (No.) | Odds ratio | P |
|---|---|---|---|---|---|---|
| Controlled | rs6822844 | GG | 64 | 562 | Reference | – |
| GT | 30 | 249 | 1.058 (0.668–1.673) | .809 | ||
| TT | 3 | 38 | 0.693 (0.208–2.309) | .550 | ||
| rs6534349 | AA | 73 | 665 | Reference | – | |
| AG | 20 | 170 | 1.071 (0.635–1.807) | .795 | ||
| GG | 4 | 14 | 2.602 (0.834–8.115) | .099 | ||
| rs2069762 | GG | 4 | 78 | Reference | – | |
| GT | 32 | 357 | 1.747 (0.600–5.085) | .305 | ||
| TT | 61 | 414 | 2.873 (1.101–8.130) | .047 | ||
| rs3136534 | AA | 42 | 346 | Reference | – | |
| AC | 46 | 402 | 0.945 (0.607–1.470) | .802 | ||
| CC | 9 | 101 | 0.734 (0.345–1.559) | .421 | ||
| rs2243250 | TT | 40 | 333 | Reference | – | |
| TC | 42 | 412 | 0.848 (0.537–1.339) | .481 | ||
| CC | 15 | 104 | 1.200 (0.637–2.261) | .571 | ||
| rs2070874 | TT | 47 | 337 | Reference | – | |
| TC | 43 | 410 | 0.752 (0.485–1.165) | .202 | ||
| CC | 7 | 102 | 0.492 (0.215–1.122) | .091 | ||
| rs2227284 | TT | 57 | 408 | Reference | – | |
| TG | 33 | 353 | 0.669 (0.425–1.051) | .081 | ||
| GG | 7 | 88 | 0.569 (0.251–1.290) | .177 | ||
| rs2243290 | AA | 44 | 331 | Reference | – | |
| AC | 41 | 416 | 0.741 (0.473–1.161) | .191 | ||
| CC | 12 | 102 | 0.885 (0.450–1.739) | .723 | ||
| Partially controlled | rs6822844 | GG | 89 | 562 | Reference | – |
| GT | 24 | 249 | 0.608 (0.378–0.978) | .040 | ||
| TT | 5 | 38 | 0.830 (0.318–2.167) | .704 | ||
| rs6534349 | AA | 89 | 665 | Reference | – | |
| AG | 23 | 170 | 1.010 (0.620–1.647) | .965 | ||
| GG | 6 | 14 | 3.202 (1.199–8.546) | .020 | ||
| rs2069762 | GG | 17 | 78 | Reference | – | |
| GT | 27 | 357 | 0.347 (0.180–0.667) | .001 | ||
| TT | 74 | 414 | 0.820 (0.459–1.464) | .502 | ||
| rs3136534 | AA | 48 | 346 | Reference | – | |
| AC | 56 | 402 | 1.004 (0.665–1.515) | .984 | ||
| CC | 14 | 101 | 0.999 (0.529–1.886) | .998 | ||
| rs2243250 | TT | 40 | 333 | Reference | – | |
| TC | 63 | 412 | 1.273 (0.835–1.940) | .262 | ||
| CC | 15 | 104 | 1.200 (0.637–2.261) | .571 | ||
| rs2070874 | TT | 53 | 337 | Reference | – | |
| TC | 47 | 410 | 0.728 (0.479–1.107) | .138 | ||
| CC | 18 | 102 | 1.122 (0.629–2.001) | .696 | ||
| rs2227284 | TT | 71 | 408 | Reference | – | |
| TG | 39 | 353 | 0.634 (0.418–0.962) | .032 | ||
| GG | 8 | 88 | 0.522 (0.242–1.124) | .096 | ||
| rs2243290 | AA | 47 | 331 | Reference | – | |
| AC | 54 | 416 | 0.914 (0.602–1.386) | .673 | ||
| CC | 17 | 102 | 1.173 (0.645–2.133) | .599 | ||
| Uncontrolled | rs6822844 | GG | 124 | 562 | Reference | – |
| GT | 50 | 249 | 0.910 (0.634–1.305) | .608 | ||
| TT | 3 | 38 | 0.357 (0.108–1.177) | .090 | ||
| rs6534349 | AA | 117 | 665 | Reference | – | |
| AG | 55 | 170 | 1.838 (1.280–2.641) | .001 | ||
| GG | 5 | 14 | 2.029 (0.717–5.742) | .182 | ||
| rs2069762 | GG | 20 | 78 | Reference | – | |
| GT | 50 | 357 | 0.546 (0.307–0.969) | .038 | ||
| TT | 107 | 414 | 1.008 (0.590–1.721) | .976 | ||
| rs3136534 | AA | 86 | 346 | Reference | – | |
| AC | 78 | 402 | 0.780 (0.556–1.095) | .151 | ||
| CC | 13 | 101 | 0.517 (0.277–0.966) | .038 | ||
| rs2243250 | TT | 85 | 333 | Reference | – | |
| TC | 72 | 412 | 0.684 (0.484–0.967) | .031 | ||
| CC | 20 | 104 | 0.753 (0.441–1.285) | .299 | ||
| rs2070874 | TT | 67 | 337 | Reference | – | |
| TC | 86 | 410 | 1.055 (0.743–1.497) | .764 | ||
| CC | 24 | 102 | 1.183 (0.706–1.983) | .522 | ||
| rs2227284 | TT | 97 | 408 | Reference | – | |
| TG | 74 | 353 | 0.881 (0.631–1.231) | .460 | ||
| GG | 6 | 88 | 0.286 (0.121–0.675) | .004 | ||
| rs2243290 | AA | 83 | 331 | Reference | – | |
| AC | 78 | 416 | 0.747 (0.531–1.051) | .094 | ||
| CC | 16 | 102 | 0.625 (0.350–1.116) | .112 | ||
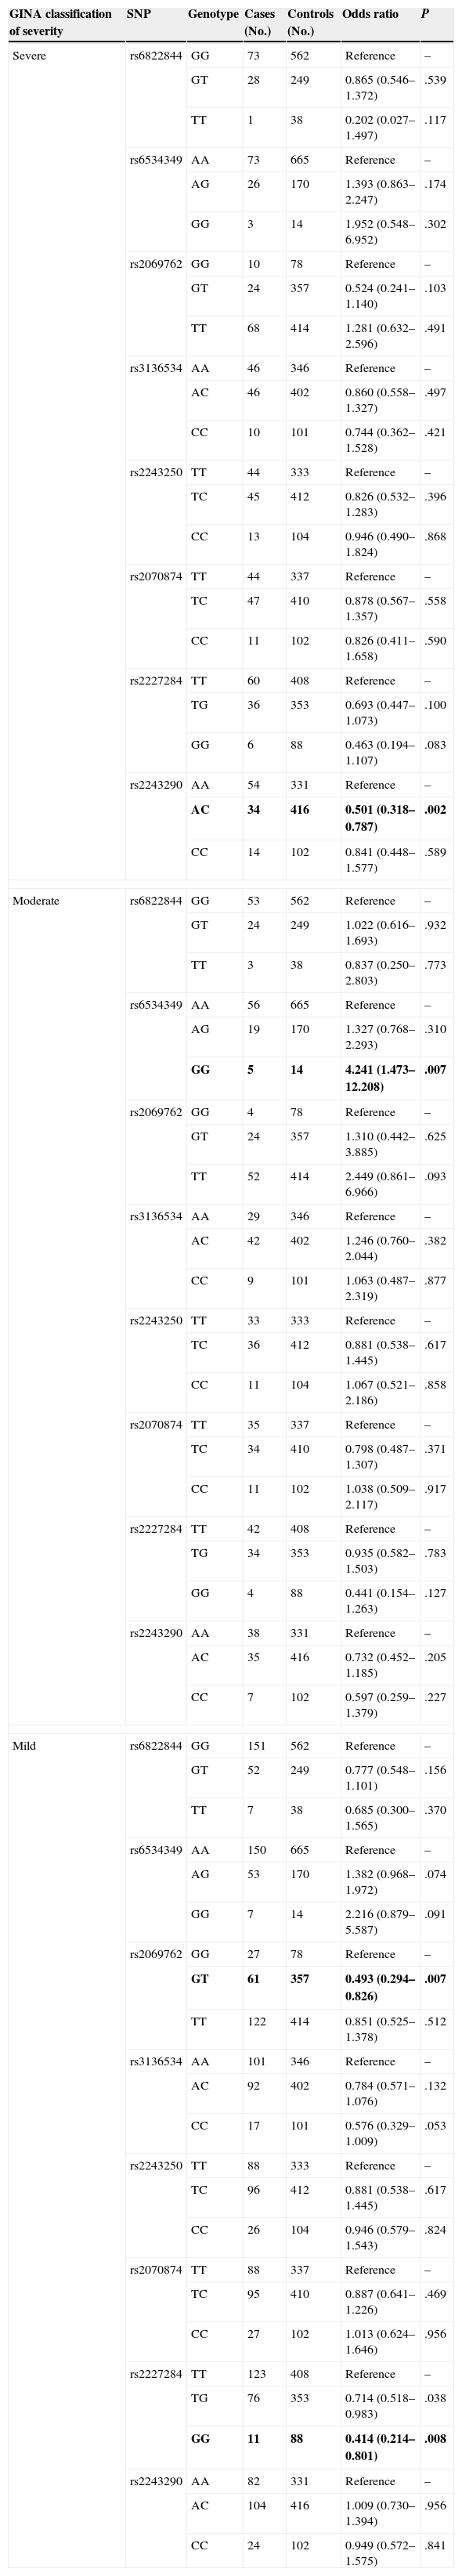
The distribution of polymorphism genotypes in patients with different levels of asthma severity is shown in Table 4, along with the corresponding risk association. For individuals with severe asthma, significant associations were observed for rs2243290 (P=.002). For moderate asthma, only rs6534349 was significant (P=.007). Finally, rs2069762 and rs2227284 polymorphisms were associated with a risk of mild asthma (P=.007 and P=.008, respectively).
Genotype Distribution and Risk Association in Asthmatic Children and Healthy Controls Based on GINA Classification of Asthma Severity.
| GINA classification of severity | SNP | Genotype | Cases (No.) | Controls (No.) | Odds ratio | P |
|---|---|---|---|---|---|---|
| Severe | rs6822844 | GG | 73 | 562 | Reference | – |
| GT | 28 | 249 | 0.865 (0.546–1.372) | .539 | ||
| TT | 1 | 38 | 0.202 (0.027–1.497) | .117 | ||
| rs6534349 | AA | 73 | 665 | Reference | – | |
| AG | 26 | 170 | 1.393 (0.863–2.247) | .174 | ||
| GG | 3 | 14 | 1.952 (0.548–6.952) | .302 | ||
| rs2069762 | GG | 10 | 78 | Reference | – | |
| GT | 24 | 357 | 0.524 (0.241–1.140) | .103 | ||
| TT | 68 | 414 | 1.281 (0.632–2.596) | .491 | ||
| rs3136534 | AA | 46 | 346 | Reference | – | |
| AC | 46 | 402 | 0.860 (0.558–1.327) | .497 | ||
| CC | 10 | 101 | 0.744 (0.362–1.528) | .421 | ||
| rs2243250 | TT | 44 | 333 | Reference | – | |
| TC | 45 | 412 | 0.826 (0.532–1.283) | .396 | ||
| CC | 13 | 104 | 0.946 (0.490–1.824) | .868 | ||
| rs2070874 | TT | 44 | 337 | Reference | – | |
| TC | 47 | 410 | 0.878 (0.567–1.357) | .558 | ||
| CC | 11 | 102 | 0.826 (0.411–1.658) | .590 | ||
| rs2227284 | TT | 60 | 408 | Reference | – | |
| TG | 36 | 353 | 0.693 (0.447–1.073) | .100 | ||
| GG | 6 | 88 | 0.463 (0.194–1.107) | .083 | ||
| rs2243290 | AA | 54 | 331 | Reference | – | |
| AC | 34 | 416 | 0.501 (0.318–0.787) | .002 | ||
| CC | 14 | 102 | 0.841 (0.448–1.577) | .589 | ||
| Moderate | rs6822844 | GG | 53 | 562 | Reference | – |
| GT | 24 | 249 | 1.022 (0.616–1.693) | .932 | ||
| TT | 3 | 38 | 0.837 (0.250–2.803) | .773 | ||
| rs6534349 | AA | 56 | 665 | Reference | – | |
| AG | 19 | 170 | 1.327 (0.768–2.293) | .310 | ||
| GG | 5 | 14 | 4.241 (1.473–12.208) | .007 | ||
| rs2069762 | GG | 4 | 78 | Reference | – | |
| GT | 24 | 357 | 1.310 (0.442–3.885) | .625 | ||
| TT | 52 | 414 | 2.449 (0.861–6.966) | .093 | ||
| rs3136534 | AA | 29 | 346 | Reference | – | |
| AC | 42 | 402 | 1.246 (0.760–2.044) | .382 | ||
| CC | 9 | 101 | 1.063 (0.487–2.319) | .877 | ||
| rs2243250 | TT | 33 | 333 | Reference | – | |
| TC | 36 | 412 | 0.881 (0.538–1.445) | .617 | ||
| CC | 11 | 104 | 1.067 (0.521–2.186) | .858 | ||
| rs2070874 | TT | 35 | 337 | Reference | – | |
| TC | 34 | 410 | 0.798 (0.487–1.307) | .371 | ||
| CC | 11 | 102 | 1.038 (0.509–2.117) | .917 | ||
| rs2227284 | TT | 42 | 408 | Reference | – | |
| TG | 34 | 353 | 0.935 (0.582–1.503) | .783 | ||
| GG | 4 | 88 | 0.441 (0.154–1.263) | .127 | ||
| rs2243290 | AA | 38 | 331 | Reference | – | |
| AC | 35 | 416 | 0.732 (0.452–1.185) | .205 | ||
| CC | 7 | 102 | 0.597 (0.259–1.379) | .227 | ||
| Mild | rs6822844 | GG | 151 | 562 | Reference | – |
| GT | 52 | 249 | 0.777 (0.548–1.101) | .156 | ||
| TT | 7 | 38 | 0.685 (0.300–1.565) | .370 | ||
| rs6534349 | AA | 150 | 665 | Reference | – | |
| AG | 53 | 170 | 1.382 (0.968–1.972) | .074 | ||
| GG | 7 | 14 | 2.216 (0.879–5.587) | .091 | ||
| rs2069762 | GG | 27 | 78 | Reference | – | |
| GT | 61 | 357 | 0.493 (0.294–0.826) | .007 | ||
| TT | 122 | 414 | 0.851 (0.525–1.378) | .512 | ||
| rs3136534 | AA | 101 | 346 | Reference | – | |
| AC | 92 | 402 | 0.784 (0.571–1.076) | .132 | ||
| CC | 17 | 101 | 0.576 (0.329–1.009) | .053 | ||
| rs2243250 | TT | 88 | 333 | Reference | – | |
| TC | 96 | 412 | 0.881 (0.538–1.445) | .617 | ||
| CC | 26 | 104 | 0.946 (0.579–1.543) | .824 | ||
| rs2070874 | TT | 88 | 337 | Reference | – | |
| TC | 95 | 410 | 0.887 (0.641–1.226) | .469 | ||
| CC | 27 | 102 | 1.013 (0.624–1.646) | .956 | ||
| rs2227284 | TT | 123 | 408 | Reference | – | |
| TG | 76 | 353 | 0.714 (0.518–0.983) | .038 | ||
| GG | 11 | 88 | 0.414 (0.214–0.801) | .008 | ||
| rs2243290 | AA | 82 | 331 | Reference | – | |
| AC | 104 | 416 | 1.009 (0.730–1.394) | .956 | ||
| CC | 24 | 102 | 0.949 (0.572–1.575) | .841 | ||
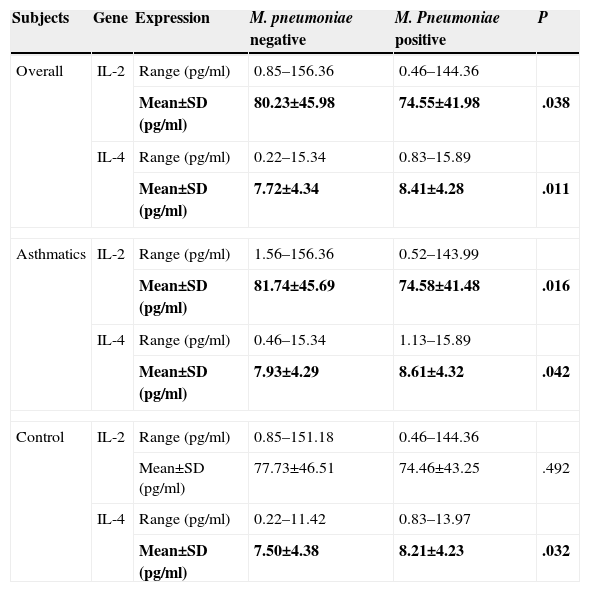
Table 5 shows serum expression levels (in terms of concentration) of IL-2 and IL-4 in M. pneumoniae-negative and positive subjects. Mean IL-2 concentration in M. pneumoniae-negative subjects was significantly higher than in M. pneumoniae-positive subjects (P=.038). The opposite was observed for IL-4 (P=.011).
IL-2 and IL-4 Serum Expression Level in M. pneumoniae-negative and Positive Subjects.
| Subjects | Gene | Expression | M. pneumoniae negative | M. Pneumoniae positive | P |
|---|---|---|---|---|---|
| Overall | IL-2 | Range (pg/ml) | 0.85–156.36 | 0.46–144.36 | |
| Mean±SD (pg/ml) | 80.23±45.98 | 74.55±41.98 | .038 | ||
| IL-4 | Range (pg/ml) | 0.22–15.34 | 0.83–15.89 | ||
| Mean±SD (pg/ml) | 7.72±4.34 | 8.41±4.28 | .011 | ||
| Asthmatics | IL-2 | Range (pg/ml) | 1.56–156.36 | 0.52–143.99 | |
| Mean±SD (pg/ml) | 81.74±45.69 | 74.58±41.48 | .016 | ||
| IL-4 | Range (pg/ml) | 0.46–15.34 | 1.13–15.89 | ||
| Mean±SD (pg/ml) | 7.93±4.29 | 8.61±4.32 | .042 | ||
| Control | IL-2 | Range (pg/ml) | 0.85–151.18 | 0.46–144.36 | |
| Mean±SD (pg/ml) | 77.73±46.51 | 74.46±43.25 | .492 | ||
| IL-4 | Range (pg/ml) | 0.22–11.42 | 0.83–13.97 | ||
| Mean±SD (pg/ml) | 7.50±4.38 | 8.21±4.23 | .032 | ||
When the subjects were classified according to presence of asthma, a similar trend was observed for asthmatic patients (P=.016 for IL-2; P=.042 for IL-4). Among non-asthmatic controls, however, IL-2 levels in M. pneumoniae-positive and negative subjects did not differ significantly (P=.492). Nonetheless, as in asthmatic subjects, a significantly lower mean concentration of IL-4 was observed among M. pneumoniae-negative subjects compared to M. pneumoniae-positive subjects (P=.032).
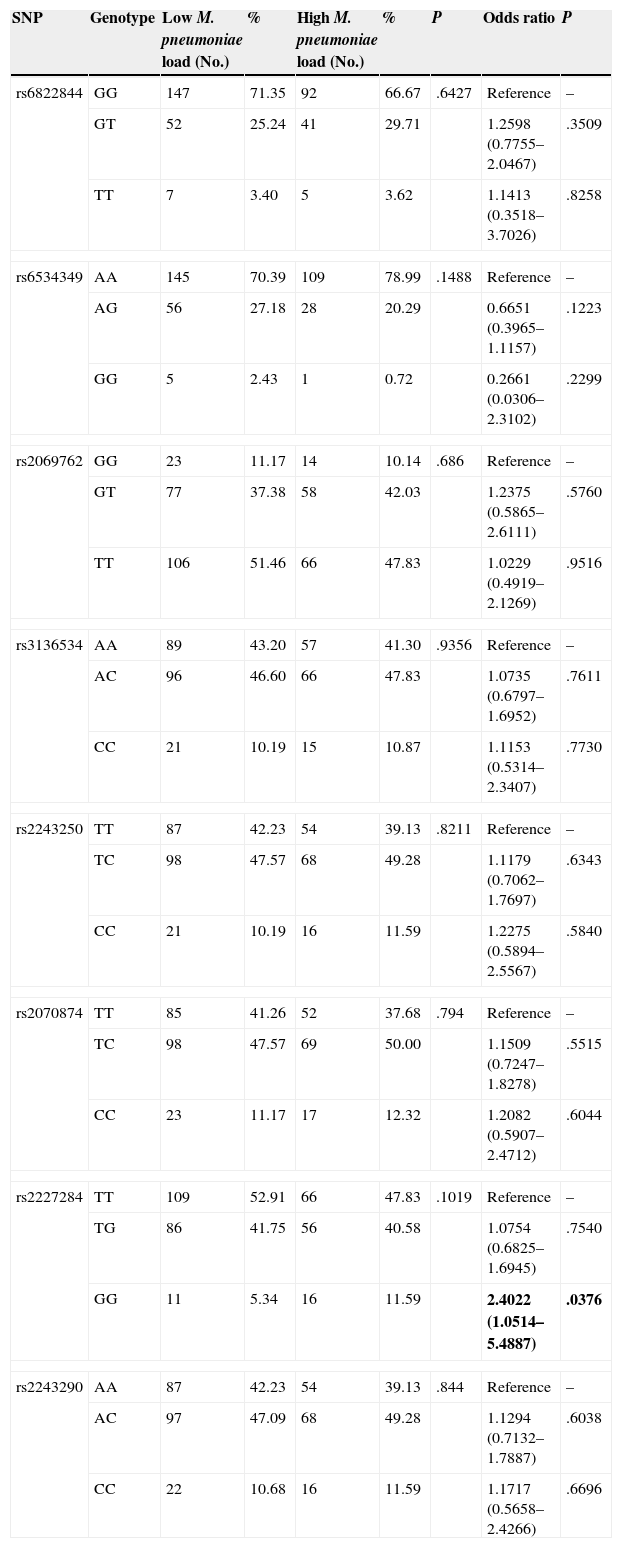
Genotype Distribution in M. pneumoniae-positive Subjects With Low- and High-load InfectionsTable 6 summarizes the distribution of genotypes of the 8 polymorphisms in M. pneumoniae-positive subjects with low and high bacterial loads. No significant difference was observed between the 2 study groups in terms of the genotypic distributions of all 8 polymorphisms (P>.05). None of the genotypic distributions deviated significantly from the Hardy-Weinberg equilibrium (P>.05).
Genotype Distribution and Risk Association in all Subjects With Low and High M. pneumoniae Loads.
| SNP | Genotype | Low M. pneumoniae load (No.) | % | High M. pneumoniae load (No.) | % | P | Odds ratio | P |
|---|---|---|---|---|---|---|---|---|
| rs6822844 | GG | 147 | 71.35 | 92 | 66.67 | .6427 | Reference | – |
| GT | 52 | 25.24 | 41 | 29.71 | 1.2598 (0.7755–2.0467) | .3509 | ||
| TT | 7 | 3.40 | 5 | 3.62 | 1.1413 (0.3518–3.7026) | .8258 | ||
| rs6534349 | AA | 145 | 70.39 | 109 | 78.99 | .1488 | Reference | – |
| AG | 56 | 27.18 | 28 | 20.29 | 0.6651 (0.3965–1.1157) | .1223 | ||
| GG | 5 | 2.43 | 1 | 0.72 | 0.2661 (0.0306–2.3102) | .2299 | ||
| rs2069762 | GG | 23 | 11.17 | 14 | 10.14 | .686 | Reference | – |
| GT | 77 | 37.38 | 58 | 42.03 | 1.2375 (0.5865–2.6111) | .5760 | ||
| TT | 106 | 51.46 | 66 | 47.83 | 1.0229 (0.4919–2.1269) | .9516 | ||
| rs3136534 | AA | 89 | 43.20 | 57 | 41.30 | .9356 | Reference | – |
| AC | 96 | 46.60 | 66 | 47.83 | 1.0735 (0.6797–1.6952) | .7611 | ||
| CC | 21 | 10.19 | 15 | 10.87 | 1.1153 (0.5314–2.3407) | .7730 | ||
| rs2243250 | TT | 87 | 42.23 | 54 | 39.13 | .8211 | Reference | – |
| TC | 98 | 47.57 | 68 | 49.28 | 1.1179 (0.7062–1.7697) | .6343 | ||
| CC | 21 | 10.19 | 16 | 11.59 | 1.2275 (0.5894–2.5567) | .5840 | ||
| rs2070874 | TT | 85 | 41.26 | 52 | 37.68 | .794 | Reference | – |
| TC | 98 | 47.57 | 69 | 50.00 | 1.1509 (0.7247–1.8278) | .5515 | ||
| CC | 23 | 11.17 | 17 | 12.32 | 1.2082 (0.5907–2.4712) | .6044 | ||
| rs2227284 | TT | 109 | 52.91 | 66 | 47.83 | .1019 | Reference | – |
| TG | 86 | 41.75 | 56 | 40.58 | 1.0754 (0.6825–1.6945) | .7540 | ||
| GG | 11 | 5.34 | 16 | 11.59 | 2.4022 (1.0514–5.4887) | .0376 | ||
| rs2243290 | AA | 87 | 42.23 | 54 | 39.13 | .844 | Reference | – |
| AC | 97 | 47.09 | 68 | 49.28 | 1.1294 (0.7132–1.7887) | .6038 | ||
| CC | 22 | 10.68 | 16 | 11.59 | 1.1717 (0.5658–2.4266) | .6696 | ||
The association between the 8 polymorphisms and the risk of predisposition to high-load M. pneumoniae infection is also shown in Table 6. Significant association was observed only in IL-4 rs2227284 polymorphism (P=.0376). No statistically significant association was observed for the other polymorphisms (P>.05).
DiscussionAsthma is a disorder of the airways which arises principally from chronic inflammation of the respiratory system, the symptoms of which are thought to be exacerbated by M. pneumoniae infection.5,6 Eradication of M. pneumoniae infection and the development of asthma may be influenced by cytokines, key mediators of immune and inflammatory reactions. Two important cytokines linked to the development of asthma are IL-2 and IL-4. We hypothesized that polymorphisms within IL-2 and IL-4 genes could be associated with a risk of asthma and M. pneumoniae infection in children.
We investigated the association of 4 IL-2 polymorphisms and 4 IL-4 polymorphisms with risk of asthma in children. Our results showed that the IL-2 rs6534349 polymorphism and IL-4 rs2227284 polymorphism could significantly increase and decrease asthma risk, respectively. The association appeared to be dose-dependent. In other words, the risk and protective effects of the polymorphisms were stronger when the variant alleles were present in 2 copies (homozygous variant) than in 1 copy (heterozygous). We also analyzed the association of the polymorphisms with different levels of asthma control and severity based on GINA classification. We found that among controlled patients, only one polymorphism (rs2069762) was associated with asthma risk, while four polymorphisms (rs6822844, rs6534349, rs2069762 and rs2227284) were associated with asthma risk among the partially controlled group, and five polymorphisms (rs6534349, rs2069762, rs3136534, rs2243250 and rs2227284) were associated with asthma risk among uncontrolled group. The association of increasing numbers of polymorphisms with increasing loss of control suggests the involvement of an extensive network of genetic interactions and highlights the complexity of the disease.
The number of polymorphisms significantly associated with asthma risk, however, was similar in patients with different levels of asthma severity. Mild asthma patients demonstrated risk associated with two polymorphisms (rs2069762 and rs2227284), whereas moderate and severe patients each demonstrated risk associated with one polymorphism (rs6534349 for moderate, rs2243290 for severe). It is interesting to note that entirely different polymorphisms were involved in asthmatic patients with different degrees of severity, suggesting that each polymorphism could exert a unique effect which contributes to the development of asthma. Nonetheless, it should be pointed out that when the analysis was performed according to levels of asthma severity, the sample size became too low to assure reliable data interpretation.14 This is one of the limitations of this study.
It may be that these polymorphisms could change the expression of protein products, thereby causing the risk modifications mentioned above.15 Specifically, it seems that the variant alleles of rs6822844, rs2069762 and rs3136534 polymorphisms could decrease the expression of protein products, while those of rs6534349, rs2243250, rs2227284 and rs2243290 polymorphisms could increase the expression of protein products. Our hypothesis is based on the fact that IL-2 is a pro-inflammatory cytokine, so increased expression of IL-2 may produce a higher level of inflammation, facilitating the development of asthma, and vice versa.16 In contrast, IL-4 is an anti-inflammatory protein, and increased IL-4 expression can lead to reduced inflammation, which in turn would protect the host from asthma, and vice versa. However, further research is needed to confirm this.
A lack of association was observed between rs2070874 polymorphism and the risk of asthma in all classifications of study subjects (i.e. overall, classification based on GINA control, and classification based on GINA severity), suggesting that this polymorphism is not involved in the development of asthma.
The difference in IL-2 and IL-4 serum expression levels was also compared between subjects with and without M. pneumoniae infection, who were seen to have significantly higher levels of IL-2 and IL-4 expression, respectively. This finding was not unexpected, as inflammation is one of the earliest responses of the immune system.17 It seems likely that a higher IL-2 level, which triggers inflammation, plays a role in fighting off pathogenic infections.18 Subjects with a higher level of IL-2 were therefore M. pneumoniae-negative. The relationship between IL-2 levels and M. pneumoniae infection appeared to be significant only among asthmatic patients, but not the controls. This observation concurs with the fact that IL-2 plays an important role in the pathogenesis of asthma.19 In contrast, IL-4 suppresses inflammation, and a high level of IL-4 does not allow the host immune system to function in an optimum state. Patients with higher IL-4 were therefore M. pneumoniae-positive, regardless of whether they were asthmatic or non-asthmatic.
A higher M. pneumoniae load has been associated with worse clinical severity in respiratory diseases.20 Therefore, we further compared the distribution of the 8 IL-2 and IL-4 polymorphisms in subjects with high-load and low-load M. pneumoniae to find out whether any of the polymorphisms is associated with low-load infection. No significant difference was observed in the distribution of the polymorphisms between the two groups, but significant risk association was observed for the homozygous variant genotype of rs2227284 polymorphism. This suggests that the homozygous variant genotype of rs2227284 polymorphism could predispose its carriers to high-load M. pneumoniae infection, and is in line with Wang et al.21 who showed that the rs2227284 polymorphism could affect humoral response.
In fact, several studies have investigated the association of various polymorphisms within IL-2 and IL-4 genes with asthma risk.22–24 However, the majority of these studies incorporated only one or two polymorphisms in their analysis. This may result in misleading interpretations, as the effect of a polymorphism could be compensated by the presence of the other polymorphisms within the same gene.25 The strength of our study lies in the incorporation of a large number of polymorphisms within two closely-related genes.
ConclusionsIn this study, we identified two polymorphisms which could serve as predictive biomarkers for estimating asthma risk in children. We also showed that serum IL-2 and IL-4 levels differed significantly between subjects with and without M. pneumoniae infection. Among M. pneumoniae-positive subjects, the rs2227284 GG genotype was significantly linked to increased likelihood of presenting high-load infection. However, we recognize that this study has several limitations, such as the small sample size, especially in terms of subjects with M. pneumoniae infection. Further studies with larger sample sizes are needed in this area.
FundingThis study was supported by the personal funds of the authors.
Authors’ ContributionsR.S.W. and H.X.J. recruited the study subjects, extracted DNA from all the samples and performed detection of Mycoplasma pneumoniae infection. S.Q.S. genotyped the SNPs and drafted the manuscript. X.Y.L. and S.J.C. quantified the serum expression levels of IL-2 and IL-4 and performed statistical analysis. Z.B.J. was responsible for the study conception, and participated in its design and coordination and helped to draft the manuscript. All authors read and approved the final manuscript.
Conflict of InterestsThe authors declare they have no conflict of interest directly or indirectly related to the manuscript contents.
We thank the nurses from our hospitals for their help in subject recruitment. This study was funded by the authors.
Please cite this article as: Wang R-S, Jin H-X, Shang S-Q, Liu X-Y, Chen S-J, Jin Z-B. Relación entre la expresión de IL-2 e IL-4 y sus polimorfismos y los riesgos de padecer infección por Mycoplasma pneumoniae y asma en niños. Arch Bronconeumol. 2015;51:571–578.


